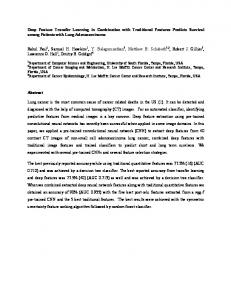
signed as well [9]. The transfer of knowledge between source and target domains ..... Columns respectively show the dataset name, the number of normal ...
Feature Selection by Transfer Learning with Linear Regularized Models Thibault Helleputte1,2 and Pierre Dupont1,2 1
University of Louvain, Computing Science and Engineering Dept., Reaumur Building, Place Sainte Barbe 2, B-1348 Louvain-la-Neuve, Belgium 2 University of Louvain, Machine Learning Group {Thibault.Helleputte,Pierre.Dupont}@uclouvain.be
Abstract. This paper presents a novel feature selection method for classification of high dimensional data, such as those produced by microarrays. It includes a partial supervision to smoothly favor the selection of some dimensions (genes) on a new dataset to be classified. The dimensions to be favored are previously selected from similar datasets in large microarray databases, hence performing inductive transfer learning at the feature level. This technique relies on a feature selection method embedded within a regularized linear model estimation. A practical approximation of this technique reduces to linear SVM learning with iterative input rescaling. The scaling factors depend on the selected dimensions from the related datasets. The final selection may depart from those whenever necessary to optimize the classification objective. Experiments on several microarray datasets show that the proposed method both improves the selected gene lists stability, with respect to sampling variation, as well as the classification performances.
1
Introduction
Classification of microarray data is a challenging problem as it typically relies on a few tens of samples but several thousand dimensions (genes). The number of microarray experiments needed to obtain robust models is generally orders of magnitude higher than the actual size of most datasets [1]. The number of available datasets is however continuously rising. Large databases like the NCBI’s Gene Expression Omnibus (GEO) [2] or the EBI’s ArrayExpress [3] offer tens of thousand microarray samples which are well formatted and documented. The construction of a large microarray dataset consisting of the simple juxtaposition of independent smaller datasets would be difficult or irrelevant due to differences either in terms of biological topics, technical constraints or experimental protocols. Transfer learning techniques have been designed to overcome situations where too few samples for the task at hand are available, but where experience from slightly different tasks is available [4,5]. Knowledge is extracted from previous experience (source domains) to help solving the new problem (target domain). W. Buntine et al. (Eds.): ECML PKDD 2009, Part I, LNAI 5781, pp. 533–547, 2009. c Springer-Verlag Berlin Heidelberg 2009 �
534
T. Helleputte and P. Dupont
Samples of source and target domains are supposed to be drawn from similar but different distributions. This setting contrasts with semi-supervised learning where samples are supposed to be drawn from the same distribution but where some unlabeled samples are used to build the model [6]. Inductive transfer approaches require labeled data both for the source and target domains [7]. The target domain examples are unlabeled for transductive transfer methods [8] while fully unsupervised transfer techniques have been designed as well [9]. The transfer of knowledge between source and target domains may concern the examples [10,11,12], some model parameters [13,14] or, as in the present work, the feature space [7,15,16]. In multi-task learning [7] a common feature representation is learned at the same time for several tasks. Structural correspondence learning [15] uses features supposed to be relevant for several domains to generate new features for the target domain. An alternative method compares learning tasks by measuring a distance between relevance weights on a set of common features [16]. In contrast to those approaches for transferring feature representation, the transferred knowledge in our method can be automatically partly or fully dropped whenever it does not help to optimize the classification objective on the target domain. As a result, the specific choice of source datasets is not too critical. Benefits of transfer learning have been reported mainly as a gain in classification performances but, as detailed below, the proposed approach also improves the stability of the selected features. In the particular context of microarray data, feature selection is commonly performed, both to increase the interpretability of the predictive model and possibly to reduce its cost [17,18]. In some cases feature selection has also been shown to improve classification accuracy [19]. Biomarker selection specifically refers to the identification of a small set of genes, also called a signature, related to a pathology or to an observed clinical outcome after a treatment. The lack of robustness of biomarker selection has been outlined [20]. A good signature is ideally highly stable with respect to sampling variation. In the context of biomarker selection from microarray data, high stability means that different sub-samples of patients lead to very similar sets of biomarkers. This is motivated by the assumption that the biological process explaining the outcome is mostly common among different patients. Support Vector Machines (SVMs) are particularly convenient to classify high dimensional data with only a few samples. In their simplest form, SVMs simply reduce to maximal margin hyperplanes in the input space. Such models were shown to successfully classify microarray data either on the full input space [21] or combined with feature selection [22,23,24]. The latter approaches are embedded as the selection directly uses the classifier structure. In the present work we rely on another embedded selection method with linear models, called l1-AROM [25]. This specific choice is motivated by the possibility to extend this approach in a simple yet efficient way to perform transfer learning by biasing the optimization procedure towards certain dimensions. We proposed recently such a partially supervised (PS) extension [26] but the favored
Feature Selection by Transfer Learning
535
dimensions were then defined from prior knowledge. In the context of microarray data, molecular biologists may indeed sometimes guess that a few genes should be considered a priori more relevant. In the present work, we do not use such prior knowledge but rather related datasets, hence performing inductive transfer learning at the feature level. The additional benefits are a fully automated feature selection procedure and the possibility to choose the number of features to be transferred independently of some expert knowledge. A practical approximation of this technique reduces to learn linear SVMs with iterative rescaling of the inputs. The rescaling factors depend here on previously selected features from existing datasets. This initial feature selection on source domains is performed using a simple univariate t-test ranking while the final iterative selection is intrinsically multivariate. Using an initial univariate selection on the source domains is both computationally efficient and arguably a relevant starting point before transferring to a distinct target domain. As shown in our experiments this choice results in significant stability and classification performance improvements. The rest of the paper is organized as follows. Section 2 briefly reviews the l1-AROM and l2-AROM feature selection techniques. Section 3 describes our partially supervised feature selection technique extending the AROM methods. Section 4 details how to use this technique to perform transfer learning. Experiments on microarray datasets are reported in section 5. Conclusions and future perspectives are discussed in section 6.
2
The AROM Methods
Given m examples xi ∈ Rn and the corresponding class labels yi ∈ {±1} with i = 1, ..., m, a linear model g(x) predicts the class of any point x ∈ Rn as follows. g(x) = sign(w · x + b)
(1)
Feature selection is closely related to a specific form of regularization of this decision function to enforce sparsity of the weight vector w. Weston et al. [25] study in particular the zero-norm minimization subject to linear margin constraints: min ||w||0 subject to yi (w · xi + b) ≥ 1 w
(2)
where ||w||0 = card{wj |wj �= 0} and card is the set cardinality. Since problem (2) is NP-Hard, a log l1-norm minimization is proposed instead. min w
n �
ln(|wj | + �) subject to yi (w · xi + b) ≥ 1
(3)
j=1
where 0 < � � 1 is added to smooth the objective when some |wj | vanishes. The natural logarithm in the objective facilitates parameter estimation with a simple gradient descent procedure. The resulting algorithm l1-AROM1 iteratively optimizes the l1-norm of w with rescaled inputs. 1
AROM stands for Approximation of the zero-norm minimization.
536
T. Helleputte and P. Dupont
The l2-AROM method further approximates this optimization by replacing the l1-norm by the l2-norm. Even though such an approximation may result in a less sparse solution, it is very efficient in practice when m � n. Indeed, a dual formulation may be used and the final algorithm boils down to a linear SVM estimation with iterative rescaling of the inputs. A standard SVM solver can be iteratively called on properly rescaled inputs. A smooth feature selection occurs during this iterative process since the weight coefficients along some dimensions progressively drop below the machine precision while other dimensions become more significant. A final ranking on the absolute values of each dimension can be used to obtain a fixed number of features.
3
The Partially Supervised AROM Methods
Whenever some knowledge on the relative importance of each feature is available (either from actual prior knowledge or from a related dataset), the l1-AROM objective can be modified by adding a prior relevance vector β = [β1 , ..., βn ]t defined over the input dimensions. Let βj > 0 denote the relative prior relevance of the j th feature, the higher its value the more relevant the corresponding feature is a priori assumed. In practice, only a few dimensions can be assumed more relevant (e.g. βj > 1) while the vast majority of remaining dimensions are not favored (e.g. βj = 1). Section 5 further discusses the practical definition of β. In contrast with semi-supervised learning, this is a form of partial supervision (PS) on the relevant dimensions rather than the labels. The optimization problem of PS-l1-AROM is defined to penalize less the dimensions which are assumed a priori more relevant: min w
n � 1 ln(|wj | + �) subject to yi (w · xi + b) ≥ 1 β j=1 j
(4)
It was recently shown how problem (4) can be reformulated as an iterated l1norm optimization with margin constraints on rescaled inputs [26]: min � w
n �
|wj� | subject to yi (w� · (xi ∗ wk ∗ β) + b) ≥ 1
(5)
j=1
where ∗ denotes the component-wise product and the initial weight vector is defined as w0 = [1, . . . , 1]t . At iteration k + 1, problem (5) is solved given the previous weight vector wk and the fixed relevance vector β, and the process is iterated till convergence. Similarly to the l2-AROM method presented in section 2, problem (5) can be approximated by replacing the l1-norm by the l2-norm. This modification results in PS-l2-AROM, a practical approach which is both easy to implement and computationally more efficient. The l2-norm formulation indeed reduces to estimate linear SVMs with iteratively rescaled margin constraints. The original l2-AROM method is obtained when βj = 1 (∀j), in other words, without prior
Feature Selection by Transfer Learning
Fig. 1. 2D-representation of the Zero-Norm Approximation by t
�
1 j βj
537
ln |wj |. Left:
without prior relevance (β = [1, 1] ). Right: with prior relevance (β = [5, 1]t ).
preference between the input features. PS-l2-AROM further uses the relevance vector β to smoothly favor certain dimensions within the selection process. Figure 1 illustrates why problem (3) is a good approximation to the zero-norm minimization. This objective is nearly flat on the whole space of parameters w except when a specific wj tends towards zero. The objective is there strongly minimized. It also illustrates what happens if this objective is modified by introducing prior relevance on dimensions, as in problem (4). The objective function is again nearly flat everywhere but the gradient is now even smaller along a dimension corresponding to a larger βj .
4
Transfer Learning with PS-l2-AROM
We discuss here how to use the PS-l2-AROM method for transfer learning. Let the Target Domain DT be a set of samples xi ∈ Rn , generated according to a distribution PT (x), and associated class labels yi ∈ {±1} following PT (y|x), i = 1, ..., m. The task is to build a robust classification model gT (x) and to identify a discriminative signature ST for DT . It is generally possible to find related datasets, called Source Domains DS , for which PS (y|x) ≈ PT (y|x) but PS (x) �= PT (x). For example, several microarray datasets are available on GEO [2] for which the class labels correspond to the same concepts, cancer tissue or normal tissue, but for which the gene expression distributions differ. There are many sources of divergence such as the type of biological samples, the RNA extraction protocol, the normalization steps applied to raw data, etc. It is possible to use a partially supervised feature selection method as a transfer learning technique. The proposed approach is an inductive transfer learning technique since the class labels are known both for DS and DT . We assume that the data from all domains share a sufficiently large set of n features and, without
538
T. Helleputte and P. Dupont
loss of generality, that feature index j in DS maps to the same index in DT . The proposed approach simply uses any convenient feature selection on DS to build an initial signature SS . A prior relevance vector β ∈ Rn is defined from SS to favor the actual selection of some dimensions on DT : � B ∀j ∈ SS βj = (6) 1 ∀j ∈ / SS where B > 1 corresponds to the weight to favor features belonging to SS . The choice of B is arbitrary but experiments reported in section 5.6 illustrate that the proposed method is not sensitive to a specific choice for a large range of possible values. The vector β is used to bias the selection of features on DT via PS-l2-AROM to obtain a final signature ST . The selection on DT is influenced by the knowledge extracted from DS , i.e. a set of indexes of relevant features. Those transferred features are assumed relevant for DS but not necessarily highly discriminative on DT , since PS (x) �= PT (x). Our modeling assumption is however that the features extracted from similar tasks provide useful information as compared to selecting features only from a single domain DT . This assumption is confirmed by our practical experiments reported in section 5. Any standard feature selection method can be used for the initial selection on DS . We recommend in particular the use of a simple univariate technique such as a t-test ranking. It is computationally efficient and this initial selection is not meant to be highly accurate on DS but to guide the detailed selection to be performed eventually on DT .
5
Data and Experiments
This section describes and evaluates several practical ways of transfer learning based on the partially supervised feature selection implemented in PS-l2-AROM. Three prostate cancer microarray datasets are presented in section 5.1. We detail in section 5.2 the metrics used to assess the stability of selected features and classification performances. Baseline results are obtained with no transfer, that is by applying the l2-AROM feature selection technique on a given dataset. Improved stability and classification performances are obtained with a single transfer. This first protocol uses one related dataset as source domain to guide the selection on the target domain (section 5.3). Further improvements can be obtained with multiple transfer which combines several source domains (section 5.4). Experimental results are presented in section 5.5. Finally, the sensitivity to a specific choice of the prior weight value (the B parameter) is analyzed in section 5.6. In a nutshell those experimental results show that transfer learning based on partially supervised feature selection always leads to a gain in stability as well as a systematic gain in classification performance for signature sizes of interest. 5.1
Microarray Data
Table 1 presents the main characteristics of the three prostate cancer microarray datasets used in this experimental section. For convenience, datasets will
Feature Selection by Transfer Learning
539
Table 1. Microarray prostate datasets. Columns respectively show the dataset name, the number of normal samples, the number of tumor samples, the original number of features and the type of Affymetrix chips used. dataset Normal Tumor Features Singh Chandran Welsh
50 18 9
52 86 25
Chip
12,625 HGU95Av2 12,625 HGU95Av2 12,626 HGU95A
be named after the first author of the publication along which they were made available (Singh [27], Chandran [28] and Welsh [29]). In the original publications, the task is almost the same for the three datasets: binary classification between tumor and normal tissues. In Chandran, tumor samples are of two types: primary tumor and metastatic tumor. Tumor samples in Welsh correspond to 24 primary tumors and 1 lymph node metastasis. No precision is made about the type of tumor tissue in Singh. The microarray technology used to produce those datasets is the same for Singh and Chandran, but is a bit older for Welsh (see table 1). Consequently, features (genes) present on each type of chip differ very slightly. Samples and RNA extraction were also performed according to different protocols. The internal normalization to produce one value for each feature also differ from set to set. All these differences make their simple combination in a larger dataset irrelevant. The three datasets are here reduced to the set of 12,600 features they share in common. 5.2
Evaluation Metrics
Stability measures to which extent k sets S of s selected features (gene signatures) share common features. Those sets can typically be produced by selecting features from different samplings of the data. Kuncheva [30] proposed such a stability index: K({S1 , . . . , Sk }) =
k−1 k � � |Si ∩ Sj | − 2 2 k(k − 1) i=1 j=i+1 s − sn
s2 n
(7)
where n is the total number of features, and Si , Sj are two signatures built from 2 different subsets of the training samples. The sn ratio in this formula corrects a bias due to the chance of selecting common features among two sets chosen at random. This correction motivates our use of this particular stability index. This index satisfies −1 < K ≤ 1 and the greater its value the largest the number of commonly selected features in the various sets. A negative index for a set of signatures means that feature sharing is mostly due to chance. Stability alone cannot characterize the quality of a subset of features. Indeed, if a large randomly chosen set of features were purely forced in every signature, the stability would be very high, but the model built on those features would
540
T. Helleputte and P. Dupont
likely have a poor classification performance. This performance is assessed here with the Balanced Classification Rate: � � TN 1 TP + BCR = (8) 2 P N where T P (resp. T N ) is the number of positive (resp. negative) test samples correctly predicted as positive (resp. negative) among the P positive (resp. N negative) test samples. BCR is preferred to accuracy because microarray datasets often have unequal class priors. BCR is the average between specificity and sensitivity, two very common measures in the medical domain. BCR can also be generalized to multi-class problems more easily than ROC analysis. 5.3
Single Transfer
Our first experimental protocol uses (k = 200) random 90%-10% samplings from the target domain DT . Each 90% fraction forms a training set. These samples are first normalized to zero median and unit standard deviation. Features are then selected via PS-l2-AROM and a linear soft-margin SVM is built on the selected dimensions. Each 10% fraction forms the associated test samples that are preprocessed according to the training normalization parameters. The vector β used for PS-l2-AROM is set by selecting a signature SS on DS with a t-test ranking2 . The 50 top ranked features define SS , which is a common default signature size for biomarker selection. The feature selection is performed on DT while favoring the genes from SS according to: � 10 ∀j ∈ SS (9) βj = 1 ∀j ∈ / SS Here DS is a single dataset different from DT . Given the three datasets available, six combinations of DS and DT are tested. Stability over the 200 samplings and averaged BCR performances are reported. For comparison purposes, the same protocol is performed with no transferred knowledge, i.e. with βj = 1 , ∀j ∈ 1, ..., n. 5.4
Multiple Transfer
When several datasets are available as source domains it may be useful to combine the knowledge extracted from each of them to guide the feature selection on the target domain DT . Such a multiple transfer protocol is described below with two source domains. The extension to more than two source domains is straightforward. 2
This univariate filtering method ranks genes according to
�
μj+ −μj− 2 /m +σ 2 /m σj+ + − j−
, where
μj+ (resp. μj− ) is the mean expression value of the gene j for the m+ positively (resp. m+ negatively) labeled samples, and σj+ , σj− are the associated standard deviations.
Feature Selection by Transfer Learning
541
A signature SS of 50 features is extracted from the source domains DS1 ,S2 and applied to DT via PS-l2-AROM. Features are ranked according to a t-test on each source dataset. The p best ranked features are selected from each source dataset and the intersection of those two signatures is computed. The parameter p is chosen such that the size of the intersection is 50. The rationale behind this choice is to transfer the same amount of knowledge in DT as compared to the single transfer protocol. The values of p used for the three � possible combinations of the available source datasets are 557 for (Singh Chandran), 275 for � � (Welsh Singh) and 385 for (Welsh Chandran). Those differences result from the fact that some combinations have more top ranked features in common than others. For example, the number of features needed to build an intersected signature of 50 genes is about twice as much for Singh and Chandran as compared to Singh and Welsh. This could explain why using Singh rather than Chandran as DS for Welsh as DT gives better results in a single transfer protocol (see section 5.5). 5.5
Results
Figures 2 and 3 respectively show the BCR and the stability results for various signature sizes |ST |. For signatures significantly larger than the transferred knowledge (|SS | = 50) results are equivalent to baseline results (no transfer). In contrast, for signature sizes of practical interest (a few tens of genes), there is a large increase both in classification performance and stability. For example, transferring knowledge from Singh to Welsh (top of fig. 2) improves the average BCR from 79.6% (resp. 65.7%) for a signature size of 16 (resp. 10) genes up to more than 99.2% (resp. 98.7%). Those differences are statistically significant according to the corrected resampled t-test3 proposed in [31]. BCR results on the Chandran and Singh target datasets follow the same trends. Multiple transfer may further improve the BCR performances. This is in particular the case on the Chandran dataset (center of fig. 2) with transferred � knowledge from Welsh Singh. For example, the BCR differences are statistically significant (p-value ≤ 0.025) between a single transfer and a multiple transfer with a final signature of 10 genes. In general, multiple transfer BCR results are always equivalent or better than single transfer results. Multiple transfer thus offers a more robust approach not requiring to carefully select which source domain need to be considered for a given target domain. Transfer learning always improves the stability of the selected gene lists as illustrated in Fig. 3. The maximal stability is often reached around 50 features, which comes with no surprise since precisely 50 genes are favored during the selection on the target domain. However this maximal stability does not reach 100% which illustrates that the selected genes are not just those belonging to SS . 3
Such a test corrects for the fact that the various test sets are not independent since they may overlap. The BCR differences are significant with a (likely conservative) p-value = 1.9 × 10⁻² for 16 genes and a p-value = 2.6 × 10⁻⁴ for 10 genes.
542
T. Helleputte and P. Dupont 1 0.95 0.9
BCR
0.85 0.8 0.75 0.7 0.65 0.6
No Transfer Chandran Prior Singh Prior Inter Singh-Chandran Prior Random Prior 4096
1024 256 64 16 Number of selected features
4
1 0.95 0.9
BCR
0.85 0.8 0.75 0.7 0.65 0.6
No Transfer Welsh Prior Singh Prior Inter Welsh-Singh Prior Random Prior 4096
1024 256 64 16 Number of selected features
4
1 0.95 0.9
BCR
0.85 0.8 0.75 0.7 0.65 0.6
No Transfer Chandran Prior Welsh Prior Inter Welsh-Chandran Prior Random Prior 4096
1024 256 64 16 Number of selected features
4
Fig. 2. Classification performances (Balanced Classification Rate) obtained on Welsh (top), Chandran (center) and Singh (bottom). No Transfer is the baseline for which features are selected on the target dataset without prior preference. The next two curves specify which dataset was used in a single transfer setting. The fourth curve refers to the multiple transfer setting.
Feature Selection by Transfer Learning
543
1 0.9
Kuncheva Index
0.8 0.7 0.6 0.5 0.4 0.3
No Transfer Chandran Prior Singh Prior Inter Singh-Chandran Prior Random Prior 4096
1024 256 64 16 Number of selected features
4
1 0.9
Kuncheva Index
0.8 0.7 0.6 0.5 0.4 0.3
No Transfer Welsh Prior Singh Prior Inter Welsh-Singh Prior Random Prior 4096
1024 256 64 16 Number of selected features
4
1 0.9
Kuncheva Index
0.8 0.7 0.6 0.5 0.4 0.3
No Transfer Chandran Prior Welsh Prior Inter Welsh-Chandran Prior Random Prior 4096
1024 256 64 16 Number of selected features
4
Fig. 3. Signature stability (Kuncheva index) obtained on Welsh (top), Chandran (center) and Singh (bottom). No Transfer is the baseline for which features are selected on the target dataset without prior preference. The next two curves specify which dataset was used in a single transfer setting. The fourth curve refers to the multiple transfer setting.
544
T. Helleputte and P. Dupont
5.6
Impact of Prior Relevance Weight
In the experiments described in section 5.5, the value B = 10 was chosen to favor some dimensions via PS-l2-AROM. The influence of a specific choice of the B value on stability and classification performances is analyzed in this section. We detail experiments with multiple transfer since this approach offers the best results so far. Figure 4 displays stability and BCR results for B = {1, 2, 5, 10, 100, 1000} on Welsh. The curves for B = 1 and B = 10 correspond to the previous settings respectively with no transfer and multiple transfer. Equivalent trends are observed on the other datasets (results not shown). The influence of the B value can be summarized as follows. Results show that the higher the B value the stronger the stability peak around 50 features. This is a logical consequence of the design of PS-l2-AROM. The stability is not influenced for signature sizes |ST | significantly larger than 50 features except for a very large B = 1000. For signature sizes smaller than 50 a better stability is obtained with B in the range [10, 100]. BCR results show a positive effect of the partial supervision as soon as B is greater than 5. The proposed approach is not highly sensitive to a specific choice of B in the range [5, 100]. The default value of B = 10 offers a reasonable choice overall. Hence the proposed approach does not require to carefully optimize the meta-parameter B in a nested validation loop. 1
1
0.9
0.95 0.9 0.85
0.7
BCR
Kuncheva Index
0.8
0.6
0.8 0.75
0.5 0.4 0.3
B=1 B=2 B=5 B=10 B=100 B=1000 4096
0.7 0.65 0.6 1024 256 64 16 Number of selected features
4
B=1 B=2 B=5 B=10 B=100 B=1000 4096
1024 256 64 16 Number of selected features
4
Fig. 4. Impact of the prior relevance weight on signature stability (Kuncheva index) and classification performances (Balanced Classification Rate) on Welsh
6
Conclusions and Perspectives
We address in this paper the problem of transfer learning for feature selection and classification of high dimensional data, such as those produced by microarray experiments. We propose a feature selection method on a target domain that can be partially supervised (PS) from features previously extracted from related source domains. Such knowledge can be acquired from public databases like GEO [2] or ArrayExpress [3]. The initial feature selection on the source domains is typically performed with a fast univariate technique. The purpose of this initial selection is to guide the selection process on the target domain.
Feature Selection by Transfer Learning
545
We rely here on our recently proposed PS-l2-AROM method, a feature selection approach embedded within the estimation of a regularized linear model [26]. This algorithm reduces to linear SVM learning with iterative rescaling of the input features. The scaling factors depend here on the selected dimensions on the source domains. The proposed optimization procedure smoothly favors the preselected features but the finally selected dimensions may depart from those to optimize the classification objective under rescaled margin constraints. Practical experiments on several microarray datasets illustrate that the proposed approach not only increases classification performances, a usual benefit of a sound transfer learning scheme, but also the stability of the selected dimensions with respect to sampling variation. We also show how a multiple transfer from various source domains can bring further improvements. The proposed approach relies on a meta-parameter defining the prior weight of the favored dimensions during the partially supervised feature selection. We show experimentally that this method is not sensitive to a specific choice of this parameter for a large range of possible values. Distinct weight values for different features could also be considered in the future. One could for instance define those weights as a function of the p-values of the initial t-test. Here the t-test was applied on the source domain(s) but it could also be interesting to compute the t-test on the target domain itself, hence without transfer. The combination of a simple feature ranking method and the partially supervised feature selection could already improve stability and/or classification performances on a given dataset. We rely on a simple univariate selection on the source domain(s). The purpose of this initial selection is indeed not to be highly accurate since the final and more refined selection is performed on a distinct target domain. Our current choice is a simple t-test ranking for this initial selection. Several alternatives could however be considered, including a multivariate embedded selection method such as L2AROM. More importantly, the size of the initial signature extracted from the source domain(s) is currently fixed to 50 genes. This is a common default value for biomarker selection and it offers very good performances. It would however be interesting to investigate further the influence of this size on the quality of the final selection. A related issue would be the automatic selection of the best source domain(s) for a given target domain and the number of features to be extracted from each of them. Simple similarity measures between various datasets can probably help in this regard. Our partially supervised feature selection is a general approach which does not depend, at least in principle, on how the favored dimensions are initially selected. The present work relies on other related datasets while our previous work used real prior knowledge from field experts [26]. A further and natural extension would combine the transferred knowledge which such prior knowledge whenever available. Acknowledgment. Thibault Helleputte is funded by a FRIA grant (1.E091.07). All computations have been run on the FYNU’s INGRID cluster thanks to the Center for Intensive Computation and Mass Storage (CISM) of the University of Louvain.
546
T. Helleputte and P. Dupont
References 1. Ein-Dor, L., Zuk, O., Domany, E.: Thousands of samples are needed to generate a robust gene list for predicting outcome in cancer. PNAS 103(15), 5923–5928 (2006) 2. Edgar, R., Barrett, T.: Ncbi geo standards and services for microarray data. Nature Biotechnology 24, 1471–1472 (2006) 3. Parkinson, H., Kapushesky, M., Kolesnikov, N., Rustici, G., Shojatalab, M., Abeygunawardena, N., Berube, H., Dylag, M., Emam, I., Farne, A., Holloway, E., Lukk, M., Malone, J., Mani, R., Pilicheva, E., Rayner, T.F., Rezwan, F., Sharma, A., Williams, E., Bradley, X.Z., Adamusiak, T., Brandizi, M., Burdett, T., Coulson, R., Krestyaninova, M., Kurnosov, P., Maguire, E., Neogi, S.G., Rocca-Serra, P., Sansone, S.-A., Sklyar, N., Zhao, M., Sarkans, U., Brazma, A.: ArrayExpress update– from an archive of functional genomics experiments to the atlas of gene expression. Nucl. Acids Res. 37(suppl-1), D868–D872 (2009) 4. Silver, D.L., Bennett, K.P.: Guest editor’s introduction: special issue on inductive transfer learning. Machine Learning 73, 215–220 (2008) 5. Pan, S.J., Yang, Q.: A survey on transfer learning. Technical Report HKUST-CS0808, Department of Computer Science and Engineering, Hong Kong University of Science and Technology, Hong Kong, China (November 2008) 6. Chapelle, O., Sch¨ olkopf, B., Zien, A. (eds.): Semi-Supervised Learning. MIT Press, Cambridge (2006) 7. Argyriou, A., Evgeniou, T., Pontil, M.: Multi-task feature learning. In: NIPS, pp. 41–48 (2006) 8. Daum´e III, H., Marcu, D.: Domain adaptation for statistical classifiers. Journal of Artificial Intelligence Research 26, 101–126 (2007) 9. Wang, Z., Song, Y., Zhang, C.: Transferred dimensionality reduction. In: Daelemans, W., Goethals, B., Morik, K. (eds.) ECML PKDD 2008, Part II. LNCS (LNAI), vol. 5212, pp. 550–565. Springer, Heidelberg (2008) 10. Liao, X., Xue, Y., Carin, L.: Logistic regression with an auxiliray data source. In: Proceedings of the 22nd International Conference on Machine Learning, Bonn, Germany, pp. 505–512 (2005) 11. Huang, J., Smola, A., Gretton, A., Borgwardt, K., Sch¨ olkopf, B.: Correcting sample selection bias by unlabeled data. In: Proceedings of the 19th Annual Conference on Neural Information Processing Systems, pp. 601–608. MIT Press, Cambridge (2007) 12. Dai, W., Yang, Q., Xue, G., Yu, Y.: Selft-thaught clustering. In: Proceedings of the 25th International Conference of Machine Learning, pp. 200–207 (2008) 13. Evgeniou, T., Pontil, M.: Regularized multi-task learning. In: Proceedings of the 10th ACM SIGKDD International Conference on Knowledge Discovery and Data Mining, pp. 109–117 (2004) 14. Lawrence, N., Platt, C.: Learning to learn with the informative vector machine. In: Proceedings of the 21st International Conference on Machine Learning, p. 65. ACM, New York (2004) 15. Blitzer, J., McDonald, R., Pereira, F.: Domain adaptation with structural correspondence learning. In: Proceedings of the 2006 Conference on Empirical Methods in Natural Language Processing, Sydney, Australia, July 2006, pp. 120–128. Association for Computational Linguistics (2006) 16. Mierswa, I., Wurst, M.: Efficient case based feature construction. In: Gama, J., Camacho, R., Brazdil, P.B., Jorge, A.M., Torgo, L. (eds.) ECML 2005. LNCS (LNAI), vol. 3720, pp. 641–648. Springer, Heidelberg (2005)
Feature Selection by Transfer Learning
547
17. Guyon, I., Elisseef, A.: An introduction to variable and feature selection. Journal of Machine Learning Research 3, 1157–1182 (2003) 18. Saeys, Y., Inza, I., Larranaga, P.: A review of feature selection techniques in bioinformatics. bioinformatics 23(19), 2507–2517 (2007) 19. Krishnapuram, B., Carin, L., Hartemink, A.: 14: Gene Expression Analysis: Joint Feature Selection and Classifier Design. In: Kernel Methods in Computational Biology, pp. 299–317. MIT Press, Cambridge (2004) 20. Ein-Dor, L., Kela, I., Getz, G., Givol, D., Domany, E.: Outcome signature genes in breast cancer: is there a unique set? Bioinformatics 21 (2005) 21. Mukherjee, S.: 9: Classifying Microarray Data Using Support Vector Machines. In: A Practical Approach to Microarray Data Analysis, pp. 166–185. Springer, Heidelberg (2003) 22. Weston, J., Mukherjee, S., Chapelle, O., Pontil, M., Poggio, T., Vapnik, V.: Feature selection for SVMs. In: Advances in Neural Information Processing Systems, pp. 668–674 (2000) 23. Chapelle, O., Vapnik, V., Bousquet, O., Mukherjee, S.: Choosing multiple parameters for support vector machines. Machine Learning 46, 131–159 (2002) 24. Guyon, I., Weston, J., Barnhill, S., Vapnik, V.: Gene selection for cancer classification using support vector machines. Machine Learning 46(1-3), 389–422 (2002) 25. Weston, J., Elisseef, A., Sch¨ olkopf, B., Tipping, M.: Use of the zero-norm with linear models and kernel methods. Journal of Machine Learning Research 3, 1439– 1461 (2003) 26. Helleputte, T., Dupont, P.: Partially supervised feature selection with regularized linear models. In: Proceedings of the 26th International Conference on Machine Learning (2009) 27. Singh, D., Febbo, P.G., Ross, K., Jackson, D.G., Manola, J., Ladd, C., Tamayo, P., Renshaw, A.A., D’Amico, A.V., Richie, J.P., Lander, E.S., Loda, M., Kantoff, P.W., Golub, T.R., Sellers, W.R.: Gene expression correlates of clinical prostate cancer behavior. Cancer Cell 1(2), 203–209 (2002) 28. Chandran, U., Ma, C., Dhir, R., Bisceglia, M., Lyons-Weiler, M., Liang, W., Michalopoulos, G., Becich, M., Monzon, F.: Gene expression profiles of prostate cancer reveal involvement of multiple molecular pathways in the metastatic process. BMC Cancer 7(1), 64 (2007) 29. Welsh, J.B., Sapinoso, L.M., Su, A.I., Kern, S.G., Wang-Rodriguez, J., Moskaluk, C.A., Frierson Jr., F.H., Hampton, G.M.: Analysis of Gene Expression Identifies Candidate Markers and Pharmacological Targets in Prostate Cancer. Cancer Res 61(16), 5974–5978 (2001) 30. Kuncheva, L.I.: A stability index for feature selection. In: Proceedings of the 25th International Multi-Conference: Artificial Intelligence and Applications, Anaheim, CA, USA, pp. 390–395. ACTA Press (2007) 31. Nadeau, C., Bengio, Y.: Inference for the generalization error. Machine Learning 52, 239–281 (2003)