Features for Image Retrieval: An Experimental Comparison Thomas Deselaers1 , Daniel Keysers2 , and Hermann Ney1 1
Human Language Technology and Pattern Recognition, Computer Science Department, RWTH Aachen University, Germany {deselaers,ney}@cs.rwth-aachen.de 2 Image Understanding and Pattern Recognition, German Research Center for Artificial Intelligence (DFKI), Kaiserslautern, Germany
[email protected] November 29, 2007
Abstract
ple, medical doctors have to access large amounts of images daily [1], home-users often have image databases of thousands of images [2], and journalists also need to search for images by various criteria [3, 4]. In the past, several CBIR systems have been proposed and all these systems have one thing in common: images are represented by numeric values, called features or descriptors, that are meant to represent the properties of the images to allow meaningful retrieval for the user. Only recently have some standard benchmark databases and evaluation campaigns been created which allow for a quantitative comparison of CBIR systems. These benchmarks allow for the comparison of image retrieval systems under different aspects: usability and user interfaces, combination with text retrieval, or overall performance of a system. However, to our knowledge, no quantitative comparison of the building blocks of the systems, the features that are used to compare images, has been presented so far. In [5] a method for comparing image retrieval systems was proposed relying on the Corel database, which has restricted copyrights, is no longer commercially available today, and can therefore not be used for experiments that are meant to be a basis for other comparisons. Another aspect of evaluating CBIR systems are the requirements of the users. In [3] and [4] studies of user needs in searching image archives are presented and the outcome in both studies is that CBIR alone is very unlikely to fulfill the needs but that semantic information obtained from meta data and textual information is an important additional knowledge source. Although today the semantic analysis and understanding of images is much further developed due to the recent achievements in object detection and recognition, still most of the requirements specified are not satisfiable fully automatically. Therefore, in this paper we compare the performance of a large variety of visual descriptors. These can then later be combined with the outcome of textual information retrieval as described e.g. in [6].
An experimental comparison of a large number of different image descriptors for content-based image retrieval is presented. Many of the papers describing new techniques and descriptors for content-based image retrieval describe their newly proposed methods as most appropriate without giving an in-depth comparison with all methods that were proposed earlier. In this paper , we first give an overview of a large variety of features for content-based image retrieval and compare them quantitatively on four different tasks: stock photo retrieval, personal photo collection retrieval, building retrieval, and medical image retrieval. For the experiments, five different, publicly available image databases are used and the retrieval performance of the features is analysed in detail. This allows for a direct comparison of all features considered in this work and furthermore will allow a comparison of newly proposed features to these in the future. Additionally, the correlation of the features is analysed, which opens the way for a simple and intuitive method to find an initial set of suitable features for a new task. The article concludes with recommendations which features perform well for what type of data. Interestingly, the often used, but very simple, colour histogram performs well in the comparison and thus can be recommended as a simple baseline for many applications.
1
Introduction
Image retrieval in general and content-based image retrieval (CBIR) in particular are well-known fields of research in information management in which a large number of methods have been proposed and investigated but in which still no satisfying general solutions exist. The need for adequate solutions is growing due to the increasing amount of digitally produced images in areas like journalism, medicine, and private life, requiring new ways of accessing images. For exam1
• pointing out a set of five databases from four different domains that can be used for benchmarking CBIR systems.
The main question we address in this paper is: Which features are suitable for which task in image retrieval? This question is thoroughly investigated by examining the performance of a wide variety of different visual descriptors for four different types of CBIR tasks. The question of which features perform how well is closely related to the question which features can be combined to obtain good results in a particular task. Although we do not directly address this question here, the results from this paper lead to a new and intuitive method to choose an appropriate combination of features based on the correlation of the individual features. For the evaluation of the features we use five different publicly available databases which are a good starting point to evaluate the performance of new image descriptors. Although today various initiatives for evaluation of CBIR systems have evolved, only few of them resulted in evaluation campaigns with participants and results: Benchathlon 1 was started in 2001 and located at the SPIE Electronic Imaging conference but has become smaller over time. TRECVID 2 is an initiative by the TREC (Text Retrieval Conference) on video retrieval in which video retrieval systems are compared. ImageCLEF 3 is part of the Cross-Language Evaluation Framework (CLEF) and started in 2003 with only one task aiming at a combination of multi-lingual information retrieval with CBIR. In 2004, it comprised three tasks, one of them focused on visual queries and in 2005 and 2006 there were four tasks, one and two of them purely visual, respectively. We can observe that evaluation in the field of CBIR is at a far earlier stage than it is in textual information retrieval (e.g. Text REtrieval Conference, TREC) or in speech recognition (e.g. Hub4-DARPA evaluation). One reason for this is likely to be the smaller commercial impact that (contentbased) image retrieval has had in the past. However, with the increasing amount of visual data available in various form, this is likely to change in the future. The main contributions of this paper are answers to the questions above, namely
Note that we do not focus on the combination of features nor on the use of user feedback for content-based image retrieval in this paper; several other authors propose and evaluate approaches to these important issues [7, 8, 9, 10, 11]. Instead, we mainly investigate the performance of single features for different tasks.
1.1
State of the Art in Content-based Image Retrieval
This section gives an overview on literature on CBIR. We mainly focus on different descriptors and image representations. More general overviews on CBIR are given in [12, 13, 14]. Two recent reviews of CBIR techniques are given in [15, 16]. In CBIR, there are, roughly speaking, two different main approaches: a discrete approach and a continuous approach [17]. (1) The discrete approach is inspired by textual information retrieval and uses techniques like inverted files and text retrieval metrics. This approach requires all features to be mapped to binary features; the presence of a certain image feature is treated like the presence of a word in a text document. (2) The continuous approach is similar to nearest neighbor classification. Each image is represented by a feature vector and these features are compared using various distance measures. The images with lowest distances are ranked highest in the retrieval process. A first, though not exhaustive, comparison of these two models is presented in [17]. Among the first systems that were available were the QBIC system from IBM [18] and the Photobook system from MIT [19]. QBIC uses color histograms, a moment based shape feature, and a texture descriptor. Photobook uses appearance features, texture features, and 2D shape features. Another well known system is Blobworld [20], developed at UC Berkeley. In Blobworld, images are represented by regions that are found in an Expectation-Maximization-like (EM) segmentation process. In these systems, images are retrieved in a nearest-neighbor-like manner, following the continuous approach to CBIR. Other systems following this approach include SIMBA [21], CIRES [22], SIMPLIcity [23], IRMA [24], and our own system FIRE [25, 26]. The Moving Picture Experts Group (MPEG) defines a standard for content-based access to multimedia data in their MPEG-7 standard. In this standard, a set of descriptors for images is defined. A reference implementation for these descriptors is given in the XM Software4 . A system that uses MPEG-7 features in combination with semantic web ontologies is presented in [27].
• an extensive overview of features proposed for CBIR, including features that were proposed in the early days of CBIR and techniques that were proposed only recently in the object recognition and image understanding literature as well as a subset of features from the MPEG7 standard, • a quantitative analysis of the performance of these features for various CBIR tasks (in particular: stock photo retrieval, personal photo retrieval, building/touristic image retrieval, and medical image retrieval) 1 http://www.benchathlon.net/ 2 http://www-nlpir.nist.gov/projects/trecvid/
4 http://www.lis.ei.tum.de/research/bv/topics/mmdb/e mpeg7. html
3 http://www.imageclef.org
2
In [28] a method starting from low-level features and creating a semantic representation of the images is presented and in [29] an approach to consistently fuse the efforts in various fields of multimedia information retrieval is presented.
Overview. The remainder of this paper is structured as follows. The next section describes the retrieval metric used to rank images given a feature and a distance measure and the performance measures used to compare different settings. Section 3 gives an overview of 19 different image descriptors and distance measures which are used for the experiments. Section 4 presents a method to analyse the correlation of different image descriptor/distance combinations. In Section 5, five different benchmark databases are described that are used for the experiments presented in Section 6. The experimental section is subdivided into three parts: Section 6.1 directly compares the performance of the different methods for the different tasks, Section 6.2 describes the results of the correlation analysis, and Section 6.3 analyses the connection between the error rate and the mean average precision. The paper concludes with answers to the questions posed above.
In [30], the VIPER system is presented which follows the discrete approach. VIPER is now publicly available as the GNU Image Finding Tool (GIFT) and several enhancements have been implemented during the last years. An advantage of the discrete approach is that methods from textual information retrieval can easily be transferred as e.g. user interaction and storage handling. Nonetheless, most image retrieval systems follow the continuous approach often using some optimization, for example pre-filtering and preclassification [12, 23, 31], to achieve better runtime performance, e.g. [18, 19, 20, 21]. We can clearly observe that many different image description features have been developed. However, only few works have quantitatively compared different features. Interesting insights can also be gained from the outcomes of the ImageCLEF image retrieval evaluations [32, 33] in which different systems are compared on the same task. The comparison is not easy because all groups use different retrieval systems and text-based information retrieval is an important part of these evaluations. Due to the lack of standard tasks, in many papers on image retrieval, new benchmark sets are defined to allow for quantitative comparison of the proposed methods to a baseline system. A problem with this approach is that it is simple to create a benchmark for which you can show improved results [34].
2
Retrieval Metric
The CBIR framework used to conduct the experiments described here follows the continuous approach: images are represented by vectors that are compared using distance measures. For the experiments we use our CBIR system FIRE5 . FIRE was designed as a research system with extensibility and flexibility in mind. For the evaluation of features, only one feature and one query image is used at a time, as described in the following. Retrieval Metric. Let the database {x1 , . . . xn , . . . , xN } be a set of images represented by features. To retrieve images similar to a query image q, each database image xn is compared with the query image using an appropriate distance function d(q, xn ). Then, the database images are sorted according to the distances such that d(q, xni ) ≤ d(q, xni+1 ) holds for each pair of images xni and xni+1 in the sequence (xn1 . . . , xni , . . . xnN ). If a combination of different features is used, the distances are normalized to be in the same value range and then a linear combination of the distances is used to create the ranking. To evaluate CBIR, several performance evaluation measures have been proposed [46] based on the precision P and the recall R:
Recently, local image descriptors are getting more attention within the computer vision community. The underlying idea is that objects in images consist of parts that can be modelled with varying degrees of independence. These approaches are successfully used for object recognition and detection [35, 36, 37, 38, 39, 40] and CBIR [26, 41, 42, 43]. For the representation of local image parts, SIFT features [44] and raw image patches are commonly used and a bag-offeatures approach, similar to the bag-of-words approach in natural language processing, is commonly taken. The features described in Section 3.7 also follow this approach and are strongly related to the modern approaches in object recognition. In contrast to the methods described above, the image Number of relevant images retrieved is not modelled as a whole but rather image parts are modP = Total number of images retrieved elled individually. Most approaches found in the literature on part-based object recognition learn (often complicated) Number of relevant images retrieved R = models from a large set of training data. This approach is Total number of relevant images impractical for CBIR applications since it would require an Precision and recall values are usually represented in a enormous amount of training data on the one hand and would precision-recall-graph R → P (R) summarizing (R, P (R)) lead to tremendous computing times to create these models on the other hand. However, some of these approaches are 5 freely available under the terms of the GNU General Public applicable for limited domain retrieval, e.g. on the IRMA Licencse at http://www-i6.informatik.rwth-aachen.de/∼deselaers/ database (cf. Section 5.3) [45]. fire.html. 3
3
pairs for varying numbers of retrieved images. The most common way to summarize this graph into one value is the mean average precision that is also used e.g. in the TREC and CLEF evaluations. The average precision AP for a single query q is the mean over the precision scores after each retrieved relevant item: AP (q) =
NR 1 X Pq (Rn ), NR n=1
where Rn is the recall after the nth relevant image was retrieved. NR is the total number of relevant documents for the query. The mean average precision M AP is the mean of the average precision scores over all queries: 1 X M AP = AP (q), |Q| q∈Q
where Q is the set of queries q. An advantage of the mean average precision is that it contains both precision and recall oriented aspects and is sensitive to the entire ranking. We also indicate the classification error rate ER for all experiments. To do so we consider only the most similar image according to the applied distance function. We consider a query image to be classified correctly, if the first retrieved image is relevant. Otherwise the query is misclassified: ( 1 X 0 if the most similar image is relevant/from ER = |Q| 1 otherwise q∈Q This is in particular interesting if the database for retrieval consists of images labelled with classes, which is the case for some of the databases considered in this paper. For databases without defined classes but with selected query images and corresponding relevant images, the classes to be distinguished are “relevant” and “irrelevant” only. This is in accordance with precision at document X being used as an additional performance measure in many information retrieval evaluations. The ER used here is equal to 1 − P (1), where P (1) is the precision after one document retrieved. In [47] it was experimentally shown that the error rate and P (50), the precision after 50 documents, are correlated with a coefficient of 0.96 and thus they essentially describe the same property. The precision oriented evaluation is interesting, because most search engines, both for images and text, return between 10 and 50 results, given a query. Using the ER, the image retrieval system can be viewed as a nearest neighbor classifier using the same features and the same distance function as the image retrieval system. The decision rule of this classifier can be written in the form q → r(q) = arg
min {
min
k=1,...,K n=1,...,Nk
Features for CBIR
In this section we give an overview of the features tested, with the intention to include as many features as possible. Obviously we cannot cover all features that have been proposed in the literature. For example, we have left out the Blobworld features [20] because for comparing images based on these features, user interaction to select the relevant regions in the query image is required. Furthermore, a variety of texture representations have not been included and we have not investigated different color spaces. However, we have tried to make the selection of features as representative and at the state-of-the-art as possible. Roughly speaking, the features can be grouped into the following types: (a) color representation, (b) texture representation, (c) local features, and (d) shape representation6 . The features that are presented in the following are grouped according to these four categories in Table 1. Table 1 also gives the timing information on feature extraction and retrieval time for a database consisting of 10 images7 . The distance function used to compare the features representing an image obviously also has a big influence on the performance of the system. Therefore, we refer to the used distance functions for each feature in the particular sections. We have chosen distance functions that are known to work well for the features used as the discussion of their influence the correctthe class is beyond scope of this paper. Different comparison measures for histograms are presented e.g. in [49, 50] and dissimilarity metrics for direct image comparison are presented in [51].
3.1
Appearance-based Image Features
The most straight-forward approach is to directly use the pixel values of the images as features: the images are scaled to a common size and compared using the Euclidean distance. In this work, we have used a 32 × 32 down-sampled representation of the images and these have been compared using the Euclidean distance. It has been observed that for classifica6 Note that no features that fully cover the shapes in the images are included since therefore an algorithm segmenting the images into meaningful regions is required, but since fully-automatic segmentation for general images is an unsolved problem, it is not covered here. The features that we mark to represent shape only represent shape in a local (for the SIFT features) and very rough global context (for appearancebased image features). There are however, overview papers on the shape features defined in MPEG7 which use databases consisting of segmented images for benchmarks [48]. 7 These experiments have been carried out on a 1.8GHz machine with our standard C++ implementation of the software. The SIFT feature extraction was done with the software from Gyuri Dorko (http:// lear.inrialpes.fr/people/dorko/downloads.html), the MPEG7 experiments were performed with the MPEG7 XM reference implementation (http://www.lis.ei.tum.de/research/bv/topics/mmdb/mpeg7. html), and the downscaling of images was performed using the ImageMagick library (http://www.imagemagick.org/). The timings include the time to load all data and initialize the system.
d(q, xnk )}.
The query image q is predicted to be from the same class as the database image that has the smallest distance to it. Here, xnk denotes the n-th image of class k. 4
Table 1: Grouping of the features into different types. (a) color representation, (b) texture representation, (c) local features, (d) shape representation. The table also gives the time to extract the features from 10 images and to query 10 images in a 10 image database to give an impression of the computational costs of the different features (experiments were performed on a 1.8GHz machine). Feature name Section Appearance-based Image Features 32×32 image 3.1 X×32 image 3.1 Color Histograms 3.2 Tamura Features 3.3 Global Texture Descriptor 3.4 Gabor histogram 3.5 Gabor vector 3.5 Invariant Feature Histograms w. monomial kernel 3.6 w. relational kernel 3.6 LF Patches global search 3.7 histograms 3.7 signatures 3.7 LF SIFT global search 3.7 histograms 3.7 signatures 3.7 MPEG 7: scalable color 3.8.1 MPEG 7: color layout 3.8.2 MPEG 7: edge histogram 3.8.3
comp. measure
type
extr.[s]
retr.[s]
Euclidean IDM JSD JSD Euclidean JSD Euclidean
abcd abcd a b b b b
0.25 0.25 0.77 14.24 3.51 8.01 8.68
0.19 9.72 0.16 0.13 0.16 0.12 0.17
JSD JSD
ab ab
28.93 18.23
0.16 0.14
JSD EMD
ac ac ac
4.69 4.69+5.17 4.69+3.37
7.13 0.27 0.55
JSD EMD MPEG7-internal MPEG7-internal MPEG7-internal
cd cd cd a ad b
11.91 11.91+6.23 11.91+4.50 0.48 0.20 0.16
9.23 0.27 1.03 0.42 0.33 0.43
tion and retrieval of medical radiographs, this method serves as a reasonable baseline [51]. In [51] different methods were proposed to directly compare images accounting for local deformations. The proposed image distortion model (IDM) is shown to be a very effective means of comparing images with reasonable computing time. IDM clearly outperforms the Euclidean distance for optical character recogniton and medical radiographs. The Image Distortion Model is a non-linear deformation model, it was also successfully used to compare general photographs [52] and for sign language and gesture recognition [53]. In this work it is used as a second comparison measure to compare images directly. Therefore the images are scaled to have a common width of 32 pixels while keeping the aspect ratio constant, i.e. the images may be of different heights.
resentation of the relative frequencies of the occurring colors. We use the RGB color space for the histograms. We observed only minor differences with other color spaces which was also observed in [55]. In accordance with [49], we use the Jeffrey divergence or Jensen-Shannon divergence (JSD) to compare histograms:
3.2
In [56] the authors propose six texture features corresponding to human visual perception: coarseness, contrast, directionality, line-likeness, regularity, and roughness. From experiments testing the significance of these features with respect to human perception, it was concluded that the first three features are very important. Thus, in our experiments we use coarseness, contrast, and directionality to create a histogram describing the texture [52] and compare these histograms us-
dJSD (H, H 0 ) =
M X m=1
Hm log
0 2Hm 2Hm 0 + H log , m 0 0 +H Hm + Hm Hm m
where H and H 0 are the histograms to be compared and Hm is the mth bin of H.
3.3
Color Histograms
Color histograms are among the most basic approaches and widely used in image retrieval [12,18,52,49,54]. To show performance improvements in image retrieval systems, systems using only color histograms are often used as a baseline. The color space is partitioned and for each partition the pixels with a color within its range are counted, resulting in a rep5
Tamura Features
ing the Jeffrey divergence [49]. In the QBIC system [18] his- functions we have considered are monomial and relational tograms of these features are used as well. functions [21] over the pixel intensities. Instead of summing over translation and rotation, we only sum over rotation and create a histogram over translation. This histogram is still 3.4 Global Texture Descriptor invariant with respect to rotation and translation. The reIn [52] a texture feature consisting of several parts is de- sulting histograms are compared using the JSD. Previous exscribed: Fractal dimension measures the roughness of a sur- periments have shown that the characteristics of invariant face. The fractal dimension is calculated using the reticular feature histograms and color histograms are very similar and cell counting method [57]. Coarseness characterizes the grain that invariant feature histograms can sometimes outperform size of an image. It is calculated depending on the variance color histograms [26]. of the image. Entropy of pixel values is used as a measure of disorderedness in an image. The spatial gray-level difference statistics describe the brightness relationship of pixels 3.7 Local Image Descriptors within neighborhoods. It is also known as co-occurrence ma- Image patches, i.e. small subimages of images, or features trix analysis [58]. The circular Moran autocorrelation func- derived thereof currently are a very promising approach for tion measures the roughness of the texture. For the calcu- object recognition, e.g. [40, 61, 62]. Obviously, object recoglation a set of autocorrelation functions is used [59]. From nition and CBIR are closely related fields [63, 64] and for these, we obtain a 43 dimensional vector consisting of one some clearly defined retrieval tasks, object recognition methvalue for the fractal dimension, one value for the coarseness, ods might actually be the only possible solution: e.g. lookone value for the entropy and 32 values for the difference ing for all images showing a certain person, clearly a face statistics, and 8 values for the circular Moran autocorrela- detection and recognition system would deliver the best retion function. This descriptor has been successfully used for sults [19, 65]. medical images in [24]. We consider two different types of local image descriptors or local features (LF): a) patches that are extracted from the images at salient points and dimensionality reduced using PCA transformation [40] and b) SIFT descriptors [44] Gabor features have been widely used for Texture analyextracted at Harris interest points [35, chapters 3, 4]. sis [31, 30]. Here we use two different descriptors derived We employ three methods to incorporate local features into from Gabor features: our image retrieval system. The methods are evaluated for • Mean and standard deviation: Gabor features are ex- both types of local features described above: tracted at different scales and directions from the images and the mean and standard deviation of the filter LF histograms. The first method follows [40]: local fearesponses is calculated. We extract Gabor features in tures are extracted from all database images and jointly clusfive different orientations and five different scales lead- tered to form 2048 clusters. Then for each of the local feaing to a 50 dimensional vector. tures all information except the identifier of the most similar cluster center is discarded and for each image a histogram of • A bank of 12 different circularly symmetric Gabor filters the occurring patch-cluster identifiers is created, resulting in is applied to the image, the energy for each filter on the a 2048 dimensional histogram per image. These histograms bank is quantized into 10 bands and a histogram of the are then used as features in the retrieval process and are commean filter outputs over image regions is computed to pared using the Jeffrey divergence. This method was shown give a global measure of the texture characteristics of to produce good performance in object recognition and detecthe image [30]. These histograms are compared using tion tasks [40]. Note that the timing information in Table 1 the JSD. does not give the time to create the cluster model, since this is only done once for a database and can be computed offline.
3.5
Gabor Features
3.6
Invariant Feature Histograms
LF signatures. The second method is derived from the method proposed in [66]. Local features are extracted from each database image and clustered for each image separately to form 32 clusters per image. Then for each image, the parameters of the clusters, i.e. the mean and the variance, are saved and the according cluster-identifier histogram of the extracted features is created. These “local feature signatures” are then used as features in the retrieval process and
A feature is called invariant with respect to certain transformations if it does not change when these transformations are applied to the image. The transformations considered here are translation, rotation, and scaling. In this work, invariant feature histograms as presented in [60] are used. These features are based on the idea of constructing invariant features by integration, i.e. a certain feature function is integrated over the set of all considered transformations. The feature 6
are compared using the Earth Mover’s Distance (EMD) [67]. compactness allows visual signal matching functionality with This method was shown to produce good performance in ob- high retrieval efficiency at very small computational costs. It ject recognition and detection tasks [66]. allows for query-by-sketch queries because the descriptor captures the layout information of color features. This is a clear LF global search. The third method is based on global advantage over other color descriptors. This approach closely patch search and derived from the method presented in [62]. resembles the use of very small thumbnails of the images with Here, local features are extracted from all database images a quantization of the colors used. and stored in a KD tree to allow for efficient nearest neighbor searching. Given a query image, we extract local features 3.8.3 MPEG 7: Edge Histogram from the image in the same way as we did for the database The edge histogram descriptor represents the spatial distribuimages and search for the k nearest neighbors for each of tion of five types of edges, namely four directional edges and the query-patches in the set of database-patches. Then, we one non-directional edge. According to the MPEG-7 stancount how many patches from each of the database image dard, the image retrieval performance can be significantly were found for the query patches and the database images improved if the edge histogram descriptor is combined with with the highest number of patch-hits are returned. Note other descriptors such as the color histogram descriptor. The that the timing information in Table 1 does not include the descriptor is scale invariant and supports rotation invariant time to create the KD tree, since this is only done once for a and rotation sensitive matching operations. database and can be computed offline.
3.8
4
MPEG-7 Features
The Moving Picture Experts Group (MPEG) has defined several visual descriptors in their standard referred to as MPEG7 standard 8 . An overview of these features can be found in [68, 69, 70, 71]. The MPEG initiative focuses strongly on features that are computationally inexpensive to obtain and to compare and also strongly optimizes the features with respect to the required memory for storage. Coordinated by the MPEG, a reference implementation of this standard has been developed9 . This reference implementation was used in our framework for experiments with these features. Unfortunately, the software is not yet in a fully functional state and thus only three MPEG7 features could be used in the experiments. For each of these features, we use the comparison measures proposed by the MPEG standard and implemented in the reference implementation. The feature types are briefly described in the following: 3.8.1
After discussing various features, now let us assume that a set of features is given, some of which account for color, others accounting for texture, and maybe others accounting for shape. A very interesting question then is, how features that can be used in combination can be chosen. Automatic methods for feature selection have e.g. been proposed in [72, 73]. These automatic methods, however do not directly explain why features are chosen, are difficult to manipulate from a user’s perspective, and normally require labelled training data. The method proposed here does not require training data but only analyses the correlations between the features themselves, and instead of automatically selecting a set of features it provides the user with information helping to select an appropriate set of features. To analyze the correlation between different features, we analyze the correlation between the distances d(q, X) obtained for each feature of each of the images X from the database given a query q. For each pair of query image q and database image X we create a vector (d1 (q, X), d2 (q, X), . . . dm (q, X), . . . dM (q, X)) where dm (q, X) is the distance of the query image q to the database image X for the mth feature. Then we calculate the correlation between the dm over all q ∈ {q1 , . . . , ql , . . . qL } and all X ∈ {X1 , . . . , Xn , . . . , XN }. The M × M covariance matrix Σ of the dm is calculated over all N database images and all L query images as:
MPEG 7: Scalable Color Descriptor
The scalable color descriptor is a color histogram in the HSV color space that is encoded by a Haar transform. Its binary representation is scalable in terms of bin numbers and bit representation accuracy over a broad range of data rates. Retrieval accuracy increases with the number of bits used in the representation. We use the default setting of 64 coefficients. 3.8.2
Correlation Analysis of Features for CBIR
MPEG 7: Color Layout Descriptor
This descriptor effectively represents the spatial distribution of the color of visual signals in a very compact form. This
Σij =
8 http://www.chiariglione.org/mpeg/standards/mpeg-7/mpeg-7.
N L 1 XX (di (ql , Xn ) − µi ) · (dj (ql , Xn ) − µj ) (1) N L n=1 l=1
htm 9 http://www.lis.e-technik.tu-muenchen.de/research/bv/
with µi =
topics/mmdb/e mpeg7.html
7
1 NL
PN
n=1
PL
l=1
di (ql , Xn ).
Given the covariance matrix Σ, we calculate the correlation Σ matrix R as Rij = √ ij . The entries of this correlation Σii Σjj
matrix can be interpreted as similarities of different features. A high value Rij means a high similarity between features i and j. This similarity matrix can then be analyzed to find out which features have similar properties and which do not. One way to do this is to visualize it using multi-dimensional scaling [74, p. 84ff]. Multi-dimensional scaling (MDS) seeks a representation of data points in a lower dimensional space while preserving the distances between data points as well as possible. To visualize this data by multi-dimensional scaling, we convert the similarity matrix R into a dissimilarity matrix D by setting Dij = 1 − |Rij |. For visualization purposes, we choose a two-dimensional space for MDS.
5
africa
monuments
buses
food
dinosaurs
elephants
flowers
horses
mountains
Benchmark databases for CBIR
To cover a wide range of different applications in which CBIR is used, we propose benchmark databases from different domains. In the ImageCLEF evaluations large image retrieval benchmark databases have been collected. However, these are not suitable for the comparison of image features as for most of the tasks textual information is supplied and necessary for an appropriate solution of the task. Table 2 gives an overview of the databases used in the evaluations. Although the databases presented here are small in comparison to other CBIR tasks, they represent a wide variety of tasks and allow for a meaningful comparison of feature performances. The WANG database (Section 5.1), as a subset from the Corel stock photo collection, can be considered similar to stock photo searches. The UW database (Section 5.2) and the UCID database (Section 5.5) mainly consist of personal images and represent the home user domain. The ZuBud database (Section 5.4) and the IRMA database (Section 5.3) are limited domain tasks for touristic/building retrieval and medical applications, respectively.
5.1
beach
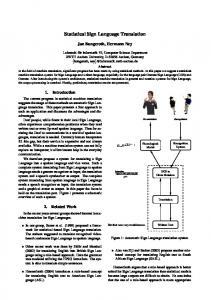
Figure 1: One example image from each of the 10 classes of the WANG database together with their class labels.
5.2
UW database
The database created at the University of Washington consists of a roughly categorized collection of 1,109 images. These images are partly annotated using keywords. The remaining images were annotated by our group to allow the annotation to be used for relevance estimation; our annotations are publicly available10 . The images are of various sizes and mainly include vacation pictures from various locations. There are 18 categories, for example “spring flowers”, “Barcelona”, and “Iran”. Some example images with annotations are shown in Figure 2. The complete annotation consists of 6,383 words with a vocabulary of 352 unique words. On the average, each image has about 6 words of annotation. The maximum number of keywords per image is 22 and the minimum is 1. The database is freely available11 . The relevance assessment for the experiments with this database were performed using the annotation: an image is considered to be relevant w.r.t. a given query image if the two images have a common keyword in the annotation. On the average, 59.3 relevant images correspond to each image. The keywords are rather general; thus for example images showing sky are relevant w.r.t. each other, which makes it quite easy to find relevant images (high precision is likely easy) but it can be extremely difficult to obtain a high recall since some images showing sky might have hardly
WANG database
The WANG database is a subset of 1,000 images of the Corel stock photo database which have been manually selected and which form 10 classes of 100 images each. One example of each class is shown in Figure 1. The WANG database can be considered similar to common stock photo retrieval tasks with several images from each category and a potential user having an image from a particular category and looking for similar images which have e.g. cheaper royalties or which have not been used by other media. The 10 classes are used for relevance estimation: given a query image, it is assumed that the user is searching for images from the same class, and 10 http://www-i6.informatik.rwth-aachen.de/∼deselaers/uwdb/ therefore the remaining 99 images from the same class are index.html 11 http://www.cs.washington.edu/research/imagedatabase/ considered relevant and the images from all other classes are considered irrelevant. groundtruth/ 8
Table 2: Summary of the databases used for the evaluation with database name, number of images in the database, number of query images, average number of relevant images per query, and a description how the queries are evaluated. database images queries avg. rel query mode WANG 1,000 1,000 99.0 leaving-one-out UW 1,109 1,109 59.3 leaving-one-out IRMA 10000 10,000 1,000 520.2 test & database images are disjoint ZuBuD 1,005 105 5.0 test & database images are disjoint UCID 1,338 262 3.5 leaving-one-out
buildings clouds
bench, car, house,
mountain people sand
lantern, trees,
overcast sky,
sky
window
building, post
buildings, fountain,
car, sidewalk, struct,
mosque, tiles, people,
grass, lantern, sky
bushes, flowers,
sky, car
annotation task. For CBIR, the relevances are defined by the classes, given a query image from a certain class, all database images from the same class are considered relevant. Example images along with their class numbers and textual descriptions of the classes are given in Figure 3. This task is a medical image retrieval task and is in practical use at the Department for Diagnostic Radiology of the RWTH Aachen University Hospital. As all images from this database are gray value images, we evaluate neither the color histograms nor the MPEG7 scalable color descriptor since they only account for color information.
trees, bushes,
overcast sky, house,
5.4
ZuBuD database
The “Zurich Buildings Database for Image Based Recognition”(ZuBuD) is a database which has been created by the Swiss Federal Institute of Technology in Zurich and is described in more detail in [75, 76]. The database consists of two parts, a training part of 1,005 images of 201 buildings, 5 of each building and a query part of 115 images. Each of the query images contains one of the buildings from the main part of the database. The pictures partially cloudy sky, Husky Stadium, sailboats, ice, water, of each building are taken from different viewpoints and some hills, trees, grasses, north stands, people, buildings of them are also taken under different weather conditions and ground, houses football, field,... with two different cameras. Given a query image, only images showing exactly the same building are considered relevant. Figure 2: Examples from the UW database with annotation. To give a more precise idea of this database, some example images are shown in Figure 4. This database can be considered as an example for a moany visual similarity with a given query. bile travel guide task, which attempts to identify buildings This task can be considered a personal photo retrieval task, in pictures taken with a mobile phone camera and then obe.g. a user with a collection of personal vacation pictures is tains certain information about the building [75]. The ZuBud looking for images from the same vacation, or showing the database is freely available12 . same type of building. people
5.3
5.5
IRMA-10000 database
UCID database
The UCID database13 was created as a benchmark database for CBIR and image compression applications [77]. In [78] this database was used to measure the performance of a CBIR system using compressed domain features. This database is
The IRMA database consists of 10,000 fully annotated radiographs taken randomly from medical routine at the RWTH Aachen University Hospital. The images are split into 9,000 training and 1,000 test images. The images are subdivided into 57 classes. The IRMA database was used in the ImageCLEF 2005 image retrieval evaluation for the automatic
12 http://www.vision.ee.ethz.ch/ZuBuD 13 http://vision.doc.ntu.ac.uk/datasets/UCID/ucid.html
9
20
21
02 plain radiography coronal facial cranium musculosceletal s.
31
plain radiography coronal lower leg musculosceletal s.
48
49 plain radiography other orientation right breast reproductive s.
plain radiography sagittal handforearm musculosceletal s.
56
50 plain radiography other orientation foot musculosceletal s.
plain radiography coronal knee musculosceletal s.
plain radiography other orientation left breast reproductive s.
57 fluoroscopy coronal upper leg cardiovascular s.
angiography coronal pelvis cardiovascular s.
Figure 3: Example images of the IRMA 10000 database along with their class and annotation similar to the UW database as it consists of vacation images and thus poses a similar task. For 264 images, manual relevance assessments among all database images were created, allowing for performance evaluation. The images that are judged to be relevant are images which are very clearly relevant, e.g. for an image showing a particular person, images showing the same person are searched and for an image showing a football game, images showing football games are considered to be relevant. The used relevance assumption makes the task easy on one hand, because relevant images are very likely quite similar, but on (b) (a) the other hand, it makes the task difficult, because there are likely images in the database which have a high visual simFigure 4: a) A query image and the 5 images from the ilarity but which are not considered relevant. Thus, it can same building in the ZuBuD-database b) 6 images of different be difficult to have high precision results using the given relevance assessment, but since only few images are considered buildings in the ZuBuD-database. relevant, high recall values might be rather easy to obtain. Example images are given in Figure 5.
6
Evaluation of the Features Considered
In this section we report the results of the experimental evaluation of the features. To evaluate all features on the given databases, we extracted the features from the images and executed experiments to test the particular features. For all experiments, we report the mean average precision and the classification error rate. The connection between the classification error rate and mean average precision shows the strong relation between CBIR and classification. Both per-
Figure 5: Example images from the UCID database
10
formance measures have advantages. The error rate is very precision oriented and thus it is best if relevant images are retrieved early. On the contrary, the mean average precision accounts for the average performance over the complete PR graph. Furthermore, we calculated the distance vectors mentioned in Section 4 for each of the queries performed to obtain a global correlation analysis of all features.
6.1
Performance Evaluation of Features
invariant feature histograms with monomial kernel can also directly be observed in Figure 9 where it can be seen that color histograms (point 1) and invariant feature histograms with monomial kernel (point 11) have very similar properties. The second group of features consists of four features: signatures of SIFT features, appearance-based image features, and the MPEG 7 color layout descriptor. Although the image thumbnails compared with the image distortion model perform quite poorly for the WANG, the UW, and the UCID tasks, they perform extremely well for the IRMA task and reasonably well for the ZuBuD task. A major difference between these tasks is that the first three databases contain general color photographs of completely unconstrained scenes, whereas the latter ones contain images from limited domains only. The simpler appearance-based feature of 32×32 thumbnails of the images, compared using Euclidean distance, is the next best feature, and again it can be observed that it performs well for the ZuBuD and IRMA tasks only. As expected, the MPEG7 color layout descriptor and 32×32 image thumbnails obtain similar results because they both encode the spatial distribution of colors or gray values in the images. Among the texture features (Tamura texture histogram, Gabor features, global texture descriptor, relational invariant feature histogram, and MPEG-7 edge histogram), the Tamura texture histogram and the Gabor histogram outperform the others.
The results from the single feature experiments are given in Figures 6 and 7 and in Tables 3 and 4. The results are sorted by the average of the classification error rates. The results from the correlation analysis are given in Figure 9. Note that the features ‘color histogram’ and ‘MPEG7 scalable color’ were not evaluated for the IRMA database because pure color descriptors are not suitable for this gray-scale database. It can clearly be seen that different features perform differently on the databases. Grouping the features by performance results in three groups, one group of five features clearly outperforms the other features (average error rate < 30%, average mean average precision ≈ 50%). A second group has average error rates of approximately 40% (respectively average mean average precision 40%) and a last group performs clearly worse. The top group is led by the color histogram which performs very well for all color tasks and has not been evaluated on the IRMA data. When all databases are considered, the global feature search (cf. Section 3.7) of SIFT features extracted at Harris points [35, chapters 3, 4] performs best on the average. This good performance is probably partly due to the big success on the ZuBuD database, where features of similar type were observed to perform exceedingly well [79]. They also perform well on the UCID database, where relevant images, in contrast to the UW task, are very close neighbours. The possible high dissimilarity between relevant images in the UW database, thus explains the bad performance there. However, the patch histograms outperform the SIFT features on all other tasks as they include color information which obviously is very important for most of the tasks. They also obtain a good performance for the IRMA data. It can be observed that the error rates for the UCID database are very high in comparison to the other databases, so the UCID task can be considered to be harder than e.g. the UW task. A similar result to the one obtained using color histogram is obtained by the invariant feature histogram with monomial kernel. This is not surprising, as it is very similar to a color histogram, except that it also partly accounts for local texture. It can be observed that the performance for the color databases is nearly identical to the color histogram. The relatively bad ranking of these features in the tables is due to the bad performance on the IRMA task. Leaving out the IRMA task for this feature, it would be ranked second in the entire ranking. The high similarity of color histograms and
6.2
Correlation Analysis of Features
11
Figure 8 shows the average correlation of different features over all databases. The darker a field in this image is, the lower the correlation between the corresponding features, bright fields denote high correlations. Figure 9 shows the visualizations of the outcomes of multi-dimensional scaling of the correlation analysis. We applied the correlation analysis for the different tasks individually (4 top plots) and for all tasks jointly (bottom plot). Multi-dimensional scaling was used to translate the similarities of the different features into distances in a two-dimensional space. The further away two points are in the graph, the less similar the corresponding features are for CBIR, and conversely the closer together they appear, the higher the similarity between these features. For each of these plots the according distance vectors obtained from all queries with all database images have been used (WANG database: 1,000,000 distance vectors, UW&UCID database: 194,482+350,557 distance vectors, IRMA database: 9,000,000 distance vectors, ZuBuD database: 115,575 distance vectors, all databases: 10,660,614 distance vectors). The figures show a very strong correlation between color histograms (point 1) and invariant feature histograms with monomial kernel (point 11). In fact, they lead to hardly any
Table 3: Error rate [%] for each of the features for each of the databases (sorted by average error rate over the databases). feature color histogram LF SIFT global search LF patches histogram LF SIFT histogram inv. feature histogram (monomial) MPEG7: scalable color LF patches signature Gabor histogram 32x32 image MPEG7: color layout Xx32 image Tamura texture histogram LF SIFT signature gray value histogram LF patches global MPEG7: edge histogram inv. feature histogram (relational) Gabor vector global texture feature
80
wang 16.9 37.2 17.9 25.6 19.2 25.1 24.3 30.5 47.2 35.4 55.9 28.4 35.1 45.3 42.9 32.8 38.3 65.5 51.4
uw 12.3 31.5 14.6 21.4 12.9 13.0 17.6 20.5 26.4 21.2 26.7 16.8 20.9 23.0 42.7 22.9 23.6 37.9 32.4
irma – 27.7 24.9 30.8 55.8 – 42.7 44.9 22.8 47.7 21.4 33.0 99.3 42.6 48.2 99.3 39.2 42.5 67.7
ucid 51.5 31.7 58.0 50.4 53.8 60.7 68.7 74.1 82.8 75.2 83.2 63.4 58.4 86.6 63.4 69.9 83.2 95.8 95.4
zubud 7.8 7.0 24.4 18.3 7.8 32.2 36.5 24.4 27.0 27.0 20.9 84.4 20.0 47.0 47.8 23.5 93.9 73.0 98.3
average 22.1 27.0 28.0 29.3 29.9 32.7 38.0 38.9 41.2 41.3 41.6 45.2 46.7 48.9 49.0 49.7 55.6 62.9 69.0
wang uw irma ucid zubud
60
40
20
global texture feature
Gabor vector
inv. feature histogram (relational)
MPEG7: edge histogram
LF patches global
gray value histogram
LF SIFT signature
Tamura texture histogram
Xx32 image
MPEG7: color layout
32x32 image
Gabor histogram
LF patches signature
MPEG7: scalable color
inv. feature histogram (monomial)
LF SIFT histogram
LF patches histogram
LF SIFT global search
color histogram
0
Figure 6: Classification error rate [%] for each of the features for each of the databases (sorted by average error rate over the databases). The different shades of gray denote different databases and the blocks of bars denote different features.
12
Table 4: Mean average precision [%] for each of the features for each of the databases (sorted in the same order as Table 3 to allow for easy comparison). feature color histogram LF SIFT global search LF patches histogram LF SIFT histogram inv. feature histogram (monomial) MPEG7: scalable color LF patches signature Gabor histogram 32x32 image MPEG7: color layout Xx32 image Tamura texture histogram LF SIFT signature gray value histogram LF patches global MPEG7: edge histogram inv. feature histogram (relational) Gabor vector global texture feature
wang 50.5 38.3 48.3 48.2 47.6 46.7 40.4 41.3 37.6 41.8 24.3 38.2 36.7 31.7 30.5 40.8 34.9 23.7 26.3
uw 63.0 63.6 62.0 62.3 62.6 63.9 59.9 59.7 60.1 61.0 57.0 60.8 61.2 59.4 55.7 61.4 59.7 56.3 56.5
irma – 20.9 31.4 32.7 24.4 – 23.0 25.2 40.9 29.8 35.0 30.4 10.9 26.1 17.6 10.9 24.1 27.7 16.4
ucid 43.3 62.5 37.5 44.7 41.6 37.9 27.6 22.3 14.0 21.7 13.9 33.2 34.1 11.8 30.3 25.2 14.4 4.7 6.7
zubud 75.6 81.3 64.7 68.0 71.0 54.3 42.6 48.7 41.9 47.7 47.0 15.8 62.7 36.5 38.5 46.3 6.3 15.9 2.6
average 58.1 53.3 48.8 51.2 49.5 50.7 38.7 39.4 38.9 40.4 35.4 35.7 41.1 33.1 34.5 36.9 27.9 25.7 21.7
wang uw irma ucid zubud
80 70 60 50 40 30 20 10
global texture feature
Gabor vector
inv. feature histogram (relational)
MPEG7: edge histogram
LF patches global
gray value histogram
LF SIFT signature
Tamura texture histogram
Xx32 image
MPEG7: color layout
32x32 image
Gabor histogram
LF patches signature
MPEG7: scalable color
inv. feature histogram (monomial)
LF SIFT histogram
LF patches histogram
LF SIFT global search
color histogram
0
Figure 7: Mean average precision for each of the features for each of the databases (sorted in the same order as Fig.6 to allow for easy comparison).
13
differences in the experiments. For the databases consisting of color photographs they outperform most other features. A high similarity is also observed between the patch signatures (point 14) and the MPEG7 color layout (point 2) for all tasks. Two other features that are highly correlated are the two methods that use local feature search for the two different types of local features (points 5 and 12). The different comparison methods for local feature histograms/signature have similar performances (3, 4 and 13, 14, respectively). Another strong correlation can be observed between 32×32 image thumbnails (point 18) and the MPEG7 color layout representation (point 2), which was to be expected as both of these have a rough representation of the spatial distribution of colors (resp. gray values) of the images. Interestingly, the correlation between 32×32 images compared using Euclidean distance (point 18) and the X × 32 images compared using the image distortion model (point 19) is low, with only some similarity for the IRMA and the ZuBuD task. This is partly due to the exceedingly good performance of the image distortion model for the IRMA task and partly due to the missing invariance with respect to slight deformations in the images for the Euclidean distance. For example in the ZuBuD task, the image distortion model can partly compensate for the changes in the viewpoints which leads to a much better performance. Another interesting aspect is that the various texture features (MPEG7 edge histogram (6), global texture feature (10), Gabor features (8, 7), relational invariant feature histogram (15), and Tamura texture histogram (17)) are not correlated strongly. We conclude that none of the texture features is sufficient to completely describe the textural properties of an image. The Tamura texture histogram and the Gabor histogram outperform the other texture features, Tamura features being better in three and Gabor histograms being clearly better in two of the five tasks, both of them are a good choice for texture representation. To give a little insight into how these plots can be used to select sets of features for a given task, we discuss how features for the WANG database could be chosen in the following paragraph. Combined features are linearly combined as described in Section 2. Here, all features are weighted equally, but some improvement of the retrieval results can be achieved by choosing different weights for the individual features. In [80] we present an approach to automatically learning a feature combination from a set of queries with known relevant images using a discriminative maximum entropy model. Finding a suitable set of features. Assume we are about to create a CBIR system for a new database consisting of general photographs. We extract features from the data and create the according MDS plot (Figure 9, top left). Since we know that we are dealing with general photographs, we start 14
with a simple color histogram (point 1). The plot now tells us that invariant feature histograms with monomial kernel (11) would not give us much additional information. Next, we consider the various texture descriptors (points 6, 10, 15, 17, 7, 8) and choose one of these, say global texture features (10) and maybe another: Tamura texture histograms (17). Now we have covered color and texture and can consider a global descriptor such as the image thumbnails (18) or a local descriptor such as one of (12, 13, or 14) or (3, 4, or 5). After adding a feature, the performance of the CBIR system can be evaluated by the user. In Table 5 we quantitatively show the influence of adding these features for the WANG database. It can be seen that the performance is incrementally improved by adding more and more features.
6.3
Connection Between Mean Average Precision and Error Rate
In Figures 10 and 11 the correlation between mean average precision and error rate is visualized database-wise and feature-wise, respectively. The correlation of error rate and mean average precision over all experiments presented in this paper is 0.87. In the keys of the figures, the correlations per database and per feature are given, respectively. From Figure 10 it can be seen that this correlation varies between the tasks between 0.99 and 0.67. For the UCID task, this correlation is markedly strong with 0.99. The correlation is lowest for the UW task which has a correlation of 0.67 and which is the only task with a correlation below 0.8. In Figure 11, the same correlation is analyzed feature-wise. Here, the correlation values vary strongly between 0.4 and 1.0. The LF SIFT signature descriptor has the lowest correlation and the LF patches histogram descriptor also has a low correlation of only 0.6. The two different image thumbnail descriptors have a correlation of 0.7. All other features have correlation values greater than 0.8, thus it can be said that an image representation that works well for classification will generally work well for CBIR as well and vice versa. Exemplarily, this effect can be observed when looking at the results for the WANG and IRMA database for the color histograms and the X ×32 thumbnails. On the one hand, for the WANG database, the color histograms perform very well for error rate and mean average precision; in contrast, the image
Table 5: Combining features using the results from the correlation analysis described for the WANG database. features color histograms + global texture + Tamura histograms + thumbnails + patch histograms
ER [%] 16.9 15.7 13.7 13.7 11.6
MAP [%] 50.5 49.5 51.2 53.9 55.7
color histogram MPEG7: color layout LF SIFT histogram LF SIFT signature LF SIFT global search MPEG7: edge histogram Gabor vector Gabor histogram gray value histogram global texture feature inv. feature histogram (monomial) LF patches global LF patches histogram LF patches signature inv. feature histogram (relational) MPEG7: scalable color Tamura texture histogram 32x32 image Xx32 image color histogram MPEG7: color layout LF SIFT histogram LF SIFT signature LF SIFT global search MPEG7: edge histogram Gabor vector Gabor histogram gray value histogram global texture feature inv. feature histogram (monomial) LF patches global LF patches histogram LF patches signature inv. feature histogram (relational) MPEG7: scalable color Tamura texture histogram 32x32 image Xx32 image
Figure 8: Correlation of the different features. Bright fields denote high and dark fields denote low correlation. Another representation of this information is given in Figure 9 thumbnails perform poorly. On the other hand, the effect is reversed for the IRMA database: here, the color histograms perform poorly and the image thumbnails outstandingly well. It can be observed that the performance increase (resp. decrease) is in the same magnitude for mean average precision and error rate. Thus, it can be seen that a feature that performs well for the task of classification on a certain dataset, it will most probably be a good choice for retrieval of images from that dataset, too.
7
Conclusion
We have discussed a large variety of features for image retrieval and a setup of five freely available databases that can be used to quantitatively compare these features. From the experiments conducted it can be deduced, which features perform well on which kind of task and which do not. In contrast to other papers, we consider tasks from different domains jointly and directly compare and analyze which features are suitable for which task. 15
Which features are suitable for which task in CBIR? The main question addressed in this paper, which features are suitable for which task in image retrieval, has been thoroughly investigated: One clear finding is that color histograms, often cited as a baseline in CBIR, clearly are a reasonably good baseline for general color photographs. However, approaches using local image descriptors outperform color histograms in various tasks but usually at the cost of much higher computational costs. If the images are from a restricted domain, as they are in the IRMA and in the ZuBuD task, other methods should be considered as a baseline, e.g. a simple nearest neighbor classifier using thumbnails of the images. Furthermore, it has been shown that, despite more than 30 years in research on texture descriptors, still none of the texture features presented can convey a complete description of the texture properties of an image. Therefore a combination of different texture features will usually lead to best results. It should be noted that for specialized tasks, such as finding images that show certain objects, better methods exist today that can learn models of particular objects from a set of training data. However, these approaches are computationally far
more expensive and always require relatively large amounts of training data. Although the selection of features tested was not completely exhaustive, the selection was wide and the methods presented can easily be applied to other features to compare them to the features presented here. On one hand, the presented descriptors were selected such that features presented many years ago, such as color histograms [54], Tamura texture features [56], Gabor features, and spatial autocorrelation features [58], as well as very recent features such as SIFT descriptors [44] and patches [40] were compared. On the other hand, the features were selected such that descriptors accounting for color, texture, and (partly) shape, as well as local and global descriptors were covered. We also included a subset of the standardized MPEG7 features. All features have been thoroughly examined experimentally on a set of five databases. All of these databases are freely available and pointers to their location are given in this paper. This allows researchers to compare the findings from this work with other features that were not covered here or which will be presented in future. The databases chosen are representative for four different tasks in which CBIR plays an important role.
domain much research has been done to classify whether an image shows a pathological case or not, likely some of the knowledge obtained in these studies can be transfered to the CBIR domain to help retrieving images from a picture archiving system. Future Work. Future work in CBIR certainly includes finding new and better image descriptors and methods to combine these appropriately. Furthermore, the achievements in object detection and recognition will certainly find their way into the CBIR domain and a shift towards methods that automatically learn about the semantics of images is imaginable. First steps into this direction can be seen in [83] where a method is presented that learns how to compare never seen objects and presents an image similarity measurement which works on the object level. Methods for automatic image annotation are also related to CBIR and the automatic generation of textual labels for images allows to use textual information retrieval techniques to retrieve images.
Acknowledgement
This work was partially funded by the DFG (Deutsche Forschungsgemeinschaft) under contract NE-572/6. The auWhich features are correlated and how can features thors would like to thank Gyuri Dork´o (formerly with INbe combined? We conducted a correlation analysis of the RIA Rhˆone-Alpes) for providing his SIFT feature extraction features considered showing which features have similar prop- software and the authors of the MPEG7 XM reference impleerties and which do not. The outcomes of this method can mentation. be used as an intuitive help to finding suitable combinations of features for certain tasks. In contrast to other methods for feature combination, the method presented here does not rely on training data/relevance judgements to find a suitable set of features. In particular, it will tell you which features are not worth combining because they produce correlated distance results. The method is not a fully automatic feature selection method but the process of selecting features is demonstrated for one of the tasks with promising results. However, the focus of this paper is not to combine several features as this would exceed the scope and a variety of known methods have covered this aspect, e.g. [7, 81, 82]. Another conclusion we have drawn from this work is that the intuitive assumption that classification of images and CBIR are strongly connected is justified. Both tasks are strongly related to the concept of similarity which can be measured best if suitable features are available. In this paper, we have evaluated this assumption quantitatively by considering four different domains and analyzing the classification error rate for classification and the mean average precision for CBIR. It was clearly shown empirically that features that perform well for classification also perform well for CBIR and vice versa. This strong connection allows us to take advantage of knowledge obtained in either classification or CBIR for the other respective task. For example, in the medical 16
References
on Knowledge Discovery and Data Mining (Workshop on Multimedia Data Mining MDM/KDD2000). Boston, MA, USA; 2000. .
[1] M¨ uller H, Michoux N, Bandon D, Geissbuhler A. A review of content-based image retrieval systems in medical applications – clinical benefits and future directions. In- [11] MacArthur S D, Brodley C E, Shyu C-R. Relevance Feedback Decision Trees in Content-based Image Reternational Journal of Medical Informatics 2004;(73):1– trieval. In: Content-based Access of Image and Video 23. Libraries. Hilton Head Island, SC, USA: IEEE; 2000. p. [2] Sun Y, Zhang H, Zhang L, Li M. MyPhotos A System 68–72. for Home Photo Management and Processing. In: ACM Multimedia Confernce. Juan-les-Pins, France; 2002. p. [12] Smeulders A W M, Worring M, Santini S, Gupta A, Jain R. Content-Based Image Retrieval at the End of the 81–82. Early Years. IEEE Transactions on Pattern Analysis [3] Markkula M, Sormunen E. Searching for Photos - Jourand Machine Intelligence 2000;22(12):1349–1380. nalists’ Practices in Pictorial IR. In: Electronic Workshops in Computing – Challenge of Image Retrieval. [13] Forsyth D A, Ponce J. Computer Vision: A Modern Approach. Prentice Hall; 2002. p. 599–619. Newcastle, UK; 1998. p. 1–13. [14] Rui Y, Huang T, Chang S. Image Retrieval: Current Techniques, Promising Directions and Open Issues. Journal of Visual Communication and Image Representation 1999;10(4):39–62.
[4] Armitage L H, Enser P G. Analysis of user need in image archives. Journal of Information Science 1997;23(4):287– 299.
[5] Shirahatti N V, Barnard K. Evaluating Image Retrieval. In: IEEE Conference on Computer Vision and Pattern [15] Datta R, Li J, Wang J Z. Content-based Image Retrieval – Approaches and Trends of the New Age. In: ACM Intl. Recognition (CVPR 05). vol. 1. San Diego, CA, USA: Workshop on Multimedia Information Retrieval, ACM IEEE; 2005. p. 955–961. Multimedia. Singapore; 2005. . [6] Deselaers T, Weyand T, Keysers D, Macherey W, Ney [16] Lew M S, Sebe N, Djeraba C, Jain R. Content-based H. FIRE in ImageCLEF 2005: Combining ContentMultimedia Information Retrieval: State of the Art and based Image Retrieval with Textual Information ReChallenges. ACM Transactions on Multimedia Computtrieval. In: Accessing Multilingual Information Reposiing, Communications and Applications 2006;2(1):1–19. tories, 6th Workshop of the Cross-Language Evaluation Forum, CLEF 2005. vol. 4022 of Lecture Notes in Com- [17] de Vries A P, Westerveld T. A comparison of continuous puter Science. Vienna, Austria; 2006. p. 652–661. vs. discrete image models for probabilistic image and video retrieval. In: Proc. International Conference on [7] Yavlinski A, Pickering M J, Heesch D, R¨ uger S. A comImage Processing. Singapore; 2004. p. 2387–2390. parative Study of Evidence Combination Strategies. In: IEEE International Conference on Acoustics, Speech, [18] Faloutsos C, Barber R, Flickner M, Hafner J, Niblack and Signal Processing (ICASSP 2004). vol. 3. Montreal, W, Petkovic D, et al. Efficient and Effective Querying Canada; 2004. p. 1040–1043. by Image Content. Journal of Intelligent Information Systems 1994;3(3/4):231–262. [8] Heesch D, R¨ uger S. Performance boosting with three mouse clicks - Relevance feedback for CBIR. In: Eu- [19] Pentland A, Picard R, Sclaroff S. Photobook: Contentropean Conference on Information Retrieval Research. Based Manipulation of Image Databases. International No. 2633 in LNCS. Pisa, Italy: Springer Verlag; 2003. p. Journal of Computer Vision 1996;18(3):233–254. 363–376. [20] Carson C, Belongie S, Greenspan H, Malik J. Blobworld: [9] M¨ uller H, M¨ uller W, Marchand-Maillet S, Squire D M. Image Segmentation Using Expectation-Maximization Strategies for positive and negative Relevance Feedback and its Application to Image Querying. IEEE Transin Image Retrieval. In: International Conference on Patactions on Pattern Analysis and Machine Intelligence tern Recognition. vol. 1 of Computer Vision and Image 2002;24(8):1026–1038. Analysis. Barcelona, Spain; 2000. p. 1043–1046. [21] Siggelkow S, Schael M, Burkhardt H. SIMBA — Search [10] M¨ uller H, M¨ uller W, Squire D M, Marchand-Maillet S, IMages By Appearance. In: DAGM 2001, Pattern Pun T. Learning features weights from user behavior Recognition, 23rd DAGM Symposium. vol. 2191 of Lecin Content-Based Image Retrieval. In: Simoff S, Zature Notes in Computer Science. Munich, Germany: iane O, editors. ACM SIGKDD International Conference Springer Verlag; 2001. p. 9–17. 17
[22] Iqbal Q, Aggarwal J. CIRES: A System for ContentBased Retrieval in Digital Image Libraries. In: International Conference on Control, Automation, Robotics and Vision. Singapore; 2002. p. 205–210.
[32] Clough P, M¨ uller H, Sanderson M. The CLEF Cross Language Image Retrieval Track (ImageCLEF) 2004. In: Fifth Workshop of the Cross–Language Evaluation Forum (CLEF 2004). vol. 3491 of LNCS; 2005. p. 597–613.
[23] Wang J Z, Li J, Wiederhold G. SIMPLIcity: Semantics- [33] Clough P, Mueller H, Deselaers T, Grubinger M, Sensitive Integrated Matching for Picture LIbraries. Lehmann T, Jensen J, et al. The CLEF 2005 CrossIEEE Transactions on Pattern Analysis and Machine InLanguage Image Retrieval Track. In: Accessing Multitelligence 2001;23(9):947–963. lingual Information Repositories, 6th Workshop of the Cross-Language Evaluation Forum, CLEF 2005. vol. [24] Lehmann T M, G¨ uld M-O, Deselaers T, Keysers D, Schu4022 of Lecture Notes in Computer Science. Vienna, bert H, Spitzer K, et al. Automatic Categorization of Austria; 2006. p. 535–557. Medical Images for Content-based Retrieval and Data Mining. Computerized Medical Imaging and Graphics [34] M¨ uller H, Marchand-Maillet S, Pun T. The Truth About 2005;29(2):143–155. Corel - Evaluation in Image Retrieval. In: Proceedings of The Challenge of Image and Video Retrieval [25] Deselaers T, Keysers D, Ney H. FIRE – Flexible Im(CIVR2002). vol. 2383 of LNCS. London, UK; 2002. p. age Retrieval Engine: ImageCLEF 2004 Evaluation. In: 38–49. Multilingual Information Access for Text, Speech and Images – Fifth Workshop of the Cross-Language Eval- [35] Dork´o G. Selection of Discriminative Regions and Louation Forum, CLEF 2004. vol. 3491 of Lecture Notes cal Descriptors for Generic Object Class Recognition. in Computer Science. Bath, UK: Springer; 2005. p. 688– Ph.D. thesis. Institut National Polytechnique de Greno698. ble; 2006. [26] Deselaers T, Keysers D, Ney H. Features for Image Re- [36] Fei-Fei L, Perona P. A Bayesian Hierarchical Model trieval – A Quantitative Comparison. In: DAGM 2004, for Learning Natural Scene Categories. In: IEEE ConPattern Recognition, 26th DAGM Symposium. vol. 3175 ference on Computer Vision and Pattern Recognition. of Lecture Notes in Computer Science. T¨ ubingen, Gervol. 2. San Diego, CA, USA: IEEE; 2005. p. 524–531. many; 2004. p. 228–236. [37] Fergus R, Perona P, Zissermann A. Object Class [27] Bloehdorn S, Petridis K, Saathoff C, Simou N, TzouRecognition by Unsupervised Scale-Invariant Learning. varas V, Avrithis Y, et al. Semantic Annotation of In: IEEE Conference on Computer Vision and Pattern Images and Videos for Multimedia Analysis. In: EuRecognition (CVPR 03). Blacksburg, VG; 2003. p. 264– ropoean Semantic Web Conference (ESWC 05). Herak271. lian, Greece; 2005. . [38] Opelt A, Pinz A, Fussenegger M, Auer P. Generic Object [28] Di Sciascio E, Donini F M, Mongiello M. Structured Recognition with Boosting 2006;28(3):416–431. Knowledge Representation for Image Retrieval. Journal [39] Mar´ee R, Geurts P, Piater J, Wehenkel L. Random Subof Artificial Intelligence Research 2002;16:209–257. windows for Robust Image Classification. In: IEEE Con[29] Meghini C, Sebastiani F, Straccia U. A Model of Mulference on Computer Vision and Pattern Recognition; timedia Information Retrieval. Journal of the ACM 2005. p. 34–40. 2001;48(5):909–970. [40] Deselaers T, Keysers D, Ney H. Discriminative Training [30] Squire D M, M¨ uller W, M¨ uller H, Raki J. Contentfor Object Recognition using Image Patches. In: IEEE Based Query of Image Databases, Inspirations from Text Conference on Computer Vision and Pattern RecogniRetrieval: Inverted Files, Frequency-Based Weights and tion (CVPR 05). vol. 2. San Diego, CA; 2005. p. 157– Relevance Feedback. In: Scandinavian Conference on 162. Image Analysis. Kangerlussuaq, Greenland; 1999. p. [41] Jain S. Fast Image Retrieval Using Local Features: Im143–149. proving Approximate Search Employing Seed-Grow Ap[31] Park M, Jin J S, Wilson L S. Fast Content-Based Improach. Master’s thesis. INPG, Grenoble; 2004. age Retrieval Using Quasi-Gabor Filter and Reduction of Image Feature. In: Southwest Symposium on Im- [42] Schmid C, Mohr R. Local Grayvalue Invariants for Image Analysis and Interpretation. Santa Fe, NM; 2002. p. age Retrieval. IEEE Transactions on Pattern Analysis & Machine Intelligence 1997;19(5):530–534. 178–182. 18
[43] van Gool L, Tuytelaars T, Turina A. Local Features for Image Retrieval. In: Veltkamp R C, Burkhardt H, Kriegel H-P, editors. State-of-the-Art in Content-Based Image and Video Retrieval. Kluwer Academic Publish[54] ers; 2001. p. 21–41.
DAGM 2005, Pattern Recognition, 26th DAGM Symposium. vol. 3663 of Lecture Notes in Computer Science. Vienna, Austria; 2005. p. 401–408. Swain M J, Ballard D H. Color Indexing. International Journal of Computer Vision 1991;7(1):11–32.
[44] Lowe D G. Distinctive image features from scale- [55] Smith J R, Chang S-F. Tools and Techniques for Color invariant keypoints. International Journal of Computer Image Retrieval. In: SPIE Storage and Retrieval for Vision 2004;60(2):91–110. Image and Video Databases. vol. 2670; 1996. p. 426–437. [45] Deselaers T, Hegerath A, Keysers D, Ney H. Sparse [56] Tamura H, Mori S, Yamawaki T. Textural Features CorPatch-Histograms for Object Classification in Cluttered responding to Visual Perception. IEEE Transaction on Images. In: DAGM 2006, Pattern Recognition, 27th Systems, Man, and Cybernetics 1978;8(6):460–472. DAGM Symposium. vol. 4174 of Lecture Notes in Com[57] Haber¨acker P. Praxis der Digitalen Bildverarbeitung puter Science. Berlin, Germany; 2006. p. 202–211. und Mustererkennung. M¨ unchen, Wien: Carl Hanser Verlag; 1995. [46] M¨ uller H, M¨ uller W, Squire D M, Marchand-Maillet S, Pun T. Performance Evaluation in Content-Based Im[58] Haralick R M, Shanmugam B, Dinstein I. Texture Feaage Retrieval: Overview and Proposals. Pattern Recogtures for Image Classification. IEEE Transactions on nition Letters (Special Issue on Image and Video IndexSystems, Man, and Cybernetics 1973;3(6):610–621. ing) 2001;22(5):593–601. H. Bunke and X. Jiang Eds. [59] Gu Z Q, Duncan C N, Renshaw E, Mugglestone M A, [47] Deselaers T, Keysers D, Ney H. Classification Error Rate Cowan C F N, Grant P M. Comparison of Techniques for for Quantitative Evaluation of Content-based Image ReMeasuring Cloud Texture in Remotely Sensed Satellite trieval Systems. In: International Conference on Pattern Meteorological Image Data. Radar and Signal ProcessRecognition 2004 (ICPR 2004). vol. 2. Cambridge, UK; ing 1989;136(5):236–248. 2004. p. 505–508. [60] Siggelkow S. Feature Histograms for Content-Based Im[48] Bober M. MPEG-7 Visual Shape Descriptors. IEEE age Retrieval. Ph.D. thesis. University of Freiburg, InTrans on Circuits and Systems for Video Technology stitute for Computer Science. Freiburg, Germany; 2002. 2001;11(6):716–719. [61] Fergus R, Perona P, Zisserman A. A Sparse Object Category Model for Efficient Learning and Exhaustive [49] Puzicha J, Rubner Y, Tomasi C, Buhmann J. Empirical Recognition. In: IEEE Conference on Computer Vision Evaluation of Dissimilarity Measures for Color and Texand Pattern Recognition (CVPR 05). vol. 2. San Diego, ture. In: International Conference on Computer Vision. CA, USA: IEEE; 2005. p. 380–389. vol. 2. Corfu, Greece; 1999. p. 1165–1173. [50] N¨ olle M. Distribution Distance Measures Applied to 3-D [62] Paredes R, Perez-Cortes J, Juan A, Vidal E. Local Representations and a Direct Voting Scheme for Face RecogObject Recognition – A Case Study. In: DAGM 2003, nition. In: Workshop on Pattern Recognition in InforPattern Recognition, 25th DAGM Symposium. vol. 2781 mation Systems. Set´ ubal, Portugal; 2001. p. 71–79. of Lecture Notes in Computer Science. Magdeburg, Germany: Springer Verlag; 2003. p. 84–91. [63] Vailaya A, Figueiredo M A T, Jain A K, Zhang H-J. Image Classification for Content-Based Indexing. IEEE [51] Keysers D, Deselaers T, Gollan C, Ney H. DeforTransactions on Image Processing 2001;10(1):117–130. mation Models for Image Recognition. IEEE Transactions on Pattern Analysis and Machine Intelligence [64] Antani S, Kasturi R, Jain R. A survey on the use of 2007;29(8):1422–1435. pattern recognition methods for abstraction, indexing and retrieval of images and video. Pattern Recognition [52] Deselaers T. Features for Image Retrieval. Master’s the2002;35:945–965. sis. Human Language Technology and Pattern Recognition Group, RWTH Aachen University. Aachen, Ger- [65] Deselaers T, Rybach D, Dreuw P, Keysers D, Ney H. Face-based Image Retrieval One Step Toward Objectmany; 2003. based Image Retrieval. In: M¨ uller H, Hanbury A, edi[53] Zahedi M, Keysers D, Deselaers T, Ney H. Combinators. MUSCLE / ImageCLEF Workshop on Image and tion of Tangent Distance and an Image Distortion Model Video Retrieval Evaluation. Vienna, Austria; 2005. p. for Appearance-Based Sign Language Recognition. In: 25–32. 19
[66] Mikolajczyk K, Tuytelaars T, Schmid C, Zisserman A, [78] Schaefer G. CVPIC Colour/Shape Histograms for ComMatas J, Schaffalitzky F, et al. A comparison of affine pressed Domain Image Retrieval. In: DAGM 2004. vol. region detectors. International Journal of Computer Vi3175 of LNCS. T¨ ubingen, Germany; 2004. p. 424–431. sion 2005;65(1/2). [79] Obdrzalek S, Matas J. Image Retrieval Using Local Compact DCT-Based Representation. In: DAGM 2003, [67] Rubner Y, Tomasi C, Guibas L J. A Metric for DisPattern Recognition, 25th DAGM Symposium. vol. 2781 tributions with Applications to Image Databases. In: of Lecture Notes in Computer Science. Magdeburg, GerInternational Conference on Computer Vision. Bombay, many: Springer Verlag; 2003. p. 490–497. India; 1998. p. 59–66. [68] Eidenberger H. How good are the visual MPEG-7 fea- [80] Deselaers T, Weyand T, Ney H. Image Retrieval and Annotation Using Maximum Entropy. In: Peters C, tures? In: Proceedings SPIE Visual Communications Clough P, Gey F, Karlgren J, Magnini B, Oard D, et al., and Image Processing Conference. vol. 5150. Lugano, editors. Evaluation of Multilingual and Multi-modal InItaly; 2003. p. 476–488. formation Retrieval – Seventh Workshop of the CrossLanguage Evaluation Forum, CLEF 2006. vol. 4730 of [69] Manjunath B, Ohm J-R, Vasudevan V V, Yamada A. Lecture Notes in Computer Series. Alicante, Spain; 2007. Color and Texture Descriptors. IEEE Trans Circuits p. 725–734. and Systems for Video Technology 2001;11(6):703–715. [70] Ohm J-R. The MPEG-7 Visual Description Framework [81] Kittler J. On Combining Classifiers. IEEE Transactions on Pattern Analysis and Machine Intelligence – Concepts, Accuracy and Applications. In: CAIP 2001. 1998;20(3):226–239. No. 2124 in LNCS; 2001. p. 2–10. [71] Yang Z, Kuo C. Survey on image content analysis, indexing, and retrieval techniques and status report of MPEG-7. Tamkang Journal of Science and Engineering 1999;3(2):101–118.
[82] Heesch D, R¨ uger S. Combining Features for ContentBased Sketch Retrieval – A Comparative Evaluation of Retrieval Performance. In: European Colloquium on Information Retrieval Research. vol. 2291 of LNCS. Glasgow, Scotland, UK; 2002. p. 41–52.
[72] Vasconcelos N, Vasconcelos M. Scalable Discriminant [83] Nowak E, Jurie F. Learning Visual Similarity Measures Feature Selection for Image Retrieval and Recognition. for Comparing Never Seen Objects. In: CVPR 2007. In: CVPR 2004. 2. Washington, DC, USA; 2004. p. 770– Minneapolis, MN, USA; 2007. . 775. [73] Najjar M, Ambroise C, Cocquerez J-P. Feature Selection For Semi Supervised Learning Applied To Image Retrieval. In: ICIP 2003. vol. 3. Barcelona, Spain; 2003. p. 559–562. [74] Hand D, Manila H, Smyth P. Principles of Data Mining. Cambridge, MA: MIT Press; 2001. [75] Shao H, Svoboda T, van Gool L. ZuBuD – Zurich Buildings Database for Image Based Recognition. Computer Vision Lab, Swiss Federal Institute of Technology, Switzerland. Zurich, Switzerland; 2003. [76] Shao H, Svoboda T, Tuytelaars T, Gool L V. HPAT Indexing for Fast Object/Scene Recognition Based on Local Appearance. In: Conference on Image and Video Retrieval. vol. 2728 of LNCS. Urbana-Champaign, IL: Springer Verlag; 2003. p. 71–80. [77] Schaefer G, Stich M. UCID - An Uncompressed Colour Image Database. In: Proc. SPIE Storage and Retrieval Methods and Applications for Multimedia. San Jose, CA, USA; 2004. p. 472–480. 20
WANG
UW & UCID 10
12 5
16 2 18 1411 1
8
19
15
34
7 17
13
9
6
6 17 15
13
7 8 9
34
14 1 16 11
19
2 18
10
5 12
IRMA
ZuBuD
10
7 16
15 7
8
111 14
17 13
19 14 3 918 11 2
17
9 13
4 6
8 4
2
3 6
18
3 5
10 15
12 5 19
12
10
7 17
15 8
16 11 1 14 9 13 18 2 19
6
3
4
12 5 Figure 9: Correlation of the different features visualized using multi-dimensional scaling. Features that lie close together have similar properties. Top 4 plots: database-wise visualization, bottom plot: all databases jointly. The numbers in the plots denote the individual features: 1: color histogram, 2: MPEG7: color layout, 3: LF SIFT histogram, 4: LF SIFT signature, 5: LF SIFT global search, 6: MPEG7: edge histogram, 7: Gabor vector, 8: Gabor histograms, 9: gray value histogram, 10: global texture feature, 11: inv. feature histogram (monomial), 12: LF patches global, 13: LF patches histogram, 14: LF patches signature , 15: inv. feature histogram (relational), 16: MPEG7: scalable color, 17: Tamura texture histogram, 18: 32x32 image, 19: Xx32 image. 21
80
irma ucid uw wang zubud
40 20
mean average precision [%]
60
−0.81 −0.99 −0.67 −0.90 −0.93
0
Correlation of ER and MAP: −0.86 0
20
40
60
80
100
classification error rate [%]
Figure 10: Analysis of the correlation between classification error rate and mean average precision for the databases. The numbers in the legend give the correlation for the experiments performed on the individual databases.
60 20
40
color histogram MPEG7: color layout LF SIFT histogram LF SIFT signature LF SIFT global search MPEG7: edge histogram Gabor vector Gabor histogram gray value histogram global texture feature inv. feature histogram (monomial) LF patches global LF patches histogram LF patches signature inv. feature histogram (relational) MPEG7: scalable color Tamura texture histogram 32x32 image Xx32 image
0
mean average precision [%]
80
−1.0 −1.0 −0.9 −0.4 −1.0 −1.0 −1.0 −1.0 −0.6 −1.0 −1.0 −0.8 −0.6 −0.8 −1.0 −0.9 −0.9 −0.7 −0.7
0
20
40
60
80
100
classification error rate [%]
Figure 11: Analysis of the correlation between classification error rate and mean average precision for the features. The numbers in the legend give the correlation for the experiments performed using the individual features.
22