tem which uses a weighted combination of different features in the statistical .... Because each possible tracking center is not likely to produce a high score, pruning .... call RWTH-Boston-104, we use 201 annotated video streams of ASL ...
Geometric Features for Improving Continuous Appearance-based Sign Language Recognition Morteza Zahedi, Philippe Dreuw, David Rybach, Thomas Deselaers, and Hermann Ney Lehrstuhl f¨ur Informatik 6 – Computer Science Department RWTH Aachen University – D-52056 Aachen, Germany @cs.rwth-aachen.de
Abstract
In this paper we present an appearance-based sign language recognition system which uses a weighted combination of different features in the statistical framework of a large vocabulary speech recognition system. The performance of the approach is systematically evaluated and it is shown that a significant improvement can be gained over a baseline system when appropriate features are suitably combined. In particular, the word error rate is improved from 50% for the baseline system to 30% for the optimized system.
1 Introduction Appearance-based approaches, i.e. no explicit segmentation is performed on the input data, offer some immediate advantages for automatic sign language recognition over systems that require special data acquisition tools. In particular, they may be used in a “realworld” situation where no special data recording equipment is feasible. Automatic sign language recognition is an area of high practical relevance because sign language often is the only means of communication for deaf people. According to the sign language linguist Stokoe a first phonological model is defined in [10] to represent a sign as a kind of “chireme”, as vowels and consonants are similar to phonemes in spoken language. Signs can also be represented as sequences of movement- and hold-segments [7], where the movement-segment represents configuration changes of the signer (hand position, hand shape, etc.), and the hold-segment represents that the configuration of the signer remains stationary. In continuous signing, processes with effects similar to co-articulation in speech do also occur, but these processes do not necessarily occur in all signs. In [11] movement epenthesis, which occurs most frequently, is modeled to model hand movements without meaning (intersign transition periods). Although a couple of groups work in the field of linguistic modeling and processing of sign language, only few groups try to automatically recognize sign language from video, e.g. in [1] colored gloves are suited to be able to segment the fingers. Their approach requires a valid segmentation of the data that is used for training and of the data that is used to be recognized. This restricts their approach to rather artificial tasks under laboratory conditions.
In [12], appearance-based features are used for the recognition of segmented words of sign language. Simple, down-scaled images are used as features and various transformation invariant distance measures are employed for the recognition process. We present an approach to the automatic training and recognition of continuous American sign language (ASL). The training and the recognition do not need segmented words because the models are automatically determined. We employ a tracking method which uses dynamic programming to locate the dominant hand. Then, geometric features are extracted from this dominant hand and used as features in the later steps of the training and recognition process. These features are combined with down-scaled intensity images. In the recognition process Fisher’s linear discriminant analysis (LDA) is applied to reduce the number of parameters to be trained and to ease discrimination of the classes [3]. In Section 2 we introduce the framework underlying the presented approach, Section 3 shortly introduces the applied tracking method, and in Section 4 we present the features that are used in our approach. Section 5 presents the database that is used in the experiments, which are presented and interpreted in Section 6. Finally, the paper is summarized and concluded in Section 7.
2 System Overview In this section we give an overview of the automatic sign language recognition system which is used to recognize sentences of ASL. The system is based on a large vocabulary speech recognition system [6]. This allows us to adopt the techniques developed in automatic speech recognition and transfer the insights from this domain into automatic sign language recognition because there are large analogies between those areas. Common speech recognition systems are based on the Bayes’ decision rule. The basic decision rule for the classification of xT1 = x1 , ..., xt , ... xT is: � (1) wˆ N1 = arg max Pr(wN1 ) · Pr(xT1 |wN1 ) , wN 1
where wˆ N1 is the sequence of words that is recognized, Pr(wN1 ) is the language model, and Pr(xT1 |wN1 ) is the visual model (cp. acoustic model in speech recognition). As language model Pr(wN1 ) we use a trigram language model calculated by N
Pr(wN1 ) = ∏ Pr(wn |wn−1 n−2 ).
(2)
n=1
The visual model Pr(xT1 |wN1 ) is defined as: T
Pr(xT1 |wN1 ) = max ∏ Pr(st |st−1 , wN1 ) · Pr(xt |st , wN1 ), sT1 t=1
(3)
where sT1 is the sequence of states, and Pr(st |st−1 , wN1 ) and Pr(xt |st , wN1 ) are the transition probability and emission probability, respectively. In training, the model parameters are estimated from the training data using the maximum likelihood criterion and the EM algorithm with Viterbi approximation.
Scaling Image Processing
LDA
Hand Tracking
Geometric Features
Feature Combination
LDA
Recognition
Figure 1: System overview. As the language model, transition and emission probabilities can be weighted by exponentiation with exponents α , β and γ , respectively, the probability of the knowledge sources are estimated as: Pr(wN1 )
→
pα (wN1 ),
Pr(st |st−1 , wN1 )
→
pβ (st |st−1 , wN1 ),
Pr(xt |st , wN1 )
→
pγ (xt |st , wN1 ).
(4)
Thus, the decision rule is reformulated as: � N wˆ N1 = arg max α ∑ log p(wn |wn−1 n−2 ) wN 1
n=1
T
+ max ∑ β sT1 t=1
�
� �
log p(st |st−1 , wN1 ) + γ log p(xt |st , wN1 )
.
(5)
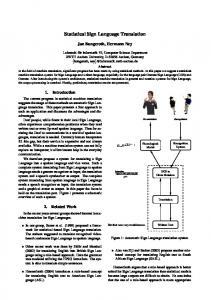
The exponents used for scaling, α , β and γ are named language model scale, time distortion penalty, and word penalty, respectively. The system overview is shown in Fig. 1. The tracking of the dominant-hand will be described in Section 3. In Section 4.1 we describe how we extract the geometric features from the tracked hand patches which are combined with appearance-based features described in Section 4.2.
3 Tracking Using Dynamic Programming The tracking method introduced in [2] is employed in this work. The used tracking algorithm prevents taking possibly wrong local decisions because the tracking is done at the end of a sequence by tracing back the decisions to reconstruct the best path. The tracking method can be seen as a two step procedure: in the first step, scores are calculated for each frame starting from the first, and in the second step, the globally optimal path is traced back from the last frame of the sequence to the first. Step 1. For each position u = (i, j) in frame xt at time t = 1, ..., T a score q(t, u) is calculated, called the local score. The global score Q(t, u) is the total score for the best path until time t which ends in position u. For each position u in image xt , the best predecessor is searched for among a set of possible predecessors from the scores Q(t −
1, u′ ). This best predecessor is then stored in a table of backpointers B(t, u) which is used for the traceback in Step 2. This can be expressed in the following recursive equations: Q(t, u) =
max {(Q(t − 1, u′) − T (u′ , u)} + q(t, u)
u′ ∈M(u)
B(t, u) = arg max{(Q(t − 1, u′) − T (u′ , u)},
(6) (7)
u′ ∈M(u)
where M(u) is the set of possible predecessors of point u and T (u′ , u) is a jump-penalty, penalizing large movements. Step 2. The traceback process reconstructs the best path uT1 using the score table Q and the backpointer table B. Traceback starts from the last frame of the sequence at time T using cT = arg maxu Q(T, u). The best position at time t − 1 is then obtained by ct−1 = B(t, ct ). This process is iterated up to time t = 1 to reconstruct the best path. Because each possible tracking center is not likely to produce a high score, pruning can be integrated into the dynamic programming tracking algorithm for speed-up. One possible way to track the dominant hand is to assume that this object is moving more than any other object in the sequence and to look at difference images where motion occurs to track these positions. Following this assumption, we use a motion information score function to calculate local scores using the first-order time derivative of an image. The local score can be calculated by a weighted sum over the absolute pixel values inside the tracking area. More details and further scoring functions are presented in [2].
4 Features In this section we present how we extract features from the dominant hand of the signer and how we extract appearance-based features from the video sequences. These different features are then weighted and combined in the statistical framework of a large vocabulary speech recognition system to recognize the signs.
4.1 Geometric Features To extract features from the tracked hand patches of the signer, the hand is segmented using a simple chain coding method [4]. In total 34 features are extracted and can roughly be categorized into four groups: Basic Geometric Features. The first group of the features contains features describing basic properties including the size of the area of the hand, the length of the border of the hand, the x and y coordinates of the center of gravity, the most top-left and rightbottom points of the hand and the compactness. The definition of the features is based on basic methods of image processing [9]. In total, nine features are calculated, where the definition of each is very well-known, except for compactness. The compactness of the area is calculated by: 4·π ·A , B2 which ranges from 0 to 1. The compactness is 0 for lines and 1 for circles. Compactness =
(8)
Moments. The second group consists of features that are based on moments [9]. A total of 11 features is calculated. The two dimensional (p + q)th order moments of a density distribution function ρ (x, y) are defined as: m pq = ∑ ∑ x p y p ρ (x, y). x
(9)
y
If ρ (x, y) is piecewise continuous and it has non-zero values only in the finite part of the two dimensional plane, then the moments of all orders exist and the sequence {m pq } is uniquely determined by ρ (x, y) and vise versa. The small order moments of the ρ (x, y) describes the shape of the region. For example m00 is equal to the area size, and m01 and m10 gives the x and y coordinates of the center of gravity, and also m11 , m20 and m02 yield the direction of the main axis of the distribution. The small order of the moments is calculated in first group of the features. The moments m02 , m03 , m11 , m12 , m20 , m21 and m30 which are invariant against translation are calculated in this group and used as features. The inertia parallel to the main axis J1 and the inertia orthogonal to the main axis J2 , both invariant against translation, rotation and flipping are calculated by: � � q m00 2 2 · m20 + m02 + (m20 − m02 ) + 4m11 J1 = 2 � � q m00 2 2 · m20 + m02 − (m20 − m02 ) + 4m11 . (10) J2 = 2 The orientation of the main axis, invariant to translation and scaling is calculated by: 180 2m11 ). (11) arctan ( 2π m20 − m02 The eccentricity, ranges from zero for a circle to one for a line is calculated by: Orientation =
Eccentricity =
(m20 − m02 )2 + 4m11 2 . (m20 + m02 )2
(12)
The eccentricity is invariant against translation, rotation, scaling and flipping. Hu Moments. Here, seven features are extracted by determining the first seven moment invariants as described in [5]. hu1
=
− log(m20 + m02 )
hu2
=
− log (m20 − m02 )2 + 4m211
hu3
=
hu4
=
hu5
=
hu6
=
� − log (m30 − 3m12)2 + (3m21 − m03)2 � − log (m30 + m12 )2 + (m21 + m03)2 � � − log (m30 − 3m12)(m30 + m12 ) (m30 + m12)2 − 3(m21 + m03)2 �� +(3m21 − m03 )(m21 + m03 ) 3(m30 + m12)2 − (m21 + m03 )2 � � − log (m20 − m02) (m30 + m12 )2 − (m21 + m03 )2 � +4m11 (m30 + m12)(m21 + m03)
�
hu7
=
� � − log (3m21 − m03 )(m30 + m12 ) (m30 + m12)2 − 3(m21 + m03)2 �� (13) −(m30 − 3m12)(m21 + m03 ) 3(m30 + m12)2 − (m21 + m03 )2
All Hu moments are invariant against translation, rotation, scaling and flipping except the hu7 which is not invariant against flipping. Combined Geometric Features. Here, seven features are calculated, taking into account the distance between the center-of-gravity for the tracked object and certain positions in the images. Additionally, the distance between the left most point and right most point to main axis and the distance between the front most and rear most point to center of gravity along main axis are calculated. Thus, we end up with 34 geometric features that are extracted from the hand patches.
4.2 Appearance-based Features In this section, we briefly introduce the appearance-based features used in our continuous ASL sentence recognition system. In [13], different appearance-based features are explained in more detail, including the intensity image, skin color intensity, and different kinds of first- and second-order derivatives to recognize segmented ASL words. The results show that down-scaled intensity images perform very well. According to these results we employ these features in the work presented here. The features are directly extracted from the images of the video frames. We denote by Xt (i, j) the pixel intensity at position (i, j) in the frame t of a sequence, t = 1, . . . , T . We transfer the matrix of an image to a vector xt and use it as a feature vector. To decrease the size of the feature vector, according to the informal experiments, we use the intensity image down-scaled to 32×32 pixels denoted by Xt′ : xt,d = Xt′ (i, j),
d = 32 · j + i,
(14)
where xt = [xt,1 , ..., xt,D ] is the feature vector at time t with the dimension D = 1024.
5 Database The National Center for Sign Language and Gesture Resources of Boston University has published a database of ASL sentences1 [8]. Although this database is not produced primarily for image processing and recognition research, the data is available to other research groups and, thus, can be a basis for comparisons of different approaches. The image frames are captured by a black/white camera, directed towards the signer’s face. The movies are recorded at 30 frames per second and the size of the frames are 312×242 pixels. We extract the upper center part of size 195×165 pixels. (Parts of the bottom of the frames show some information about the frame and the left and right border of the frames are unused.) To create our database for signer-independent ASL sentence recognition which we call RWTH-Boston-104, we use 201 annotated video streams of ASL sentences. We separate the recordings into a training and evaluation set. To optimize the parameters of the system, the training set is split into separate training and development parts. To 1 http://www.bu.edu/asllrp/ncslgr.html
Table 1: Corpus statistics for RWTH-Boston-104 database. Training set Evaluation Training Development set Sentences 131 30 40 Running words 695 172 216 Unique words 103 65 79 Singletons 37 38 45
Figure 2: Example frames of the RWTH-Boston-104 database showing the 3 signers. optimize parameters in training process, the system is trained by using 131 sentences from the training set and evaluated using the 30 sentences from the development set. When parameter tuning is finished, the training data and development data, i.e. 161 sentences, are used to train one model using the optimized parameters. This model is then evaluated on the so-far unseen 40 sentences from the evaluation set. Corpus statistics of the database are shown in Table 1. In the RWTH-Boston-104 database, there are three signers, one male and two females. The ASL sentences of the training and evaluation set are signed by all three signers to be used in a signer-independent recognition system. The signers are dressed differently and the brightness of their clothes is different. The signers and some sample frames of the database are shown in Figure 2.
6 Experimental Results Here, we present experiments which are performed on the RWTH-Boston-104 database using the described recognition framework with the presented features. The development set is used to optimize the parameters of the system including language model scale α , time distortion penalty β , and word penalty γ , as well as the weights that are used to combine the different features. In Table 2 the word error rate (WER) of the system using intensity images downscaled to 32 × 32 and geometric features on development and evaluation set are reported. The WER is equal to the number of deletions, substitutions and insertions of words divided by the number of running words. In development process only 131 sentences are used to train the model, while 161 sentences are used for final training. Therefore the error rate of the system on development set is higher than on the evaluation set. Also, it can be seen that the geometric features alone slightly outperform the appearance-based features for the development and for the evaluation set. In the following, we perform experiments to find the best setup for the dimensionality reduction using LDA for the image-features and the geometric features individually. The results are given in Table 3. When using intensity image features with a very small number
Table 2: Word error rates [%] of the system. Features image down-scaled to 32 × 32 Geometric Features
Development set 67 61
Evaluation set 54 50
Table 3: Word error rates [%] of the system employing LDA. image down-scaled to 32 × 32 Development Evaluation set set 61 40 60 36 60 37 61 39 66 49 78 63 79 67 – –
Number of components 150 90 44 34 20 15 10 5
Geometric Features Development Evaluation set set – – – – – – 57 42 58 41 54 42 52 35 61 37
of components, the smaller number of components yields larger word error rates because the system looses the information of the image frames. However, when the feature vectors are too large, the word error rate increases because too much data that is not relevant for the classification disturbs the recognition process. For the image features the best dimensionality is 90 and for the geometric features, the best dimensionality is 10. Given these results, we now combine the different features. Therefore we start from the previous experiments, i.e. we use the 90 most discriminatory components of the LDA transformed image features and the 10 most discriminatory features of the LDA transformed geometric features (see Fig. 1). Because the word error rate of the system relies on the scaling factors α , β and γ the experiments are done with the optimized parameters from the previous experiments. Weighting the features, the word error rate of the system on development and evaluation set, using geometric features’ parameters and intensity image’s parameters, are shown in Figure 3 and Figure 4, respectively. The graphs show the word error rate with respect to the weight of intensity features. 75 70
Development set Evaluation set
65
ER[%]
60 55 50 45 40 35 30 0 0.2 0.4 0.6 0.8 1 weight(original image) = 1 - weight(geometric features)
Figure 3: WER [%] using feature weighting, tuned by geometric features’ parameters.
70
Development set Evaluation set
65 60
ER[%]
55 50 45 40 35 30 0 0.2 0.4 0.6 0.8 1 weight(original image) = 1 - weight(geometric features)
Figure 4: WER [%] using feature weighting, tuned by intensity image’s parameters. The weight of intensity image features and geometric features are chosen such that they add to 1.0. The experiments are performed for both the evaluation set and the development set and it can be seen that optimizing the settings on the development set leads to good results on the evaluation data as well. In Figure 3 the parameters that are optimized for the geometric features are used and the weight for geometric and intensity features is altered. The best WER is achieved for a weighting of 0.2 and 0.8 for the geometric and intensity images respectively for the development and the evaluation set. The same experiment, but with the settings optimized for the intensity features is performed and the experimental results are given in Figure 4. Here, the best WER is obtained for the development set with a weighting of 0.4 and 0.6 respectively. And this also leads to a good result on the evaluation data, i.e. the word error rate of 31%, Although the best word error rate of 30% is achieved on the evaluation set. Interestingly, using the parameters for the intensity features slightly outperforms the parameters for the geometric features. These results are due to the higher dimensionality of the intensity features and thus the scaling factors α , β , and γ optimized for the intensity images suit the new situation with a feature vector of an even higher dimensionality better. A direct comparison to other approaches from other research groups is not possible, because the results on the RWTH-Boston-104 database are published here as a first time. The database is publicly available to other groups to evaluate their own approaches.
7 Conclusion We presented an automatic sign language recognition system. It is shown that a suitable combination of different features yields strongly improved word error rates over two different baseline systems. Also LDA is a useful means of selecting the most relevant information from feature vectors. Even though the word error rates are high, they are still competitive to other published results which do not use special data acquisition devices and try to build a robust speaker independent system to recognize continuous sign language sentences. One reason for the high word error rate is the high number of singletons in the database. Additionally we still have to cope with the problem of automatic word modelling, which shows that feature extraction is important but also that problems like movement epenthesis, word length modelling, and data sparseness have to be considered in continuous sign language recognition in future.
References [1] B. Bauer, H. Hienz, and K.F. Kraiss. Video-based continuous sign language recognition using statistical methods. In Proceedings of the International Conference on Pattern Recognition, pages 463–466, Barcelona, Spain, September 2000. [2] Philippe Dreuw, Thomas Deselaers, David Rybach, Daniel Keysers, and Hermann Ney. Tracking using dynamic programming for appearance-based sign language recognition. In 7th IEEE International Conference on Automatic Face and Gesture Recognition, FG 2006, IEEE, pages 293–298, Southampton, April 2006. [3] Richard O. Duda, Peter E. Hart, and David G. Stork. Pattern Classification, Second Edition. John Wiley and Sons, Inc, N.Y., New York, 2001. [4] J. R. R. Estes and V. R. Algazi. Efficient error free chain coding of binary documents. In Data Compression Conference 95, pages 122–131, Snowbird, Utah, March 1995. [5] Ming-Kuei Hu. Visual pattern recognition by moment invariants. IRE transactions on Information Theory, 8:179–187, 1962. [6] S. Kanthak, A. Sixtus, S. Molau, R. Schlter, and H. Ney. Fast Search for Large Vocabulary Speech Recognition. 2000. [7] S.K. Liddell and R.E. Johnson. American sign language: The phonological base. Sign Language Studies, 64:195–277, 1989. [8] C. Neidle, J. Kegl, D. MacLaughlin, B. Bahan, and R.G. Lee. The Syntax of American Sign Language: Functional Categories and Hierarchical Structure. Cambridge, MA: MIT Press, 2000. [9] M. Sonka, V. Hlavac, and R. Boyle. Image Processing, analysis and Machine Vision. Books Cole, 1998. [10] William C. Stokoe. Sign language structure. An Outline of the visual communication system of the American deaf, volume 8 of Studies in Linguistics. Occasional Papers. Buffalo Press, N.Y., University of Buffalo, New York, 1980. [11] C. Vogler. American Sign Language Recognition: Reducing the Complexity of the Task with Phoneme-Based Modeling and Parallel Hidden Markov Models. PhD thesis, University of Pennsylvania, USA, 2003. [12] M. Zahedi, D. Keysers, T. Deselaers, and H. Ney. Combination of tangent distance and an image distortion model for appearance-based sign language recognition. In Proceedings of DAGM 2005, 27th Annual meeting of the German Association for Pattern Recognition, volume 3663 of LNCS, pages 401–408, Vienna, Austria, September 2005. [13] M. Zahedi, D. Keysers, and H. Ney. Appearance-based recognition of words in american sign language. In Proceedings of IbPRIA 2005, 2nd Iberian Conference on Pattern Recognition and Image Analysis, volume 3522 of LNCS, pages 511–519, Estoril, Portugal, June 2005.