Kicker Structure. W V7 W. Comb. Generator. Bunch. Error. Timing & Control. & *. Low- pass Filter. Master Oscillator. Phase-locked at 6*. RF of Cavity. External.
SLAC-PUB-7305 LBNL-39363 September 1996
Feedback Control and Beam Diagnostic Algorithms for a Multiprocessor DSP System D. Teytelman, R. Claus, J. Fox, H. Hindi, I. Linscott, S. Prabhakar Stanford Linear Accelerator Center, P.O. Box 4349, Stanford, CA 94309
A. Drago INFN - Laboratori Nazionali di Frascati, P.O. Box 13,1-00044 Frascati (Roma), Italy
G. Stover Lawrence Berkeley Laboratory, 1 Cyclotron Road, Berkeley, CA 94563 Abstract. The multibunch longitudinal feedback system developed for use by PEP-II, ALS and DAONE uses a parallel array of digital signal processors to calculate the feedback signals from measurements of beam motion. The system is designed with general-purpose programmable elements which allow many feedback operating modes as well as system diagnostics, calibrations and accelerator measurements. The overall signal processing architecture of the system is illustrated. The real-time DSP algorithms and off-line postprocessing tools are presented. The problems in managing 320K samples of data collected in one beam transient measurement are discussed and our solutions are presented. Example software structures are presented showing the beam feedback process, techniques for modal analysis of beam motion (used to quantify growth and damping rates of instabilities) and diagnostic functions (such as timing adjustment of beam pick-up and kicker components). These operating techniques are illustrated with example results obtained from the system installed at the Advanced Light Source at LBL.
DfSTR,BUT70N OF T S DOCUMENT H f
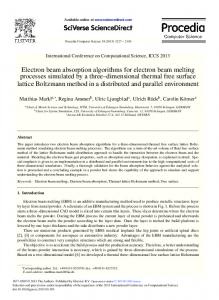
INTRODUCTION A feedback system for bunch-by-bunch control of longitudinal coupledbunch instabilities has been developed and installed at the Advanced Light Source at LBL. The system design is described in detail in earlier publications (1), (2). As shown in Fig. 1, signals from four button-type pickups are combined and fed to stripline comb generator. The generator produces a four cycle burst at the sixth harmonic of the ring RF frequency (2998 MHz). The resultant signal is phase detected, then digitized at the bunch crossing rate. A correction signal for each bunch is computed by a digital signal processing module and applied to the beam through a fast D/A, an output modulator, a power amplifier and a kicker structure. The correction signal for a given bunch is calculated using the past information on the motion of only that bunch. As a result it is possible to use highly parallel computational structure to achieve the necessary throughput. Since the system * Work supported by Department of Energy contract DE-AC03-76SF00515
Presented at the Seventh Beam Instrumentation Workshop, Argonne, Illinois, May 6-9, 1996
MASTER
DISCLAIMER This report was prepared as an account of work sponsored by an agency of the United States Government Neither the United States Government nor any agency thereof, nor any of their employees, make any warranty, express or implied, or assumes any legal liability or responsibility for the accuracy, completeness, or usefulness of any information, apparatus, product, or process disclosed, or represents that its use would not infringe privately owned rights. Reference herein to any specific commercial product, process, or service by trade name, trademark, manufacturer, or otherwise does not necessarily constitute or imply its endorsement,recommendation,or favoring by the United States Government or any agency thereof. The views and opinions of authors expressed herein do not necessarily state or reflect those of the United States Government or any agency thereof.
DISCLAIMER
Portions of this document may be illegible in electronic image products. Images are produced from the best available original document
BPM
(2
Beam Bunches
/ \
/ \
/\
Kicker Structure W V7 W
Comb Generator
Timing & Control
Bunch Error & *
Lowpass Filter
_0 Q.
QI External Drive Input
I Q
2&? DSP
Farm of Digital Signal Processors
Master Oscillator Phase-locked at 6* RF of Cavity
Kicker Oscillator 1.125 GHz Phase-locked to Ring
10-96
8146A1
FIGURE 1. Block diagram of the longitudinal feedback system
uses digital signal processors (DSPs) to process the synchrotron oscillation signals, it is possible to extend the functionality of the feedback system to include many modes of feedback operation as well as various diagnostics. A large suite of software tools has been developed to take advantage of the flexibility of the signal processing architecture.
OVERALL SOFTWARE STRUCTURE The feedback system software consists of three major layers. On the very top level we have graphical operator interface constructed using the Experimental Physics and Industrial Control System (EPICS) tools. This layer controls the hardware drivers and support programs of the middle layer, composed of VME and VXI single-board computers running the VxWorks (Wind River Systems) operating system. The VME crates are populated with the DSP processing boards while the VXI crate houses the downsampler and the holdbuffer modules. At bottom level there are real-time programs which are coded in the native assembly language of the AT&T 1610 DSP chip (3).
2
End of recording
Start of recording Adjustable Adjustable Normal ^ _ hold-off—^.^_ filter switch feedback delay w breakpoint filter 0
^
^. if Ji
filter 1
filter 0
time Normal feedback
Filter coefficient set switch
trigger: software or hardware
FIGURE 2. Event sequencing for the triggerable record program
DSP ALGORITHM All the DSP programs written to date can be divided into three classes. They are feedback, data collection and feedback system support and diagnostics. Feedback programs are the most basic of all, providing correction signal computation at the highest possible rate. The feedback kick is computed using a finite impulse response (FIR) filter with the following algorithm N-l
"«(«) = X c(m)ty (n-m) t
(1)
m=0
The coefficients c are chosen to maximize the gain at the synchrotron frequency and to provide the appropriate phase shift through the filter for overall phase inversion in the feedback loop. The number of taps N is variable from 2 to 12. The FIR filter supports 4 different coefficient sets switchable on the fly. An infinite impulse response (IIR) filter is currently being developed.
DATA COLLECTION TOOLS Another class of programs are data collection tools. One of the most versatile programs currently in use is the triggerable record program. This program allows capture of the phase oscillations of all or selected bunches. It utilizes the hardware resources on the DSP board to provide uninterrupted feedback signal computation while collecting data. Each DSP is equipped with 8K words of dual-ported RAM accessible by the DSP and the VME host processor. When recording is triggered, the dual-port memory is used to store the sampled phase coordinate of the bunches. Once the recording is finished an interrupt is sent to the VME host processor, which then reads out the data from the dual-port memory. Figure 2 shows the sequence of events for the data capture by the record program. Initially, before the
3
Filter the bunch oscillations using a bandpass filter centered at the synchrotron frequency. At this point we are handling 6 samples/synchrotron period.
T
Upsample the data to remove the sampling time jitter. This step produces data array 22 times as large, i.e. 6.77 Msamples.
I
Downsample to the original sampling rate of 6 samples/period. That takes us back to 322 Ksamples or 2.46 MB
I
Do an FFT across the bunches.
bunch 328 bunch 327 ill
no
bunch 2 bunch 1 Samples ^
Do a least squares fit to the growth part of the modal matrix.
no
£
Do a least squares fit to the damping part of the modal matrix.
I
END FIGURE 3. Flowchart for the modal analysis code
trigger condition is satisfied, the program runs a normal FIR filter. Recording trigger can be generated by software (from an EPICS button) or hardware (from a logic level signal). The software trigger is used to take a snapshot of the beam
4
Bunch: 310; Beam current: 11.5 mA
-10 -11 -12 Time (ms) Bunch: 311
Time (ms) Bunch: 312
1
2
3 4 Time (ms) FIGURE 4. Record of an injection transient.
5
6
motion and may be synchronized to software events. However in some conditions it is necessary to link the data capture to a hardware event, such as an injection into the storage ring. Such synchronization is provided by the hardware trigger. The hardware and software triggers can be combined to allow selection of one event
5
out of a sequence. After the trigger the filter coefficients switch to an alternate set to allow the user to choose a different feedback condition, e.g. no feedback or positive feedback. A variable length hold-off before data recording occurs after the trigger. This delay is used to optimize the recording window position for the slow transients. After the hold-off we start recording data in the dual-ported RAM. At the variable breakpoint the coefficients revert to the original feedback values. After the full record is written, the DSP program interrupts the host processor and returns to the initial pre-trigger state. The data records are stored on the Unix-based server and analyzed off-line using Matlab scripts. The most common application of the record programs is to provide grow/damp records. In these experiments the longitudinal oscillations are allowed to grow for some time and then damped. The data allows to identify the unstable modes and calculate the growth and damping rates for those modes (4). The flowchart for the Matlab-based modal analysis code is given in Figure 3. This code is heavily optimized to allow immediate analysis of the data in the control room. Another application of the triggered record program is to capture the injection transients. To synchronize the recording to the event we use the hardware trigger from logic-level signal derived from the storage ring injection pulse. Figure 4 shows part of a time-domain record of motion due to the injection of charge into bucket 311. We observe no motion in the preceding bucket (310) and a quarteramplitude motion in the following bucket (312). That observed motion is due to the excitation by the wakefields of bucket 311, coupling due to the finite detector bandwidth, and possible spill during the injection. The initial amplitude of motion is more than 90 degrees at the detection frequency of 2998 MHz and the detected signal "wraps around" during the first millisecond of the transient. Since we detect a product of current and phase, magnitude of motion is less than full scale due to low current in the bunch. The motion is then damped by the action of the feedback system and the natural radiation damping. The decay of recorded bunch 311 amplitude also contains effects due to decoherence of the injected and stored charge motion.
ik From BPM
3X
Z3ZZZ
ill A/D DSP farm D/A Programmable delay line
(drive)
Programmable delay line
FIGURE 5. Setup for the back-end timing measurement.
6
331
35=
Kicker structure
Spectrum analyzer
Phase shifter
=r
a
From LO
D
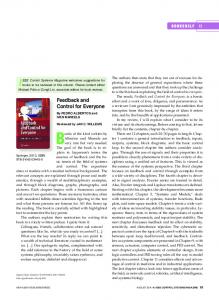
DIAGNOSTIC TOOLS In addition to feedback filters and data recorders the software suite includes various diagnostics for setting up and calibrating the feedback system. One of the most commonly used programs is the drive program. It allows the system to drive all or selected bunches with an arbitrary excitation sequence. The sequence data is loaded in the dual-ported RAM and the DSP program cycles through it. The sequences are only limited by the amount of the dual-ported memory available. A generator for a sine-wave sequence is available through the EPICS panel and is controlled by the amplitude and frequency desired. At the same time an interface for loading custom excitation sequences is provided where the sequence data is loaded from an ASCII file. The drive program has many uses for feedback system setup and diagnostics. For example, driving a sinusoidal excitation at different amplitudes allows a check of the linearity of the back-end modulator and power amplifier for the operational configuration. Another use of the drive program is to check kicker timing. For proper feedback system operation it is necessary to time align the 2 ns kick and the proper bunch. We use the drive program to excite a single bunch at the synchrotron frequency. The timing program sweeps the back-end delay line and measures the -70
-75
-80 CO
2,
•D
Q
-95
-100
-105
8 9 10 Back-end delay (ns) FIGURE 6. Back-end timing sweep.
7
beam response at the synchrotron frequency using GPIB-controlled spectrum analyzer connected to the A/D monitor signal. This setup is illustrated in Figure 5. To make sure the longitudinal motion we measure is due to the kicker excitation, only one bucket in the ring is populated. Figure 6 shows the detected power at the synchrotron frequency versus delay line setting. Since the longitudinal kicker (5) is a bandpass device with a 1125 MHz center frequency, its time response has -400 ps periodicity. The overall envelope of the response shows the convolution of the kicker fill time, kicker bandwidth and amplifier rise time/bandwidth. A back-end timing program automatically takes the data and determines the best delay line setting (highest kicker gain at 8750 ps). Another commonly used diagnostic is the front-end calibration program. To obtain a calibration factor to convert from the beam motion in A/D converter counts to beam motion in degrees of phase at the RF frequency, the DSP program first measures the DC level at the A/D by averaging a large number of samples. Then the phase of the local oscillator is shifted via program control by a known reference amount. After a delay to allow the phase shifter to settle the input DC level is measured again. The difference between the two measurements is used to calculate the calibration factor.
SUMMARY The programmable nature and high computational power of the longitudinal feedback system make possible a number of measurements and diagnostics in addition to the correction signal computation. The above features allow the automation of a number of otherwise tedious and slow system setup and calibration tasks. DSP-based feedback signal computation enables testing alternative feedback algorithms such as IIR filters. We are just starting to develop new techniques that take full advantage of the system's flexible architecture. 1. 2.
Oxoby, G., et al., "Bunch-by-Bunch Longitudinal Feedback System for PEP-H," presented at the 4 European Particle Accelerator Conference (EPAC 94), London, England, June 27 - July 1, 1994. Teytelman, D., et al., "Operation and Performance of the PEP-U Prototype Longitudinal Damping System at the ALS," presented at the 16 IEEE Particle Accelerator Conference (PAC 95) and International Conference on High Energy Accelerators, Dallas, Texas, May 1-5, 1995. Claus, R., et al., "Software Architecture of the Longitudinal Feedback System for PEP-H", ALS and DAONE," presented at the 16 IEEE Particle Accelerator Conference (PAC 95) and International Conference on High Energy Accelerators, Dallas, Texas, May 1-5, 1995. Fox, J. D., et al., "Observation, Control and Modal Analysis of Longitudinal Coupled-Bunch Instabilities in the ALS via a Digital Feedback System," presented at the 7 Beam Instrumentation Workshop, Argonne, IL, May 6-9,1996. Corlett J., et al., "Longitudinal and Transverse Feedback Kickers for the ALS," presented at the 4 European Particle Accelerator Conference (EPAC 94), London, England, June 27 - July 1, 1994. th
3.
th
4.
th
5.
8