This paper is accepted for publication in: 2018 14th IEEE/ASME International Conference on Mechatronic and Embedded Systems and Applications (MESA)
Filtering Scheme for Context-Aware Fog Computing in Cyber-Physical Systems Teemu Mononen Laboratory of Automation and Hydraulic Engineering Tampere University of Technology Tampere, Finland
[email protected]
Mohammad M. Aref Laboratory of Automation and Hydraulic Engineering Tampere University of Technology Tampere, Finland
[email protected]
Abstract In the cloud-based Internet of Things, the amount of available network bandwidth can become a bottleneck, especially in real-time sensor network applications. This study presents an architecture and an algorithm for context-aware fog data filtering that can map data features and their appearance frequency. This reduces the amount of data sent using long-range communications. In this study, a Fast Fourier Transform (FFT)-based algorithm is presented, and a feature mapping technique is used. The filtering algorithm considers both historic data and adjacent sensor data to determine whether unexpected sensor outputs are caused by events in the system or faulty sensor readings. The type of data transmitted to supervisors is determined by the needs of the receivers. In this way, both events and raw data can be accessed from the proposed filters. Keywords Internet of things, cloud computing, fog computing, context-aware filtering
I. INTRODUCTION In networked cyber-physical systems (CPSs), where computing assets are tightly interconnected with the physical parts of the system, the Internet of Things (IoT) has been used to provide simple devices with access to web-based computing resources. The IoT paradigm has mostly been used in monitoring and predictive maintenance applications, but research has been conducted to apply the idea to other applications [1] [2] [3]. Another newly adopted technology, cloud computing, has been broadly studied and used in numerous applications, such as big data analytics [3]. Providing ubiquitous and scalable computing resources, cloud computing is a viable solution in computing-intensive applications. Combining IoT and cloud computing can provide a platform for large-scale information acquisition and sharing, along with virtually unlimited processing power in the cloud. Such a shared intelligence platform can be advantageous in modern distributed control systems, where information can be shared between individual control circuits to improve the collective performance of a plant [3]. In most cases, cloud resources are available over long-range communications. This will increase the latency of data transfer, which is a critical aspect of real-time systems. In applications
Jouni Mattila Laboratory of Automation and Hydraulic Engineering Tampere University of Technology Tampere, Finland
[email protected]
with such timing requirements, bringing the cloud closer to the local components will reduce this latency. This can be realized using fog [4]. Fog consists of fog nodes that are distributed in a moderate area, in which short-range communications can be applied. Fog nodes can be, for example, smartphones or other devices that are capable of data processing and transmitting. Computing tasks can be offloaded to the fog much like in the cloud, but it can be done with smaller network latency and less available computing power. The fog infrastructure communicates with the cloud, so the vast processing power is available in a system consisting of both the fog and the cloud [4]. With modern communication technologies, data transfer from sensors to the cloud can be realized in a reliable way. Data can be collected from vast sensor networks and used in intelligent algorithms that are deployed in the cloud. However, there are some problems with data transfer when the amount of sensors (and thus the amount of data) increases [1]. The available bandwidth may become a bottleneck for a large sensor network [2] if the sensors share the same network capacity. Fog architectures have been proposed to tackle this problem by, for example, preprocessing the raw sensory data and sending describing values or features over long-range communications. The fog architecture is used in, for example, [5], in which the authors proposed an architecture called a FOG-engine. Their architecture could reduce the data communications overhead and processing time by means of data filtering and cleaning in the fog before transmitting the data to the cloud. The problem with large amounts of sensor data can be alleviated using context-aware filtering. Context-aware filtering of raw sensor data produces different outputs based on the context of the monitored system. Depending on the system conditions, its response and measured behavior have certain expected characteristics. s heart rate oscillates at a higher mean value than that of a sitting person. Recognizing the context enables the identification of expected values and patterns as well as events that do not follow them. In systems where the actions sensed by sensors are repetitive (such as robotic systems supervision, building automation, and medical supervision), most of the data sent by sensors follow
CLOUD ENVIRONMENT Application logic Preprocessed data, Commands
Long range communication
System data
Cloud gateway
Supervising node
CONTEXT-AWARE FOG Yi+1, Np
Y1, Np
Yi, Np Xh, Yh
Fog node 1
X1
X1
Short range communication
Xh, Yh
Fog node i
Sensor 1 Xp Sensor p
Model-based Controller 1
...
System data
Sensor 1 Xp
Actuators
Fog node i+1
Sensor p
Model-based Controller i
Supervising node 1
System data
...
Supervising node k
Actuators
Local dynamic system 1
Local dynamic system i
Environment 1
Environment i
Fig. 1. The proposed architecture contains fog and cloud computing. The black arrows represent data flow; the green arrows represent interaction.
certain patterns. In these cases, only the information about deviations from the expected values can be sent to the cloud, which is done to save bandwidth [6]. The authors in [6] proposed a context-aware filtering logic in a health-monitoring application, showing that the technique can reduce the amount of data sent to a remote server by up to 72%. In [7], a fog architecture was used to process raw sensor data into a more compact form, sending only the cloud data that deviated from the expected values. This way, the data stream only contained values of interest (rather than repetitive sensor readings that could have been substituted by their expected values). Their filtering was based on Kalman filters and modeling the data as a multivariate normal distribution. In this paper, a context-aware filtering algorithm is proposed and evaluated in an experimental setup. An architecture for a fog with such filtering, which is combined with cloud intelligence, is also presented. The system provides local dynamic systems with nearby data preprocessing in which the amount of data sent to the cloud is reduced by sending information about the data and thus event transients. This procedure was designed so that information would not be lost during data reduction and would available for authorized supervising nodes. The filtering algorithm was based on two cases: signal history and device comparison. The experimental setup included the control of a hydraulically actuated 2D motion-capable long-reach flexible manipulator and inertial measurement units (IMUs) attached to the beam. The setup has also been described in [8]. The beam is excited by an external force, causing the vibrations measured by the IMUs. The filter takes this raw data and processes it to create feature maps and event occurrence frequencies.
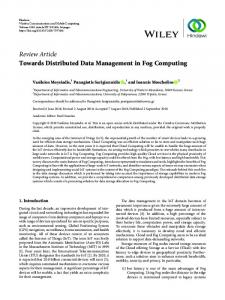
The remainder of this paper is organized as follows. Section II introduces the proposed system architecture at a high level. Section III provides a detailed description of the proposed context-aware communication in the fog. Section IV describes the experimental test setup and results. Section V concludes the present study. II. THE PROPOSED ARCHITECTURE The architectural view of the cloud-based CPS that contains the context-aware filtering fog is presented in Fig. 1. The complete system aims to collect and filter sensory data from local dynamic systems; this is done to enable high-level supervising and data visualization in the cloud. A number of local control systems stabilizing dynamic systems, which interact with their environment, transmit data to nearby fog nodes that are capable of data storing and processing. The fog nodes communicate with the cloud resources, transmitting only data containing information that deviates from the current behavior, which is described in the frequency domain. Thus, events such as a change of context or external disturbances that occur in the dynamic systems are reported to the cloud. The raw sensor data and filtered information can be accessed by supervisory nodes that consist of authorized personnel and applications. Using this architecture in such a cyber-physical system with large amounts of high-frequency data, the amount of data sent over long-range communications can be reduced and its information contents can be retained. The main parts of the architecture are local dynamic systems, the context-aware fog, and the cloud environment.
A. Local dynamic systems As can be seen in Fig. 1, the local dynamic systems contain sensors, model-based controllers, and actuators that operate using short-range communication. Their data-sending components do not have direct access to the cloud but can communicate with the fog using short-range communications. The number of local dynamic systems and the environments they are situated in are denoted by i. The model-based controllers handle low-level control tasks operating on the raw data from the corresponding sensors; each control system is based on the physical model of the controlled system. The controlled system interacts with its environment, which in many cases causes external disturbances to the system. Any such disturbances cause the sensor readings to change, which the context-aware fog can interpret as an unexpected event. As the system experiences changes, they are important to communicate to supervising parts so that the events can be identified and reacted to. B. Context-aware fog In the fog, raw data are stored and filtered in the frequency domain based on algorithms described in Section III. The fog contains nodes that are capable of processing and long-range communication. They determine the information that is sent to the cloud for storing and analytics. While events and their appearance frequency are reported by the fog filters, the raw sensor data are also available to supervising nodes through the fog, enabling a comprehensive investigation of the system behavior. The type of data (raw or event) sent to a supervisor is determined by the needs of the data receiver. For instance, a human supervisor is most likely interested in events and their appearance patterns rather than streams of repetitive data. This is because it can be difficult to distinguish unexpected events from a data series. The filtering of sent data is based on historical data and comparisons to other sensor readings. If an event causes the system to behave in a different way than shown in the historic data, the fog filter notices this as an event. This information is transmitted to the supervisors interested in event and context information. , but the others (which are measuring similar variables in the single proximity) do not, the filter realizes that the sensor reading is faulty; thus, an event has not actually occurred. In such cases, events are not reported. C. Cloud environment The cloud environment contains platforms for data-based intelligence and data visualization. Cloud providers offer a number of data acquisition and computing tools. For example, by selecting a number of virtual machines (VMs) as the computing platform, demanding computing tasks can be allocated and run in parallel with them to achieve fast computing results. The advantage of using both the fog and cloud infrastructure is the ability to have low-latency computing resources available near the local system and scalable, powerful computing infrastructure in the cloud. The data originating from the fog can be received by a cloud gateway, which redirects the data to computing services. The raw sensor data and information filtered from it can be
stored in the cloud for analytics and are accessible to supervising nodes. These nodes are other applications that require data concerning the system condition. The cloud infrastructure can be envisioned to contain web-based displays of the current state of the system. This web-based data presentation can be accessed by authorized personnel for supervisory purposes. The cloud is meant to save data features and feature maps. These tasks have no strict real-time requirements, making it feasible to offload them to the remote cloud server. The cloud application logic can be configured to send signals back to the fog and the local dynamic systems, but a detailed description of such functionalities is out of this study . III. CONTEXT -AWARE COMMUNICATION IN THE FOG As addressed in the first section, there are comprehensive works on compression and reductions in the size of data depending on the context and possibility of applying regression methods to data. However, when it comes to modeling and filtering based on device models, exact modeling narrows the application field to some specific devices. In practice, the network nodes and edges need to be from the same vendor in order to have access to the internal architecture of the machines/robots on the network. Statistical methods for the regression of data in the time domain can be prone to inaccurate outputs due to changes in the order of dynamics or the injection regression (e.g., in Chapter 4 of [9]), in many cases, visual observation of data is necessary to confirm the validity, soundness, and justifiability of any statistical process used for data. In the majority of automated applications, considerable amounts of data transmission over the network consist of measured data, which are from sensors. A good example of this type of sensor is IMUs. They provide signals for angular velocity and acceleration of spatial motions at fast rates. These sensors are capable of data streaming from 200 Hz to 2 KHz. In was 500 Hz. As a common practice, the measurements are subject to noise, and when it comes to IMUs, their signals are influenced by several mechanical and electrical noises and biases. A simple test case can be a machine that has sensor signals sampled at frequency. If we consider that each data sample recording occupies a signed double-precision floating-point number (8 bytes), the required bandwidth becomes bigger than . A realistic test scenario is briefly addressed in Section IV; the scenario is the same as in [8], where the machine has sensor or control signals with a sampling rate of 2 milliseconds (at a 500 Hz frequency). In this case, the baud rate of 1 Mbps is necessary only for the raw data of one set of sensors without consideration of other transmissions. This amount of data generation can cause several challenges in terms of storing, processing, and understanding for supervisory purposes. Since the gathered data are too noisy, the first approach can be the filtering of data with some high-order filters. The other approach is to approximate the signal by some linear transformations or model fittings similar to [7]. However, these approaches do not preserve the data for low-level analysis, and as a result, it is barely possible to debug or diagnose the
system. These systems are also prone to losing informative data in cases of failures. These types of filtering systems can be problematic if they are applied on a large scale. Tuning these filters can be challenging (especially concerning high-influence points), which is regression. On one hand, outlier rejection needs to be considered before any filtering based on the L1- or L2-norm to obtain robustness to outliers. On the other hand, a conservative tuning of filter gains can result in missing a sudden change in inputs, which might be caused by an environmental effect being detected as an outlier. The proposed solution is to add a network fog that transmits the necessary information and detects changes in the frequency domain. The following sections will show the theories and implementation of such a method in the successful identification of necessary information for reporting system functionalities and supervisory actions. 1) Fundamental definitions for filtering in fog To detect features in the frequency domain, common approaches are Fourier or Wavelet transformations. For the purpose of a low process cost, and with less concern about the time domain, we have selected a short-term Fourier series description based on the Fast Fourier Transform (FFT), which, for the data size of , has a complexity order of . The vector of features is defined by the following: (1)
where is the edge node ID and determines the length of historical information provided for the frequency analysis. It should be large enough compared to the Nyquist limits. defines the target window in the data stream, and is as follows: (2) It should be noted that we assumed a constant sampling time for data recording. In the case of asynchronous connections between the sensor and data-collecting devices or variable sampling time (instead of filtering based on FFT), the nonuniform discrete Fourier transform (NDFT) could be used to make the system independent of the fixed sampling time. For the output of FFT , we used its normal value wherever a scalar value is necessary without separation of the imaginary and real components. The vector is the main criterion for analysis of any change in the functionality of the edge device and we will refer to this as the frequency feature. Depending on the network topology and the fog nodes placement, the proposed frequency analysis could be done in one of two directions: or . In the case of the spectrum analysis window being moved by changes in , we could compare the actions of a set of measurement devices. By
changes in , for a single node, we could compare response changes in time. In the following sections, Section 2) describes the use of , and Section 3) explains the use cases for differentedge devices in . 2) Filtering based on signal history and vertical comparison in fog We defined a loss function as an operator between two sets of features and the second norm of their differences by (3)
In the case of any need for a variation of the sensitivities toward a specific range of frequencies, the parameter was adjustable for weight distribution and normalization. In our test cases, we considered equal distribution for the likelihood of changes among all the frequencies; this was done to cover all the effects, including mechanical disturbances (low frequency), noises (high frequency), and defects in the physical layer (discontinuities). Since the sensors were similar, we did not apply any weights for device-specific normalization. It should be noted that the loss function was defined by the norm based on our expectation of mechatronic systems because they have a clearly wide spectrum of frequencies. The test results present the effectiveness of exploiting (3) as a measure of significance for prioritizing the signals for limited bandwidth communications by the generation of semantic feature maps , where (4)
The feature map allows fog nodes to avoid missing frequency features in big data with repetitive actions. The index of will point to the same set of features for the first cycle of running. For the following iterations, it will point to the vectors in the history of that fog node. 3) Filtering based on device comparison and horizontal comparison in fog For a system of sensors, a change in the operation point is expected to appear in many outputs of sensor data. This change can be a result of a command or an external disturbance. Moreover, if a phenomenon is observed in one sensor but not others, it is more likely to be a fault or defect rather than device operation data. On these occasions, access to raw data is beneficial and necessary for debugging and diagnostic purposes. This is an important situation where regressions and filtering can overwrite necessary data. Application of the delta operator for devices of the same environment can be helpful in these situations; (5)
Table 1. Pseudo Code for Implementation in the Fog* Receive the recently arrived series of data. Allocate received data in vectors. Index the samples of data by s. Generate vectors for each set labeled by s. IF first run THEN Create a matrix by the calculated vectors. ENDIF Transmit the matrix as the last record of data. := Calculate the frequency coherence of elements for each vector of . Transmit the most recent matrix of . FOR all values IF THEN Seri indexed by is unique ) = Insert Column ( = Insert Column ( ) = Insert Weight Value ( ) ELSE Seri indexed by is repetitive. j := Find nearest by min in = Add Weight Value ( ) ENDIF ENDFOR Update by values of Transmit Changes in Based on these operators, we can identify the important happenings, and in the case of limitations on process power or storage capacities, we avoid wasting system resources on less important information. This comparison can be made among homogeneous edge devices or heterogeneous sensor devices installed on the same machine or reporting the same motion. 4) Implementation of a feature-based approach in the fog The vectors and comparison basis generated in the previous subsections can be utilized as fog nodes by following the steps is assigned with the addressed in Table 1. Given that recommended number of samples in each interval and is defined as a threshold of sensitivity, these two parameters will directly affect the size of the gathered data and system sensitivity. The process power demand will increase by a rate of and . Beside limitations on storage and should be set such that the process power, the magnitude of length of the signal for the interval can provide enough information about the physical phenomena. Smaller values can have better compression effects. However, in practice, it would barely be possible for an interpreter to extract information from the selected intervals of . Maximum values for s can be defined based on the available system resources. With these
assumptions, we can summarize the implementation phase in accordance with the pseudo code addressed in Table 1. By repeatedly comparing and updating the features table, we have a table that is up to date with the recent information and at the same time can preserve the history of signals, as much as our sensitivity thresholds adjusted for it. The structure can be masked by the required preference. If a supervisory node requests rarely happening events, lower values of weights can show the exceptions, and if it requests frequent events, can be masked by higher values of weights. IV. TESTS AND RESULTS To test the efficacy of the proposed context-aware filtering fog, it was implemented to a setup consisting of a hydraulically actuated long-reach flexible beam, IMU sensors, and a modelbased controller. This setup is seen in Fig. 2. Inertial data, consisting of three-axis acceleration and angular velocity, were collected by the controller, which used the information to control the beam end-point position in the Cartesian space. The beam is actuated by a hydraulic cylinder situated at the base. The 4.5 m long flexible steel beam was modeled using the finite element method, as described by Mäkinen and Mattila in [8]. They concluded that the angular velocity data are more useful for the estimation purposes, and, therefore, for the visualization of signals in this paper, we consider the angular velocity measurements of IMUs. Tests with the setup are usually conducted for control systems, such as in [8], as follows. A force denoted as N is applied to the end point of the beam. As the beam vibrates, the different sensors give different readings. All four sensors measure six vectors of data for 3D acceleration and angular velocity at a rate of 500 Hz. The test idea is to monitor transmitted data within the proposed architecture of the fog by filtering and further analytics. To transfer such high frequency data at low latency, the local sensor data communication takes place using User Datagram Protocol (UDP). The output of analysis has to improve the system functionality for the supervision and monitoring of data. Tests were conducted such that the system carries a payload of 40 kg. While the system is stabilized, we start the test by applying a physical disturbance, which oscillates the entire system. Then, we add more payload. Finally, we apply an artificial communication loss to the system. A successful fog N
IMUs
Fig. 2. The test setup involving four IMUs attached to a flexible beam structure. Force N is applied to the beam end point to cause vibration. Weights are attached to the end point as well.
structure for raw data . The vertical Fig. 3. Output signals of the fog node corresponding to the test platform, and vectors of raw data gathered in axis represents the signal value from the sensors, which in this case are the angular velocities of gyros versus the number of samples. For each signal, besides their corresponding index, the number of their occurrences (w) is mentioned as well as the device ID (p) and the interval index (q) of their first appearance. Different colors can present repetitive signals. In the order of indices, the eve (2) (4) System oscillation during damping period. (5) Applied disturbance to the physical system while the payload was added by 20 kg. (6), (7), and (9) System oscillation during the damping period with the new payload. (8) Artificial failure insertion into the data as a temporary disconnection of the system.
node implementation is expected to preserve data in this cyberphysical test scenario. Fog filtering and analysis were performed on the data to extract information and events that would be sent forward to the cloud. The tests aim to determine the effectiveness of the data reduction and the information loss in the filtering process. 1) Experimental results For the test scenario, the experimental data gathered by the sample fog node appears as presented in Fig. 3. In the figure,
Fig. 4. Individual samples of
each represents the raw data gathered by the sensor, with their occurrence frequency represented by . The steps of the test scenario are fed to the system such that multiple physical happenings have been observed by different sensors. The main goal is to determine any abnormal behavior in the system for structure higher levels. For instance, the index one of the belongs to the stationary condition of the system, which is highlighted as the most frequent happening of the system. As it is visualized in Fig. 4, a cloud application or supervisory node can have access to the state of the physical system, while its
during each step of the test scenario calculated by (4).
Fig. 5. Output signals of the algorithm for different values (vertical axis) at versus different indices of the currently recorded data, a snapshot of the corresponding fog node after running the line 9 of Table 1 for the entire set of data, presented as a heat map. The darkest point belongs for the of the data. artificial failure inserted at
frequent happenings are distinguished and abnormal behaviors are also gathered. structure is created by the algorithm addressed in The Table 1 for each machine containing sensor signals. The algorithm detects changes through the examination of the array presented in Fig. 5, which is also useful for the generation of notifications and a semantic map of sensory data from two viewpoints: historical and among various signals. Without need for transmission of the entire data, the heat map representation of this system in Fig. 5. shows that the signal reports a different behavior and index 8 of shows a single point happening. This point belongs to the artificial failure we generated as a simulation of the communication loss between a sensor and the fog node.
method allows an IoT system to observe highly frequent happenings of the system, such as for energy monitoring purposes. At the same time, monitoring the assets enables fault diagnostics and points out the fault origins. This way, the complete system can adapt to changes in its environment and context while retaining low-capacity long-distance communications, especially for mobile systems. This method can be used to gather informative signals for learning-based artificial intelligence. ACKNOWLEDGMENTS This work has been supported in part by the Doctoral School of Industry Innovations (DSII) of Tampere University of Technology. This work was also supported by the Academy of -based supervision and control REFERENCES [1] IEEE Transactions on Industrial Informatics, vol. 10, no. 4, pp. 2233-2243, 2014. [2] Future Generation Computer Systems, vol. 29, no. 7, pp. 1645-1660, 2013.
At the same time, for lower levels concerning only one matrices are sensor at a time, only online access to local provided. This way, a local observer can have the corresponding information for each physical happening, as addressed in Fig. 4. The titles of each state clarifies the situation of the cyberphysical events applied to this system.
[4]
[5]
The three arrays represented here can provide an external observer with appropriate levels of information based on their information is functionality and requirements. In summary, faster to obtain and can represent historical information for each sensor signal, as shown in Fig. 4. Calculating for the entire set of signals, as in Fig. 5, can summarize the short-term view of the entire system, and signals can be selected based on this array. Finally, as visualized in Fig. 3, any point on this matrix corresponds to the systematically categorized structure of for analysis purposes, such as learning and optimization systems.
-engine: Towards Big Data 2016 IEEE 14th Intl Conf on Dependable, Autonomic and Secure Computing, 14th Intl Conf on Pervasive Intelligence and Computing, 2nd Intl Conf on Big Data Intelligence and Computing and Cyber Science and Technology Congress(DASC/PiCom/DataCom/CyberSciTech), Auckland, 2016.
[6]
-
V. CONCLUSIONS Using context-aware fog filtering and cloud intelligence, there is potential for monitoring and orchestrating distributed control systems in an autonomous way to improve the collective system performance. The proposed method in this paper, instead of filtering data by dismissing its raw values, gathers collections of raw data representing different behaviors of the system. This
[3] IEEE Transactions on Automation Science and Engineering, vol. 12, no. 2, pp. 398-409, 2015. IEEE 2014 Federated Conference on Computer Science and Information Systems (FedCSIS), Warsaw, 2014.
in Sixth Annual IEEE Conference on Pervasive Computing and Communications, Hong Kong, 2008. [7] 2017 IEEE Global Communications Conference, Singapore, 2017. [8]
nertial Sensor-Based State Estimation of Long-Reach FlexibleIEEE International Conference on Robotics, Automation and Mechatronics, Ningbo, 2017.
[9] Chatterjee, Samprit and A. S. Hadi, Regression Analysis By Example, John Wiley & Sons, 2015.