AbstractâEver since its inception VLAN (Virtual Local Area. Network) technology remains a viable tool for logical segmenta- tion and broadcast containment in ...
Finding efficient VLAN topology for better broadcast containment Abdul Hameed , Adnan Noor Mian Department of Computer Science National University of Computer and Emerging Sciences, Lahore, Pakistan { hameed.abdul, adnan.noor }@nu.edu.pk
Abstract—Ever since its inception VLAN (Virtual Local Area Network) technology remains a viable tool for logical segmentation and broadcast containment in switched or bridged networks. For better broadcast containment, Network administrators put those devices together in same VLAN which are expected to exchange more traffic together. Decisions which are not based on traffic statistics may result in inefficient VLAN structure that results in worse network performance. In this research work, the proposed method uses a simple algorithmic approach for creating an efficient VLAN structure for the network. It finds VLAN membership for each node by analyzing current traffic flows of the network. The result is an efficient VLAN topology that could do better broadcast containment hence enhancing overall network performance. The simulation results shows that the proposed approach outperform other heuristics for the same problem. Index Terms—VLANs, VLAN topology, automatic VLAN creation, traffic analysis.
I. I NTRODUCTION Network traffic trends vary from time to time. Advancement in the development and coexistence of various type of network applications results in more dynamic traffic trends. So the statistics of the network traffic need to be refreshed frequently to get an accurate picture of the underlying traffic trends. In such type of dynamic network usage, any system that take decision on the basis of various properties of the network traffic should also be intelligent enough to respond to these varying trends. A VLAN (Virtual Local Area Network) is a logical group of devices or users, grouped by function, department or application irrespective of their physical location on the LAN [1]. The grouping is logical, configured and known only to the participating switches on the LAN. The intention behind VLAN is to logically group users and their resources together in order to minimize local traffic (traffic between group members) leaving outside of the logical group. Broadcast traffic constitute major portion of network traffic that reach every end-system on a shared LAN segment (like Ethernet), whether or not the endsystem is intended to receive such type of traffic. We can say that basic objective of VLAN is to do logical network segmentation in order to provide broadcast containment which was traditionally provided by routers [2][3]. Member devices in a VLAN can directly communicate with other members of the same VLAN only. In order to communicate with devices in another VLAN, a router is required to route traffic between
VLANs, just like router providing routing between multiple LAN segments. The structure of a VLAN not necessarily have to follow the structure of the organization, but should be based on the flow of traffic information of the network [4] which is more likely to be true for VLANs deployed solely for the purpose of broadcast containment. For such networks, VLAN topology is manually decided by network administrators often using the 80/20 rule. According to this rule VLAN topology should be designed in such a way where 80% of traffic should be kept local to the VLAN and only 20% should be routed. But such type of static and manual approach for VLAN structure creation lacks information about actual traffic flows information of the network. This type of decision making is inefficient because of two reasons. 1) VLAN members, either users or devices may not have 80/20 traffic distribution in first place as anticipated by network administrator. 2) If 80/20 rule holds true for all VLAN members, then traffic flows could not be kept constant as emerging realtime and multimedia network applications change the traffic trends over time. As a result, VLAN structure needs to be reviewed constantly to keep the structure up to date as per traffic trends [4]. Such situation imposes two main constraints on VLAN structure creation decision. First, we should know statistics of traffic flows of the underling network and second the structure creation method should be automated instead of doing manually. In this context we proposed an algorithm which takes traffic statistics as an input and suggest VLAN topology. The proposed method does not dynamically configure the network, rather it simply suggest changes in the VLAN topology which can be later implemented by network administrator. The proposed algorithm can be used in network tools that assist network administrators in deciding an efficient VLAN topology for the network. In such tools, either the network traffic statistics will be precalculated or calculated directly from live traffic. In either case, the method will find efficient VLAN membership for each device or node. The scope is not limited to these network tools. The algorithm could be integrated with existing VLAN propagation and management platform like VMPS [5] and Open VMPS [6]. VLAN Management Policy Server(VMPS) is cisco proprietary network service used for
registering and querying VLAN related information of network devices. Open VMPS is non-proprietary open source version of VMPS functionality. More over the algorithm could be used with OpenFlow [7][8] for configuring all network switches of the newly created VLAN topology. OpenFlow is a new flow based framework used for creating control plane for switches. [9] provides further detail on OpenFlow. The rest of the paper is organized as follows. Section II provides the necessary background and a brief literature study of the problem. The proposed algorithm is presented in Section III. Section IV describes our experimentation setup. Section V discuss the results obtained. In Section VI paper is concluded and future work is discussed. II. BACKGROUND AND R ELATED W ORK The problem finding an efficient VLAN topology for a network is a type of Network Division Problem (NDP) which is NP-complete [10]. To the best of our knowledge there are few heuristic approaches for finding efficient VLAN topology. Some research view the problem as part of complete network optimization while others divide the problem into parts like optimum Root Bridge, Designated Router selection and the topology definition and propose heuristics for each part. Our focus is on heuristic approaches in which input is a matrix of traffic information exchanged between network nodes, called the traffic matrix and output is the VLAN topology. The recent heuristic approaches which solve the problem as part of the overall network optimization include [11] [12] [13]. These are semi-manual model based approaches where different VLAN management tasks are modelled mathematically and assigned some cost. The model is optimized to determine the best strategy or plan for VLAN deployment and management. The plan is implemented manually by the network operators. The problem with these approaches is that an interaction is required with network administrators to determine the cost of each activity. Marcello et al. [14] devised an algorithm called the partitioning algorithm (PA) which uses graphs to solve this problem. The algorithm constructs a graph from the observed traffic. The algorithm builds a tree and find largest groups by means of recursive function. Each of these groups is a candidate for a separate VLAN. Problem with this partitioning algorithm is that a node can be part of more than one group. When a node is in more than one VLAN, then traffic to and from that node should be forwarded to the respective VLANs. This reverse the benefit of VLANs. We termed this phenomena as group collision. Group collision should always be avoided for getting a good VLAN topology. Peltsverger et al., [4] also solve this problem by using a graph based technique. They first create an n × n adjacency matrix from traffic matrix. Any value greater than zero in traffic matrix result 1 in adjacency matrix. A graph is then constructed from adjacency matrix. Nodes i and j has an edge in the graph if adjacency matrix has a value of 1 either in (i, j) or (j, i) cell. The algorithm then optimally decompose the graph into subgraphs by finding strong components in the
graph. Information about strong components of directed graph can be found in [15]. Each sub graph is a candidate for a separate VLAN. Problem with Peltsverger’s technique is the calculation of adjacency matrix from traffic matrix. In normal network activity, nodes which are not candidate for group membership of same VLAN, still results in small values in traffic matrix. This causes Peltsverger’s technique resulting in a graph which is strongly connected. Such a graph has single strong component containing all nodes. In other words the algorithm fails to find a good VLAN membership for each node. Sean Rooney et al. [16] propose a greedy approach pairing nodes which exchange more traffic with each other. A group is merged with another group if its cumulative traffic to the target group is greater than traffic to other groups in the solution. The merging process continues until the group size constraint is reached or no groups are left for merging. The problem with this technique is the group collision problem. There may be nodes which may have membership to more than one VLANs. Another problem with Sean Rooney’s technique is that nodes which do not get into their appropriate groups because the target groups have reached their maximum size, are placed in non-optimum groups. In such case the node is in one VLAN while its major traffic destination is in another VLAN causing more traffic to be routed. The proposed algorithm called Simple Set-based (SS) algorithm completely operate on traffic matrix. A matrix containing traffic values between pairs of nodes is calculated either offline from traffic traces or online from the live network. Each cell (i, j) of the matrix represent the total amount of traffic exchanged from Node(i) to Node(j). For each node, it process the corresponding row of the matrix and finds an appropriate VLAN group for it, considering its traffic with all members of the matrix. The algorithm is very simple and computationally less expensive than other types of algorithms. The reason for this is that the proposed algorithm avoid constructing graphs and doing complex tree operations like the graph based techniques do. III. T HE S IMPLE S ET- BASED (SS) ALGORITHM The proposed algorithm for finding VLAN topology is given in Algorithm 1. Table I provides a short description of the terms used in this algorithm. We named our algorithm a Simple Set-based (SS) algorithm because it totaly operate on sets. It extracts a set of traffic values from the traffic matrix for each node and then looks for best VLAN membership where InterVLAN traffic is minimized. The output of the algorithm is also a collection of sets each potentially representing a VLAN group. If members of the set are placed in the same VLAN in the real network, the overall network performance will be greatly enhanced. Before running the algorithm, we need the computed traffic matrix for the list of nodes for which VLAN membership has to be found. Initially the system has no predefined sets as they are to be decided on the bases of nodes grouping. To avoid group collision, the algorithm make sure that each node is
TABLE I T ERMINOLOGY USED IN SS ALGORITHM .
Term Node List Traffic MAP Traffic Matrix ith node Threshold θ Tight Couple Node Gain Factor Flow Table
Description List of nodes in the network. A mapping between the node’s ID and its total transmitted traffic. A matrix containing traffic values exchanged between each pair of nodes. The node in consideration for the current Iteration of the algorithm. A threshold value which ensure that members have some traffic sent to ith node. Node 1 tight couple is Node 2 iff Node 1 sent half or more of its traffic to N2 An indication of improvement in terms of decrease in inter-group traffic caused by the movement of Tightly Coupled nodes to another set. A temporary two dimensional table containing the Node ID and traffic to and from, to the ith node.
placed in the most appropriate set considering its traffic with other nodes. In step 1 (line 2) of proposed algorithm, we just fill the Node List. Node List is an array of nodes in our problem. Step 2 (line 3) is simply a loop which iterate for each node in Node List selecting current node as an ith node. For ith node VLAN membership has to be found in the current iteration of the main loop. In Step 3 (line 4-6), we check if the ith node is in multiple sets? If YES, leave it in the set having larger traffic to its members in both directions and remove it from other sets. Traffic in both direction means that the ith node is either the source or destination of major traffic for the set members. We termed this step as conflict resolution step as it resolve the membership of the ith node among multiple sets. While moving ith node from one set to another, Tight Couple node of ith node is moved only if Gain Factor can be improved by this movement. Tight Couple node of ith node is a node to which ith node sent half or more of its traffic. Gain Factor is an indication of improvement in terms of decrease in InterVLAN traffic. This improvement is caused by moving the ith node’s Tight Couple node from a set to ith node’s final set. After this step we are sure that ith node is only in one set. Step 4 (line 7-27) focuses on the current set of the ith node to make sure that leaving ith node in this set will result in efficient VLAN membership. We first check whether ith node has its major traffic (50% or more) to the set members. If YES, leave ith node in the current set and proceed to the next step. If the ith node do not have major traffic with its current set’s members, we make a check that half of the set members should have at least some portion of their traffic to the ith node. This criteria is identified by the threshold θ. By default this variable is set to 10%. If algorithm in Step 4 does not finds ith node in any set then it is moved to its Tight Couple node’s set if it is already in some set. Otherwise it is placed in a new empty set. Up to now SS algorithm has placed ith node in the appropriate set (VLAN). Now the algorithm tries to put all those nodes in the set with ith node with which ith node exchanges θ% or more traffic. Step 5 (line 28) of the algorithm select values from Traffic Matrix starting from j=i+1 ... End, of the ith row & ith
Algorithm 1: The Simple Set-based Algorithm Input: Node List,Traffic Map, and Traffic Matrix Output: Group of Sets 1 begin 2 Arrange the nodes in the Node List. 3
For each element of the Node List, select the ith Node.
4
if the ith Node is in multiple sets then
5
Put it in the set having more traffic to its members in both directions. Move tightly couple node (ith node sent half or more traffic to it) of the ith node only iff the Gain Factor improves (decrease in inter-group traffic caused by the movement of tightly coupled node).
6
end
7
if ith Node is in one set then if ith Node have 50% traffic to the set members OR half of set members have at least θ% Traffic to it then
8 9
Leave it in the set
10 11
else if ith Node’s Tight Couple (ith node sent half or more traffic to it) node in some set then
12
Move to that set
13 14 15
else Create a new set for the ith Node end
16
end
17 18
end end
19 20
else if ith Node’s Tight Couple (ith node sent half or more traffic to it) node in some set then
21
Move to that set
22 23 24
else Create a new set for the ith Node end
25
end
26
end
27
end
28
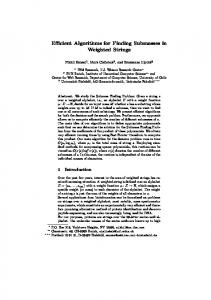
Select sub arrays [j=i+1 .. end] of the ith row & ith column of Traffic Matrix and put in Flow Table. Sort the Flow Table by the ith row values in DESC order.
29
Select the j th node to be a group member of ith node if either value of corresponding node’s row of the Flow Table is at least Θ%.
30
Repeat step (3)
31 end
column. We put these values in the Flow Table and Sort the table records by the ith row value in descending order. Step 6 (line 29) select all those nodes to become group
0 0 1 2 3 4 5
1
2
3
4
5
0
19
98
52
47
21
32
0
52
66
82
332 151
187
25
0
84
34
6
87
14
0
54
78
80
78
54
2
0
1
84
41
9
248
44
0
(a) ith Row & ith Column Selection
2 3 4 5
th i Row
th i Col
52
25
66
87
82
78
332
41
th i Row 5 4 3 2
(b) Flow Table Before Sorting Fig. 1.
th i Col
332
41
82
78
66
87
52
25
(c) Flow Table After Sorting
Flow Table selection in Algorithm step 5
end time of the connection etc. This simulation profile is then used to setup respective applications of the simulation. To model a real world network environment and to make sure that each run of the simulation perform different network activities, application simulation profile is randomly initialized for each run. Flows for each run of the simulation is different from others resulting in a fully dynamic network condition. To evaluate the usefulness of our algorithm, it is compared with three other algorithms for the same problem. These algorithms are Marcelleo Partitioning Algorithm(PA) [14] (called PAMarcelleo) , Peltsverger [4] Algorithm and Sean Rooney [16] Algorithm (called SRooney). In each run of the simulation the mentioned algorithms with the proposed algorithm is applied on the same traffic matrix. Each algorithm yields a VLAN topology. Three parameters i.e. total traffic, InterVLAN traffic and Intra-VLAN traffic is calculated and stored for each run. The said calculated parameters for all runs are then plotted. These parameters are discussed in detail in the Section V. V. R ESULTS AND D ISCUSSION
member of the ith node if either value of the corresponding row for the node in Flow Table is equal or greater the θ% value. To explain Step 5 & 6 with help of an example, assume a six nodes topology. The traffic matrix is 6 × 6 matrix having indices from 0 to 5. when i=1 step 5 of the algorithm select values from row 1 and column 1 starting from index 2 to 5 (j=i+1.... 5). The selection of this row and column is highlighted in traffic matrix shown in figure 1(a). The selected values of ith row of traffic matrix is placed in column 1 of flow table. ith column values of traffic matrix become column 2 of flow table. This flow table is shown in figure 1(b). Column 1 of flow table contain traffic values sent by ith node to the node identified by label shown on the right side of the table. Column 2 of the flow table are traffic received by ith node. Flow table shown in figure 1(b) is sorted in descending order by column 1. The resulting table is shown in figure 1(c). Values enclosed by brackets in figure 1(c) lies in the θ% threshold so node 5 and 4 are place in the same group with the ith node.
Inter-VLAN traffic is the traffic generated by a source in one VLAN and who’s destination resides in another VLAN. This traffic needs to be routed. For Intra-VLAN both the source and destination is in the same VLAN. An efficient VLAN topology is one which minimizes Inter-VLAN traffic and maximizes Intra-VLAN traffic. For calculation of three comparison parameters from traffic matrix i.e total traffic, Inter-VLAN traffic and Intra-VLAN traffic, let aij is traffic from node i to j in traffic matrix. Let n is the number of nodes in VLAN v and total traffic of v is represented by Γ(v) and is given as follows,
Γ (v) =
n n X X
aij
(1)
i=1 j=1
Let Intra-VLAN traffic is represented by variable α then α(v) for VLAN v is given by equation 2.
α(v) =
n n X X
(aij + aji )
(2)
i=1 j=i+1
IV. E XPERIMENTATION OF S IMPLE S ET- BASED A LGORITHM To ensure that traffic matrix is generated from network activities, we use Network Simulator 2 (NS2) [17]. In our simulation, we run seven different types of applications on the LAN nodes namely File Transfer, Web applications, Multicast Group Applications, ICMP, Telnet and Network Scanning and point to point Voice Streaming application. Table II shows the nodes on which these applications run and the nodes involved in their sessions. At the start of each simulation we create a file called Application Simulation Profile. This file contain a separate data section for each of the seven simulated application. Each section contains information about nodes which are involved in the application’s session, the start and
A partitioning algorithms may place a node in more than one VLANs like the groups selected in figure 2 of Marcelleo et al [14] . This is possible as a node may have some portion of its traffic to nodes residing in different VLANs. On the basis of this, the algorithm may group it with members of those respective VLANs. If a node is member of more than one VLAN, then all traffic to and from that node must be forwarded to all respective VLANs. Let i and j are two members of VLAN v and j also have membership to another 0 VLAN v . If i send traffic aij to node j, then traffic aij should be deducted from Intra-VLAN traffic of VLAN v as this traffic 0 has to be routed to a different VLAN v . If qi is the number of VLANs in which node i is a member, then to calculate α correctly in situation where a partitioning algorithm could
TABLE II A PPLICATION L IST Application
From Node
File Transfer (FTP)
Random Clients
WEB (HTTP)
Random Clients
Multicast
Members are randomly chosen
ICMP Telnet Net Scan Voice Application
Random nodes Random nodes Random nodes A random node
To Node N6 N7 N8 N3 Mcast gr1 Mcast gr2 Mcast gr3 Random nodes Random nodes Entire Network A random node
Description N6 is File Server, Random Total Connections N7 is File Server, Random Total Connections N8 is File Server, Random Total Connections N3 is WEB Server, Random total clients ,page size,request interval & age Multicast Group communication, Random Group size Some random nodes ping some other random nodes Some Random nodes establish Remote Telent Sessions Some Random nodes Scan the entire Network A Point-2-Point Voice Streaming session between two randomly selected nodes
SSAlgo
result in multiple VLAN membership for a node, we modify equation 2 as shown in equation 3 . α(v) =
n n X X
PAMarcelleo
Peltseverger
SRooney
73
97
100
80
[(aij − aij (qj − 1)) + (aji − aji (qi − 1))]
i=1 j=i+1
=
n n X X
60
[aij (1 − (qj − 1)) + aji (1 − (qi − 1))]
i=1 j=i+1
=
n n X X
%β (3)
40
[aij (1 − qj + 1) + aji (1 − qi + 1)]
i=1 j=i+1
=
n n X X
20
[aij (2 − qj ) + aji (2 − qi )]
i=1 j=i+1
Item aij (qj −1) in equation 3 yield zero if node j is member of only one VLAN i.e qj = 1. In this case equation 3 and equation 2 becomes equal. Let β(v) represents Inter-VLAN traffic for VLAN v then β(v) is equal to total traffic less Intra-VLAN traffic. So from Equation 1 and 3, we have
0 1
Fig. 2.
Inter-VLAN Traffic Percentage
200 n n X X
[aij (2 − qj ) + aji (2 − qi )]
(4)
i=1 j=i+1
Equation 1, 3 and 4 are used to calculate Γ, α and β respectively for each VLAN from the traffic matrix. For calculating these parameters for entire LAN, the sum of these values for all VLANs are calculated and stored in each simulation run. The simulation is run for 100 times. In each run of the simulation, Γ, α and β is calculated and stored for each algorithm on the basis of their output VLAN topology. Mean β with ±95% confidence interval for 100 runs is also calculated for each of the algorithm. Figure 2 shows the comparison of β (Inter-VLAN) traffic for each algorithm. X-axis of the plot shows run number and yaxis shows %β (Inter-VLAN traffic percentage). By %β traffic we mean the percentage of total traffic that needs to be routed between different VLANs and is calculated as Γβ ∗ 100. Figure 2 shows that proposed algorithm yield a VLAN topology in each simulation run that minimizes %β traffic. Solid (red) line at the bottom of the chart shows that SS algorithm perform better than other three algorithms. For Inter-VLAN traffic percentage, the proposed algorithm results with a smaller mean value of 4.98% for 100 runs of the simulation. The mean %β is shown in Figure 3. Compressed error bar for our algorithm shows that Inter-VLAN traffic vary close around the mean
150
%β
i=1 j=1
aij −
Mean
n n X X
49
Simulation Run
β(v) = Γ(v) − α(v) =
25
98.0329
100
82.4221
80.3904
50 4.9804 0 SSAlgo
Fig. 3.
PAMarcelleo
Peltseverger
SRooney
Mean Inter-VLAN Traffic with ±95% Confidence Interval
value for all runs. This is evident in comparison with other algorithm which results in a larger mean value and longer error bar. Percentage of Intra-VLAN traffic is plotted in Figure 4. Percent Intra-VLAN traffic i.e %α refers to the percentage of total traffic of network that is contained within the VLAN groups. Again x-axis of the graph shows simulation run number and y-axis shows %α. Our SS algorithm proposed an
SSAlgo
PAMarcelleo
Peltseverger
SRooney
100
80
60
%α 40
20
0 1
25
49
73
97
Fig. 5.
Model for Dynamic Configuration of VLANs
Simulation Run
Fig. 4.
Intra-VLAN Traffic Percentage
efficient VLAN topology that maximize traffic inside VLAN group in each run. This is shown by the upper solid (red) line of figure 4 that stay high in almost all of the simulation runs. The reason for large difference in the performance of the proposed algorithm compare to others is because of two reasons; placement of each node in the most appropriate group considering its traffic with other nodes and the avoidance of multiple VLAN membership or group collision. Nodes exchanging larger traffic with each other get closer and become members of the same VLAN. So much of the traffic is localized which results in high Intra-VLAN and lower InterVLAN traffic values. VI. C ONCLUSION AND F UTURE W ORK In this research work we proposed an algorithm for defining an efficient VLAN topology for the LAN. The proposed algorithm, called Simple Set-based (SS) algorithm finds VLAN membership for each node based on its traffic flows in the network. We verify the usefulness of the our algorithm through simulations. Our simulation results show that the proposed algorithm perform better than other three algorithms for the same problem. The SS algorithm place nodes that exchange more traffic with each other in the same group thus maximizing traffic inside a VLAN and minimizes traffic crossing the VLAN. At the same time it ensures that a node is only member of a single VLAN to avoid group collision. In future we are planning to design a system for automatically configuring and dynamically changing VLANs that are primely used for broadcast containment. The idea is to couple VLAN partitioning algorithm (e.g. SS algorithm ) with existing VLAN configuration and announcement service. This process is shown with an abstract model in Figure 5. The system first capture network traffic and analyze it to produce the required statistics. There is a ref reshing criteria which determine when to update the VLAN topology. When the refreshing interval is reached, the partitioning algorithm finds new VLAN topology. This newly created topology is
then configured across the network switches by the VLAN configuration module. With this extension, we will have a VLAN administration system, that analyze online traffic flows and adopt the VLAN structure according to current traffic trends. Any major changes in the traffic trends will be observed by the system and the newly proposed topology would be automatically announced and configured in the network. R EFERENCES [1] IEEE, “Draft standard p802.1q/d11 IEEE standards for local and metropolitan area networks: Virtual bridged local area networks.” [2] “Systems and methods for isolating faults in computer networks,” United State Patents number: 7103807, September 2006. [3] X. Wang, H. Zhao, M. Guan, C. Guo, and J. Wang, “Research and implementation of vlan based on service,” in Global Telecommunications Conference (GLOBECOM), vol. 5, pp. 2932 – 2936, December 2003. [4] S.Peltsverger and C.McKenney, “Students research in dynamic VLAN configuration,” in InfoSecCD Conference’08, (Kennesaw, GA), September 2008. [5] “Troubleshooting the Catalyst VMPS Switch,” tech. rep., Cisco Systems,, August 2005. Document ID:23797. [6] “Openvmps source page.” http://vmps.sourceforge.net/. [7] N. McKeown, T. Anderson, H. Balakrishnan, G. M. Parulkar, L. L. Peterson, J. Rexford, S. Shenker, and J. S. Turner, “Openflow: enabling innovation in campus networks,” Computer Communication Review, vol. 38, no. 2, pp. 69–74, 2008. [8] A. Bianco, R. Birke, L. Giraudo, and M. Palacin, “Openflow switching: Data plane performance,” in ICC, pp. 1–5, IEEE, 2010. [9] S. J. Vaughan-Nichols, “Openflow: The next generation of the network,” IEEE Computer, vol. 44, no. 8, pp. 13–15, 2011. [10] M. R. Garey and D. S. Johnson, Computers and Intractibility, A Guide to the Theory of NP-Completeness. 1979. [11] X. Sun and S. G. Rao, “A cost-benefit framework for judicious enterprise network redesign,” in INFOCOM, pp. 221–225, IEEE, 2011. [12] Y.-W. E. Sung, S. G. Rao, G. G. Xie, and D. A. Maltz, “Towards systematic design of enterprise networks,” in CoNEXT, p. 22, ACM, 2008. [13] X. Sun, Y.-W. E. Sung, S. Krothapalli, and S. G. Rao, “A systematic approach for evolving VLAN designs,” in INFOCOM, pp. 1451–1459, IEEE, 2010. [14] M. Esposito, A. Pescape, and G. Ventre, “An efficient approach to the network division problem, VLANs configuration and WLANs hosts grouping,” in Local and Metropolitan Area Networks, 2004. LANMAN 2004. The 13th IEEE Workshop on, pp. 241–246, 2004. [15] R. Diestel, Graph Theory. Springer, fourth ed., 2010. [16] S. Rooney, C. H¨ortnagl, and J. Krause, “Automatic VLAN creation based on on-line measurement,” Computer Communication Review, vol. 29, no. 3, pp. 50–57, 1999. [17] CiteSeerX, “Virginia tech . ECE 5984: Network performance, design, and management . spring 2002 beginner’s guide to ns2 – installation and basic usage,” Feb. 03 2009.