ORIGINAL RESEARCH ARTICLE published: 17 October 2013 doi: 10.3389/fpsyg.2013.00684
Fine-grained temporal coding of visually-similar categories in the ventral visual pathway and prefrontal cortex Yang Xu 1,2* † , Christopher D’Lauro 3* † , John A. Pyles 2,4 , Robert E. Kass 1,2,5 and Michael J. Tarr 2,4 1 2 3 4 5
Machine Learning Department, Carnegie Mellon University, Pittsburgh, PA, USA Center for The Neural Basis of Cognition, Carnegie Mellon University, Pittsburgh, PA, USA Department of Behavioral Sciences and Leadership, United States Air Force Academy, CO, USA Department of Psychology, Carnegie Mellon University, Pittsburgh, PA, USA Department of Statistics, Carnegie Mellon University, Pittsburgh, PA, USA
Edited by: Thomas Serre, Brown University, USA Reviewed by: Sébastien M. Crouzet, Charité University Medicine, Germany Thomas A. Carlson, Macquarie University, Australia *Correspondence: Yang Xu, Machine Learning Department, Carnegie Mellon University, 5000 Forbes Avenue, Pittsburgh, PA 15232, USA e-mail:
[email protected]; Christopher D’Lauro, Department of Behavioral Sciences and Leadership, United States Air Force Academy, 2354 Fairchild Drive, Suite 6L-101, CO 80840, USA e-mail: christopher.dlauro@ gmail.com † These authors have contributed equally to this work.
Humans are remarkably proficient at categorizing visually-similar objects. To better understand the cortical basis of this categorization process, we used magnetoencephalography (MEG) to record neural activity while participants learned–with feedback–to discriminate two highly-similar, novel visual categories. We hypothesized that although prefrontal regions would mediate early category learning, this role would diminish with increasing category familiarity and that regions within the ventral visual pathway would come to play a more prominent role in encoding category-relevant information as learning progressed. Early in learning we observed some degree of categorical discriminability and predictability in both prefrontal cortex and the ventral visual pathway. Predictability improved significantly above chance in the ventral visual pathway over the course of learning with the left inferior temporal and fusiform gyri showing the greatest improvement in predictability between 150 and 250 ms (M200) during category learning. In contrast, there was no comparable increase in discriminability in prefrontal cortex with the only significant post-learning effect being a decrease in predictability in the inferior frontal gyrus between 250 and 350 ms (M300). Thus, the ventral visual pathway appears to encode learned visual categories over the long term. At the same time these results add to our understanding of the cortical origins of previously reported signature temporal components associated with perceptual learning. Keywords: visual category learning, categorization, ventral visual pathway, prefrontal cortex, cortical time course, decoding, MEG, human neuroscience
1. INTRODUCTION Objects from visually-similar categories can be difficult to distinguish, but human observers can make accurate category judgments within a fraction of a second, a visual skill that is perfected by learning and experience (Gauthier et al., 2009). Beyond the case of face individuation where each category is mapped to an identity, the more general ability to assign categories to visually-similar objects has important consequences in our natural environment. For example, distinguishing between ripe or poisonous berries, wet or icy roads, or Retrievers or Rottweilers, all necessitate placing one collection of visually-similar objects into a common category, yet keeping that category distinct from another collection of objects that are not only similar to one another, but to the objects in the first category. This sort of categorization is often referred to as “subordinate” to differentiate from “basic-level” categorization in which there are significant visual differences supporting placing objects into one category or another (e.g., pigs vs. airplanes). Moreover, it is often assumed that subordinate-level categorical decisions will incur a larger cost in response time as compared to basic-level categorical decisions–indeed, this functional definition is often used to ascertain whether a given category is considered basic or subordinate (Rosch et al., 1976). At the same time, this
www.frontiersin.org
response time differential can be minimized through experience in that visual “experts” exhibit an entry-level shift whereby subordinate categorization for domains of interest becomes just as fast as basic-level categorization (Jolicoeur et al., 1984; Tanaka and Taylor, 1991). For example, for bird experts, distinguishing between different species of birds, all nominally members of the same basic-level category, is likely to be just as fast as in telling a bird from a chair. Thus, we can view becoming proficient at categorizing visually-similar objects as an instance of perceptual expertise with subordinate category discriminations. While it is understood that both the ventral occipito-temporal visual cortex, in particular the ventral visual pathway (VVP), and the prefrontal cortex (PFC) are involved in such visual categorization tasks, there is no strong consensus on the relative roles of these neural substrates. Moreover, once specific subordinatelevel categorization proficiency has been acquired, there is still a poor understanding of the precise timing of the contributions of the VVP and PFC during the on-line discrimination of visually-similar objects. To better characterize the roles of the VVP and PFC in the categorization process, we use magnetoencephalography (MEG) to unravel the cortical time course in visual category learning in order to evaluate two prominent, yet competing, theories.
October 2013 | Volume 4 | Article 684 | 1
Xu et al.
The first approach, which we refer to as the “dominant PFC viewpoint,” emphasizes the role of prefrontal cortex (PFC) in categorization and proposes the VVP to be sensitive to visual feature differences but agnostic as to category memberships (Jiang et al., 2007; Seger and Miller, 2010). For example, Jiang and colleagues (2007) found that categorization training induces category-level changes in lateral PFC but only continuous shape-level changes in lateral occipital cortex (LOC). Related work in non-human primates likewise suggests a similar distinction between PFC and inferiortemporal cortical neurons (Miller et al., 2002; Freedman et al., 2003; Meyers et al., 2008). These and other data paint a picture of PFC as the neural substrate supporting category learning and the VVP as the neural substrate providing the undifferentiated (with respect to category) perceptual input that the category-knowledgeable PFC utilizes. An alternative approach, which we will refer to as the “complementary PFC viewpoint,” suggests that the VVP and PFC play complementary roles in categorization (Mishkin et al., 1983; Goodale et al., 1994; Ungerleider and Haxby, 1994; Bar et al., 2005; Folstein et al., 2012a). Under this view, the VVP exhibits category boundary sensitivity (Sigala and Logothetis, 2002; de Baene et al., 2008) and the PFC provides early top-down categorical inferences that facilitate initial learning of category-relevant feature dimensions (Fenske et al., 2006). Learning and reinforcement progressively instantiate these stimulus dimensions within the VVP; that is, the VVP becomes increasingly sensitive to learned category boundaries as the high-dimensional stimulus space is mapped. This is clearly seen in fMRI for highly overlearned, “expert” domains in which the VVP shows spatially localized, differential responses to subordinate-level categories such faces (Kanwisher et al., 1997), novel objects (Gauthier et al., 1999; Op de Beeck et al., 2006), birds and cars (Gauthier et al., 2000). Similarly, event-related potential (ERP) has consistently revealed category sensitivity in the VVP-sourced N170 component (Tanaka and Curran, 2001) and, in several studies of visual expertise, has been localized to posterior occipito-temporal areas (Rossion et al., 2003). Again, as with the fMRI results, this category sensitivity for domains of expertise has been found for both real world (Tanaka and Curran, 2001) and lab-trained experts (Scott et al., 2006). Some of the discrepancies between results supporting these two approaches may be accounted for by differences in stimulusmorphing procedures used in different experiments. In particular, research supporting a dominant PFC view has typically used a more difficult to learn type of morph space (i.e., blended morphspace). In contrast, research supporting the complementary PFC view has typically relied on a grid morph space (for a thorough consideration of the topic, see Folstein et al., 2012a). This raises the possibility that morphing procedures are actually driving the apparent differences in the role of the PFC for these experiments: the extremely difficult morphspaces require more PFC intervention for participants to map category boundaries, which in turn supports a dominant PFC viewpoint, while the more comprehensible morphspace experiments find that VVP areas are capable of instantiating category boundaries in and of themselves, supporting a complementary PFC viewpoint. As such, perceptually homogenous subordinate categories that have
Frontiers in Psychology | Perception Science
Temporal coding of visually-similar categories with MEG
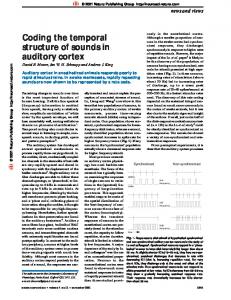
clear decision boundaries, may serve as an ideal test for comparing these views of the PFC’s role in categorization. In our experimental paradigm, category membership is never as indeterminate as it would be in the blended morphspace seen in dominant PFC studies, but accurate categorization is still challenging, due to the subtle differences in category features. This design retains the difficulty of blended morphspaces with the predictability of grid morphspaces. Thus, this experiment has the potential to resolve some of the reported differences between the two approaches on the magnitude of the role that VVP plays in the context of subordinate categorization. To evaluate both approaches, we studied human cortical activity while participants learned to discriminate between two novel and highly-similar visual categories. We hypothesized that although both the VVP and PFC would be involved in the categorization process, their roles would differ during different phases of learning, which is more consistent with a VVP-PFC complementary viewpoint. More specifically, we predicted that the VVP would acquire categorical representation as learning progressed to the point where the category boundaries are better distinguished by participants. In contrast, we predicted that PFC would play a more significant role in category encoding in the initial phases of learning, during the early formation of categorical representations, but that this role would diminish later in learning. With respect to these predictions, the differential roles of the VVP and PFC have been explored by Bar et al. (2005), who found, in a visual recognition task that PFC responses both temporally preceded those in the VVP and were more sensitive to low spatial frequencies. They hypothesized that PFC may be involved in providing early inferences regarding object identities that are subsequently refined by further visual processing within the VVP. Our predictions are related to this hypothesis, but are critically different in two important aspects. First, we focused on categorization instead of individual object recognition—it remains unclear whether the VVP and PFC both play a role in discriminating between visually-similar categories. Second, we investigated the change in response for the VVP and PFC over the course of category learning as opposed to investigating only the end point of learning. In particular, this latter manipulation allowed us to monitor how neural coding of categories change over time, which should offer a better means for better elucidating the functional roles of both PFC and the VVP. To pursue these goals, we created two novel, visually-similar shape categories inspired by the stimuli used by Krigolson and colleagues (2009). Figure 1A illustrates the stimulus image space, showing five samples from each of the two categories. Each of these blob-like exemplars is unique and represents a jittered version derived from one of the two prototypes located at the center of the space of samples forming each category. Although these exemplars are perceptually similar with small differences in the edge contours, a distinct category boundary is embedded in the overall space, as illustrated by two distinct clusters shown in Figure 1B. Participants were trained to discriminate between these two “blob” categories in a feedback-driven categorization task in which we monitored neural activity using MEG. At a fine temporal scale, MEG’s millisecond temporal resolution afforded us the ability to investigate how different cortical regions embed
October 2013 | Volume 4 | Article 684 | 2
Xu et al.
Temporal coding of visually-similar categories with MEG
A
Samples of A-blob
C
Principal dimension 2
90 80
A−blob B−blob
70 60 50 20
40 60 80 Principal dimension 1
100
Cumulative variability (%)
B
Samples of B−blob
D 0.1
100
Edge weight
80
0.05
60 0 40 −0.05
20 0 0
5
10 15 Dimension
20
−0.1 −0.1
−0.05
0
0.05
0.1
FIGURE 1 | Visual stimulus design. (A) Blob samples from A and B categories. (B) Projection of A and B blobs in two principal dimensions via principal components analysis. (C) Cumulative variability accounted for in the principal dimensions. (D) Normalized edge weights from the first principal dimension.
discriminative information about the blob categories over time. At a coarser temporal scale, we were able to explore how the encoding of this category information evolves during the course of learning, particularly with respect to categorical representations in the ventral and occipito-temporal visual and prefrontal cortices.
2. MATERIALS AND METHODS 2.1. ETHICS STATEMENT
All experimental procedures were approved by the Institutional Review Boards at Carnegie Mellon University and the University of Pittsburgh. All participants gave written informed consent and were compensated financially for their participation. 2.2. PARTICIPANTS
Ten right-handed participants (4 females and 6 males) aged between 17 and 35, recruited from the Pittsburgh area, were run in the experiment. Participants were financially compensated for their participation. Two of the participants ran in experimental sessions in which trigger failures meant that the timing of individual trials could not be retrieved, so the data for these two participants was discarded. One participant was unable to correctly learn the blob category boundaries, exhibiting near-chance categorization accuracy throughout the experimental session, so the data for this participant was likewise discarded. Thus, the results reported here are based on the remaining seven participants. 2.3. STIMULUS DESIGN
The visual stimuli were generated from two novel artificial categories, A and B. Each category was defined around a prototype “blob” that corresponded to the center of a space of blob exemplars (Figure 1A). Within each category, 300 unique blob exemplars were generated from a parameterized distribution. Each blob was the result of a random two-dimensional polygon with 20 edges (or dimensions) similar to the design used by Krigolson et al. (2009). The edges were defined as distances of proportion 30–70% of the distance between an origin and 20 vertices uniformly distributed around a unit-length circle. To control for statistical variability, blobs were generated from a multivariate Gaussian distribution specified for each category, where the mean
www.frontiersin.org
of the distribution is the 20-dimensional vector of the prototype, and the covariance is a diagonal matrix with variance in each dimension proportional (20%) to the difference in edge distances across the two exemplars. This ensures samples within each category vary slightly from each other but remain distinct from the other stimulus category. Figure 1A shows several samples drawn from each of the two categories. This design yields a distinct category boundary which is illustrated by the two separate blob distributions as projected into a space spanned by the first two principal components of a PCA (Figure 1B). A comparison of the number of dimensions to cumulative variability establishes that the greatest variation (∼90%) among the blob samples is captured in one to two dimensions (Figure 1C). Finally, Figure 1D illustrates the normalized weight that each edge shares in the first principal dimension. A lengthier edge accounts for more variability in this dimension and hence it is more likely to be used as discriminative feature for visual categorization. 2.4. EXPERIMENTAL PROCEDURES
The experiment involved a trial-by-trial feedback-driven visual category learning task where the participants’ task was to discriminate between the two blob categories. Each experimental session consisted of 600 trials that included randomized presentations of 300 unique A-blobs and 300 unique B-blobs. The session was divided into five equal blocks of trials with brief self-paced breaks between each block to reduce fatigue. The sequence of A and B blobs was permuted for each participant and the number of presentations of stimuli from each category was balanced during each block. Each trial began with a machine-synthesized random auditory label of “A” or “B” (630 ms) transmitted via non-magnetic ear-plugs while the participant visually fixated on a centered cross. A projector was used to back-project stimuli on a nonmagnetic screen (58 × 81 cm) to display all visual stimuli. After an extended 120 ms fixation, either an A-blob or B-blob exemplar was displayed at the center of the screen (subtending a visual angle of approximately 3.4 degrees both vertically and horizontally) for a brief interval of 750 ms. During the period while the blob was displayed, the participant responded with a finger press to indicate whether the audio category label matched
October 2013 | Volume 4 | Article 684 | 3
Xu et al.
the blob category (“yes” or “no”). For example, if the participant heard the label “A” followed by a visually-presented “B” blob, the participant would press a button to indicate “yes,” match, or “no,” a mismatch. The “yes” and “no” labels were displayed along the left or right bottom corners of the screen with their positions counterbalanced for each experimental session. A glove response pad was used to allow participants to respond with finger presses with minimal wrist movement. Shortly after response, the participant would receive on-screen feedback after a jittered interval of 150–300 ms: “correct,” “wrong,” or “too slow” were displayed in the center of the screen for 750 ms to indicate the correctness of their response. Participants had to respond within the 750 ms window to avoid the “too slow” feedback. The intertrial interval was 500 ms before the next trial began. Our experimental procedure is similar to the study by Krigolson et al. (2009) with two important distinctions. First, we used an audio label as a prompt for each category to be matched to the subsequent visual presentation of a blob exemplar, whereas in Krigolson et al. (2009) each blob stimulus was simultaneously shown below a randomized written label showing either the letter “A” or “B.” Their trial design made it difficult to determine whether the observed categorical visual responses were driven by the visual letter or the blob stimulus. Second, Krigolson et al. (2009) were equally interested in categorization and error-driven learning, so they continually shortened stimulus presentation to ensure an adequate number of errors for analysis. In contrast, our primary interest was in understanding visual category learning, therefore we maintained a stable visual presentation time throughout our experiment. 2.5. MEG DATA ACQUISITION AND PREPROCESSING
Using MEG, we recorded cortical activity while participants were trained to discriminate between the two blob categories. All experiments were conducted in an electromagnetically shielded room with participants seated comfortably and head-fixed throughout the session. Neural data were recorded using a 306channel whole-head MEG system (Elekta Neuromag, Helsinki, Finland). The system has 102 channels where each is a triplet of a magnetometer and two perpendicular gradiometers. MEG signals were sampled at 1000 Hz. Four head position indicator coils were placed on the scalp to record relative head positions to the MEG machine at each session. Electrooculography and electrocardiography were recorded by additional electrodes placed above, below and lateral to the eyes and at the left chest, respectively. The coil and electrode signals were used to correct for movement and artifacts throughout the experiments, the MEG signals were bandpass-filtered between 0.1 and 50 Hz to prevent power-line interference at 60 Hz, and signal projection methods were used to remove artifacts such as heart beats. Any delay in the visual display of stimuli on the screen was measured by photodiodes and was corrected for in all reported results. For all of our analyses, we focused on the 400 ms period after visual stimulus onset and prior to the participant’s categorization responses. The baseline defined as 120 ms prior to the onset of the blob stimulus was removed for each trial to account for signal drift.
Frontiers in Psychology | Perception Science
Temporal coding of visually-similar categories with MEG
Cortical source estimates were computed using the Minimum Norm Estimates (MNE) (Hamalainen et al., 1993) in MNE Suite software (http://www.nmr.mgh.harvard.edu/martinos/userInfo/ data/sofMNE.php). Source dipoles were evenly distributed (5 mm separation between neighboring sources) with orientations fixed normally to the cortical surface. Surface brain models for each individual participant were constructed by Freesurfer software (http://surfer.nmr.mgh.harvard.edu/) from structural magnetic resonance imaging scans acquired at the Scientific Imaging and Brain Research Center at Carnegie Mellon University (Siemens Verio 3T, T1-weighted MPRAGE sequence, 1 × 1 × 1 mm, 176 sagittal slices, TR = 1870 ms, TI = 1100 ms, FA = 8 degrees, GRAPPA = 2). Based on the neural anatomy of each individual participant, 24 ventral visual and prefrontal cortical regions containing multiple source dipoles were identified from Freesurfer segmentation using the Desikan-Killiany Atlas (Desikan et al., 2006). 2.6. MEG SENSOR-SPACE ANALYSIS
A multivariate Hotelling’s t-test was applied across the MEG time series data to evaluate whether MEG sensor signals carry information capable of discriminating between categories A and B. At each time point, a multi-dimensional vector was defined as the ensemble signal from 102 scalp magnetometers averaged within a 10 ms window (the time-averaging was performed by taking the mean within a moving window of 20 ms in step of 10 ms along the time course). This vector was then collected for each single trial where a blob exemplar was presented. All trials were divided into two groups based on the category membership of the presented blob stimulus in each trial for the t-test. To assess whether the multivariate sensor signal is identical under A and B groups (null hypothesis), the high-dimensional vectors were first mapped into a lower-dimensional space via principal components that preserved at least 99% signal variability prior to the test. This ensures a non-singular inversion in estimating the covariance matrices in the t-tests. The resulting projected vectors from all trials were subsequently evaluated with the Hotelling’s t-test. The computed value was expressed in terms of a χ2 statistic at each time point, and it was repeatedly applied through the entire time course between 0 and 400 ms after the visual onset. 2.7. MEG SOURCE-SPACE ANALYSIS
Similar procedures were applied to the MEG source space. Anatomically bounded regions in the ventral visual pathway and prefrontal cortex were first defined by the segmentation result from Freesurfer. Because each region contained multiple dipoles, a multivariate Hotelling’s t-test was performed over time to evaluate whether dipoles within each cortical region discriminated trials containing A or B blobs. At each time point, a multidimensional vector was constructed by the ensemble of cortical dipole amplitudes averaged in 10 ms windows. This vector was then reduced via principal components analysis to lower dimensions that capture 99% variability (again to ensure non-singular inversion in the covariance estimation). The resulting projected vectors from all trials were evaluated with the Hotelling’s t-test at each available time point. The analysis was repeated among first
October 2013 | Volume 4 | Article 684 | 4
Xu et al.
sufficiently short for a combined perceptual and motor response for some participants. 3.2. CATEGORY-DISCRIMINATIVE TIME COURSE IN MEG SENSOR SPACE
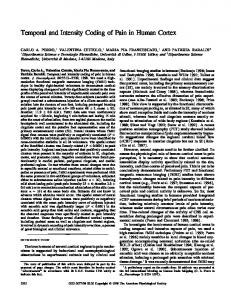
Given that our participants successfully learned the two visual categories, our next step was to assess whether category memberships can be reliably discriminated from MEG sensor data. We expected the recorded sensor data to differentiate trials in which participants recognized blobs from category A as compared to category B. To evaluate this proposal, we performed Hotelling’s t-tests with dimension-reduced magnetometer signals and computed category discriminability (χ2 statistic) over time using all available trials partitioned into A and B categories. To obtain a chance-level distribution for comparison, we also applied this procedure to trials with shuffled category labels (100-fold permutations) for each individual subject. Figure 3 shows the group-level statistics. We were able to reliably discriminate the A and B blob categories within the
Categorization accuracy
A 1
**
Early−learning Late−learning
** **
*
*
0.8
*
0.6 0.4 0.2 0
1
2
3
4
5
6
7
Subject
B 1000
Response time (msec)
100 trials and final 100 trials separately to compare the neural discriminability of visual categories at different stages in the learning process. An excursion test (Xu et al., 2011) was used to evaluate the significance of the discriminative time course in source space. This followed a number of steps. First, discriminative time course was thresholded and only contiguous time points that exceeded the threshold were proposed as potential regions of interest. Contiguity was satisfied if any of the immediate neighbors of a given point in time also passed the threshold—this procedure helped to prune isolated events that are likely to occur due to chance. This same procedure was then applied to the same data multiple times (100-fold permutations), but in each case, category labels were shuffled—this provided a baseline measure, or a null distribution. A p-value was then computed using a standard permutation test by comparing the discriminability statistics within the proposed regions of interest to those in the permuted data following procedures described in Xu et al. (2011). Logistic regression was used to predict blob categories from cortical time course activities at predefined time windows. Within each of 24 anatomically defined cortical regions, time courses of all available cortical dipoles were averaged across time windows 50–150, 150–250, 250–350 and 0–50 (baseline) post-stimulus, respectively. The predictive decoding analysis was then performed within each of these windows. First, ensembles of cortical dipole amplitudes were collected for 100 trials in earliest and final phases of the learning session separately. For each phase, a leave-onetrial-out cross-validation was used to predict the category membership of blob presented at a single held-out trial. Specifically, the multidimensional ensemble of dipole amplitudes for each anatomical region were projected to a low-dimensional space via principal components that captured 99% variability. Then, at each round of cross validation, a logistic regression classifier was used to predict the blob category in an unseen held-out trial given logistic weights estimated from all remaining trials. This procedure was repeated for all trials until every trial was predicted, and the overall accuracy was reported based on the percentage of trials where the classifier correctly predicted the blob category.
Temporal coding of visually-similar categories with MEG
Early−learning Late−learning
800 600
**
**
**
400 200 0
1
2
3
4
5
6
7
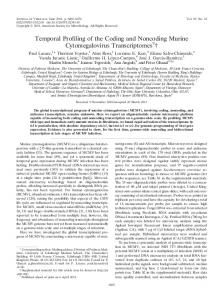
FIGURE 2 | Summary of behavioral category learning performance. (A) Categorization accuracies during the early (first 100 trials) and late (final 100 trials) periods of the learning experiment. (B) Reaction times during trials from the same periods. “∗ ” and “∗∗ ” indicate significance at p < 0.05 and p < 0.005, respectively, with Bonferroni corrections.
3. RESULTS 3.1. BEHAVIORAL CATEGORY LEARNING PERFORMANCE
www.frontiersin.org
100
Category discriminability
Seven participants successfully learned the blob categorization task. Figure 2A shows the individual categorization accuracies in the first and final 100 trials (error bars indicate standard errors of the means), representing behavioral performance during early and late stages of learning. All but one participant improved significantly (p < 0.05 from binomial tests with Bonferroni corrections) over the course of learning. The remaining participant also improved, although the improvement was only marginally reliable (p = 0.07). However, all participants were able to categorize the blobs significantly above chance rate 50% (p < 0.01 from t-tests) with an average terminal accuracy of 83% for the late stage of learning. Figure 2B shows the mean reaction times for the early and late stages of learning (error bars indicate standard errors of the means). Only three subjects showed significant reduction in the reaction time (p < 0.005 from t-tests with Bonferroni corrections). This was expected because the 750 ms-deadline period was
Mean S.E.M. Chance
80
60
40
20 0
50
100
150
200
250
300
350
400
Time (msec)
FIGURE 3 | Category-discriminative time course in MEG magnetometers. Group-level category-discriminabilitive time course (visual stimulus onset at 0 ms) compared against pooled chance-level time course computed from trials with shuffled category labels.
October 2013 | Volume 4 | Article 684 | 5
Xu et al.
Temporal coding of visually-similar categories with MEG
and the prefrontal cortex, we used similar methods to compute category-discriminative time series in MEG source space. In particular, we focused on anatomically-defined regions in ventral occipito-temporal visual and prefrontal cortices. To test whether the ventral visual pathway is capable of learning and discriminating exemplars from visually-similar categories, we compared time courses in related cortical regions during both the early and late stages of learning. Similar to our sensor-space analysis, a category-discrimination time course in source space was computed by performing multivariate Hotelling’s t-tests from cortical dipole activities across time. To distinguish trials in the early and late stages of learning, tests were performed for the 100 earliest and the 100 latest trials separately with equal numbers of A and B blobs presented. Figure 4 summarizes the results for 12 visual cortical regions and 12 prefrontal regions in both left and right hemispheres. During early learning as illustrated in Figures 4A,B, we observed that category discriminability rises at approximately 100 ms poststimulus in both hemispheres. During late learning as illustrated in Figures 4C,D, we observed that category discriminability also
half-second period after visual onset in a single trial. In particular, the mean category discriminability rises post-50 ms and is highly separable from the chance-level after 100 ms. To assess the significance of these results, we applied an excursion procedure similar to (Xu et al., 2011) that compares the temporal statistics from the original data (without permutation) with the permuted statistics. We found that category discriminability is statistically significant post-100 ms for all subjects (combined p < 1.8 × 10⁻⁸ from Fisher’s method; p < 0.01 from individualbased excursion tests). Figure A1 in the Appendix shows the time course for each individual subject. 3.3. CATEGORY-DISCRIMINATIVE TIME COURSE IN THE VENTRAL VISUAL PATHWAY AND PREFRONTAL CORTEX
Our previous analysis demonstrates that the time course in MEG sensors contains significant category information in aggregate, but it does not address the question of localizing which brain regions are the sources of this information or how these sources may change with learning. To evaluate our hypotheses regarding the relative roles of the ventral visual pathway
Category discriminability
A
B Left VVP (Early−learning) 30
fusiform inferiortemporal lateraloccipital
Right VVP (Early−learning) 30
parahippocampal pericalcarine lingual
20
20
10
10
0
0
100
200
300
400
500
600
Time (msec) Left VVP (Late−learning)
C
0
30
20
20
10
10
0
100
200
300
400
500
600
Left PFC (Early−learning)
E 30
lateralorbitofrontal medialorbitofrontal frontalpole
0
10
10
100
200
300
400
500
600
Left PFC (Late−learning)
G
0
30
20
20
10
10
0
100
200
300
400
500
FIGURE 4 | Category-discriminative time courses in ventral visual and prefrontal cortices. (A) Group-level discriminative time courses in right-hemispheric VVP contrasting dipole responses in trials containing A and B blob categories during early learning. (B) Discriminative time
Frontiers in Psychology | Perception Science
300
400
500
600
100
200
300
400
500
600
Right PFC (Early−learning)
0
600
0
100
200
300
400
500
600
Right PFC (Late−learning)
H
30
0
200
30
20
0
0
F
rostralmiddlefrontal parstriangularis parsorbitalis
20
0
100
Right VVP (Late−learning)
D
30
0
0
0
100
200
300
400
500
600
courses in left-hemispheric VVP regions during early learning. (C,D) P-value time courses in VVP regions from left and right hemispheres during late learning. (E–H) Discriminative time courses in PFC regions under similar conditions.
October 2013 | Volume 4 | Article 684 | 6
Xu et al.
Temporal coding of visually-similar categories with MEG
rises at approximately 100 ms, but discriminability peaks post200 ms in the lingual, lateral-occipital and fusiform gyri in the left hemisphere. This time window agrees roughly with N250 as previously reported in Krigolson et al. (2009), except here we provided better localization of its sources in the cortex. In comparison, we observed relatively scarce discriminability in prefrontal cortex throughout time course and learning as illustrated in Figures 4E–H. To assess the significance of the category-discriminative time course, we performed an excursion test following Xu et al. (2011). Specifically, for each subject, we obtained regions of interest by thresholding the time course at 20 and kept contiguous time points that passed the threshold. We evaluated the significance for each subject by comparing the discriminability statistics within the proposed regions of interest against the statistics within regions found from the permutated data (100 folds)—this yielded a global p-value. Figure 5 shows the temporal regions of interest pooled across subjects (combined p < 1.8 × 10⁻⁸ from Fisher’s method; p < 0.01 from individual-based excursion tests). These results show that category information flows primarily in the bi-lateral occipital, lingual, pericalcarine, fusiform and inferiortemporal gyri during both early and late learning, suggesting that the VVP acquires discriminability of novel, visually similar categories during learning. Figure 5 also shows that regions of interest in prefrontal cortex are more sparse in comparison with those in the VVP. In particular, whereas temporal coding appears in prefrontal cortex during early learning, it decreases in late learning, suggestive of a diminished role of prefrontal cortex. Figure A2 in the Appendix shows that such a pattern is consistent across all subjects. Our current set of results, however, does not rule out the possibility that coding in PFC becomes more sparse over time (e.g. Meyers et al., 2008) or that it could be generated from a deep source which is difficult to detect with MEG. 3.4. PREDICTING CATEGORIES FROM CORTICAL ACTIVITY
To this point, our analyses have explored category discriminability across a continuous time course. These analyses also help identify time windows that appear to offer availability of
A
B
Early−learning
| | | PFC |
Late−learning 1
Lfusiform Linferiortemporal Llateraloccipital Lparahippocampal Llingual Lpericalcarine Rfusiform Rinferiortemporal Rlateraloccipital Rparahippocampal Rlingual Rpericalcarine Llateralorbitofrontal Lmedialorbitofrontal Lfrontalpole Lrostralmiddlefrontal Lparsorbitalis RLparstriangularis Rlateralorbitofrontal Rmedialorbitofrontal Rfrontalpole Rrostralmiddlefrontal Rparsorbitalis Rparstriangularis
VVP
0
200 400 Time (msec)
600
FIGURE 5 | Regions of interest in ventral visual and prefrontal cortices after excursion tests. (A) Group-aggregated regions of interest during early learning. (B) Group-aggregated regions of interest during
www.frontiersin.org
category-discriminative cortical information. Thus, one question we can ask is how temporal windows differ from one another with respect to what information they carry regarding visual category learning. A similar question may be asked with respect to spatially localized activity: does the ventral visual pathway carry more information regarding subordinate-level visual categories relative to prefrontal cortices? To address these questions, this next analysis evaluates to what extent the ventral visual pathway and prefrontal cortex are predictive of blob categories at the discrete temporal windows of M100 (50–150 ms), M200 (150–250 ms) and M300 (250–350 ms), as well as, critically, how category predictability within these temporal windows changes over the course of learning. We predict that the ventral visual pathway will play a significant role in category learning and representation. In particular, the VVP is expected to acquire an increasing degree of category predictability (more than PFC) during learning. To test this prediction, we performed a decoding analysis to assess category predictability in the same 24 anatomically-defined regions in the ventral visual pathway and prefrontal cortex used in our earlier analyses. Within each of these regions, we ran held-out predictions regarding blob categories on a trial-by-trial basis using multidimensional cortical dipole activities averaged within the following time windows: M100 (50–150 ms), M200 (150–250 ms), and M300 (250–350 ms), as well as the baseline of 0–50 ms, post-stimulus. This was implemented using a standard leave-one-out cross validation technique which evaluated to what degree category membership of a blob presented in a single trial not part of the training set can be predicted based on region-bounded dipole responses and blob category labels from the remaining trials in the training set. To compare predictability during initial and end-stage learning, as in the previous analysis, this decoding analysis was conducted separately for the first and final 100 trials. Figure 6 summarizes blob category-predictive accuracies across all 24 cortical regions and time windows in the early and late stages of learning. At M100, the bilateral peri-calcarine gyri, the right lingual gyrus and the left lateral occipital gyrus become highly predictive with respect to blob categories (p
0.05 under t-tests)—suggesting that category predictability in this early time window may not be shaped by category learning per se. Within M200 and M300 windows, across most of visual cortex, predictive accuracies in the late learning stage are considerably better than they were in the initial learning stage. In particular, the left inferior temporal gyrus (ITG) (p < 0.024) and the left fusiform gyrus (FG) (p < 0.025) show significant increases in category-predictive accuracy. This pattern suggests that learning plays a greater role in shaping cortical responses at these later temporal stages of processing— confirming our hypothesis that visual cortex encodes and represents subordinate visual categories. To visualize these cortical learning effects, we extracted dipoles that showed reliable differential response (p < 0.001) across the A and B blob categories within the M200 window. Figure 7 illustrates the significant discriminability in source dipoles that appeared in the left ITG, the left FG, and the bilateral lateral occipital gyri later in learning. Note that these effects were absent during the initial learning phase of the experiment. Unlike visual cortex, regions in prefrontal cortex are generally less predictive about blob categories (bottom panels of Figure 6). In addition, these regions are marginally more predictive earlier in learning relative to later in learning, with left pars orbitalis (or inferior frontal gyrus) showing a marginally significant (p < 0.05) decrease in predictive accuracy at M300. These observations are suggestive that prefrontal cortex plays a greater role in category encoding during learning, but they do not exclude the possibility that learning induces sparse coding in PFC or a more complementary role of PFC that jointly participates category coding with the VVP. Figure 8 compares the ventral visual pathway and prefrontal cortex at M100, M200, and M300 by pooling predictive accuracies
Frontiers in Psychology | Perception Science
M100 (50–150 ms) window. (C) Decoding accuracies in M200 (150–250 ms) window. (D) Decoding accuracies in M300 (250–350 ms) window. Asterisks indicate significant difference (p < 0.05) in predictive accuracy between early and late learning.
across dipoles within each of these cortical regions. The result suggests that both the VVP and PFC are near chance in predicting the blob categories during initial learning. However, later in learning, the ventral visual pathway becomes significantly more category-predictive than prefrontal cortex at M200 and M300 (p < 0.005 under t-tests) but not at M100 (p > 0.5). Interestingly, we found significant interaction between the VVP and PFC during the three time windows during late learning (p < 0.005 under 2 × 3 ANOVA) but not initially during learning (p > 0.1). Together, these results support the hypothesis that the VVP and PFC function as complements to one another, suggesting that improved categorization performance over the course of learning is associated with increased predictability post-150 ms for the VVP.
4. DISCUSSION Models addressing the neural basis of visual category learning have focused on the interplay between the ventral visual pathway (VVP) and prefrontal cortex (PFC). However, there has been no clear consensus on the respective roles of these two neural substrates, with some theories taking a dominant PFC view in which category membership is encoded within PFC, while the VVP is sensitive only to visual feature differences (albeit correlated with category membership) (Freedman et al., 2003; Seger and Miller, 2010). In contrast, the complementary PFC view holds that the VVP and PFC play different functional roles at different points in category acquisition—PFC facilitating the learning of category-relevant features during the initial stages of learning, but with the VVP ultimately encoding these featural dimensions so as to become progressively more sensitive to category boundaries (as opposed to purely visual feature differences) (Sigala and Logothetis, 2002; Fenske et al., 2006). Using MEG which provides superb temporal resolution and good spatial resolution, we conducted a decoding analysis to
October 2013 | Volume 4 | Article 684 | 8
Xu et al.
A
Temporal coding of visually-similar categories with MEG
Left lateral view
Ventral view
Right lateral view
n.s. p