profile of the perceived intensity of experimental somatic pain over networks ... coding temporal and intensive aspects of pain, we used a ...... 411â420, 1996.
Temporal and Intensity Coding of Pain in Human Cortex CARLO A. PORRO, 1 VALENTINA CETTOLO, 1 MARIA PIA FRANCESCATO, 1 AND PATRIZIA BARALDI 2 1 Dipartimento Scienze e Tecnologie Biomediche, Universita` di Udine, I-33100 Udine; and 2 Dipartimento Scienze Biomediche, Universita` di Modena, I-41100 Modena, Italy Porro, Carlo A., Valentina Cettolo, Maria Pia Francescato, and Patrizia Baraldi. Temporal and intensity coding of pain in human cortex. J. Neurophysiol. 80:3312–3320, 1998. We used a highresolution functional magnetic resonance imaging (fMRI) technique in healthy right-handed volunteers to demonstrate cortical areas displaying changes of activity significantly related to the time profile of the perceived intensity of experimental somatic pain over the course of several minutes. Twenty-four subjects (ascorbic acid group) received a subcutaneous injection of a dilute ascorbic acid solution into the dorsum of one foot, inducing prolonged burning pain (peak pain intensity on a 0–100 scale: 48 { 3, mean { SE; duration: 11.9 { 0.8 min). fMRI data sets were continuously acquired for Ç20 min, beginning 5 min before and lasting 15 min after the onset of stimulation, from two sagittal planes on the medial hemispheric wall contralateral to the stimulated site, including the cingulate cortex and the putative foot representation area of the primary somatosensory cortex (SI). Neural clusters whose fMRI signal time courses were positively or negatively correlated (P õ 0.0005) with the individual pain intensity curve were identified by cross-correlation statistics in all 24 volunteers. The spatial extent of the identified clusters was linearly related (P õ 0.0001) to peak pain intensity. Regional analyses showed that positively correlated clusters were present in the majority of subjects in SI, cingulate, motor, and premotor cortex. Negative correlations were found predominantly in medial parietal, perigenual cingulate, and medial prefrontal regions. To test whether these neural changes were due to aspecific arousal or emotional reactions, related either to anticipation or presence of pain, fMRI experiments were performed with the same protocol in two additional groups of volunteers, subjected either to subcutaneous saline injection (saline: n Å 16), inducing mild short-lasting pain (peak pain intensity 23 { 4; duration 2.8 { 0.6 min) or to nonnoxious mechanical stimulation of the skin (controls: n Å 16) at the same body site. Subjects did not know in advance which stimulus would occur. The spatial extent of neural clusters whose signal time courses were positively or negatively correlated with the mean pain intensity curve of subjects injected with ascorbic acid was significantly larger (P õ 0.001) in the ascorbic acid group than both saline and controls, suggesting that the observed responses were specifically related to pain intensity and duration. These findings reveal distributed cortical systems, including parietal areas as well as cingulate and frontal regions, involved in dynamic encoding of pain intensity over time, a process of great biological and clinical relevance. INTRODUCTION
The involvement of several cortical regions in pain mechanisms is supported by behavioral and neurophysiological observations in experimental animals and by clinical and The costs of publication of this article were defrayed in part by the payment of page charges. The article must therefore be hereby marked ‘‘advertisement’’ in accordance with 18 U.S.C. Section 1734 solely to indicate this fact. 3312
functional imaging studies in humans (Backonja 1996; Jones and Derbyshire 1996; Kenshalo and Willis 1991; Talbot et al. 1991). Experimental findings and clinical data suggest that parietal areas, including the primary somatosensory cortex (SI), are mainly involved in the sensory-discriminative aspects (Melzack and Casey 1968), whereas frontolimbic networks subserve the affective dimension of pain experience (see Albe-Fessard et al. 1985; Backonja 1996; Price 1988). This view is supported by the functional characteristics of neurons projecting to, or situated in SI, many of which show small receptive fields and code the intensity of noxious stimuli, whereas frontal and cingulate neurons usually respond to stimulation of wide body regions (Kenshalo et al. 1988; Sikes and Vogt 1992; Snow et al. 1992). A recent positron emission tomography (PET) study showed indeed that selective manipulation of pain unpleasantness by hypnotic suggestions changes the regional cerebral blood flow (rCBF) response in anterior cingulate but not in SI (Rainville et al. 1997). However, several aspects need to be further clarified. To assess the physiological role of human cortical areas in pain perception, it is necessary to show that cortical neuronal assemblies display activity specifically related to the site, intensity, and time course of perceived pain. This is yet to be conclusively demonstrated. Preliminary PET and functional magnetic resonance imaging (fMRI) studies have shown hemodynamic changes related to pain intensity in different cortical areas (e.g., Davis et al. 1997; Svensson et al. 1996), but the relationship between the temporal aspects of perceived pain and cortical activity is unknown. So far, most functional imaging studies in humans provided integrated rCBF measurements during brief periods of noxious stimulation, inducing relatively constant levels of pain intensity, whereas under natural circumstances pain often varies over time. Time-related changes of the activity of CNS cell assemblies during prolonged pain were described in experimental animals (Porro and Cavazzuti 1993, 1996). To investigate the involvement of human cortical areas in coding temporal and intensive aspects of pain, we used a high-resolution fMRI technique (Frahm et al. 1993; Porro et al. 1996) mainly sensitive to local changes in blood oxygenation accompanying neuronal activation (the so-called BOLD effect) (Cohen and Bookheimer 1994; Kwong et al. 1992; Ogawa et al. 1990). Subcutaneous injection of ascorbic acid was chosen as an ethically acceptable noxious stimulus, inducing a prolonged pain sensation with minimal tissue damage.1 It was recently demonstrated that fMRI may 1 A preliminary report on the results from 18 subjects was presented at the 3rd International Meeting on Human Brain Mapping (C. A. Porro et al., Neuroimage 5: S224 1997).
0022-3077/98 $5.00 Copyright q 1998 The American Physiological Society
/ 9k2e$$no39 J424-8
11-18-98 22:30:57
neupa
LP-Neurophys
F MRI
AND PAIN
reveal sustained signal changes during prolonged sensory stimulation (Bandettini et al. 1997), thus allowing the monitoring the activity of cortical populations over time. METHODS
Subjects Fifty-six right-handed volunteers (24 males and 32 females) aged 19–39 yr (mean, 24.3) were included in the study after informed consent. All of them were students or trainees at the School of Medicine, University of Udine, and were free from systemic diseases and painful conditions. To exclude intracranial pathologies and to reduce the potential stress of a novel and restricted environment, each subject underwent a brief training session in the MR system, during which a preliminary set of anatomic images was acquired.
Experimental protocol The experimental protocol was approved by the Ethics Committee of the University of Udine. Each participant was studied only once and was subjected to only one of three kinds of stimulation on the dorsum of one foot: subcutaneous injection of a commercial buffered ascorbic acid solution (0.5 ml, 20%, pH 6.87; ascorbic acid, n Å 24), subcutaneous injection of 0.5 ml of saline (saline, n Å 16), or innocuous touching the skin with a needle for 20 s (controls, n Å 16). Side of stimulation was balanced across individuals. Subjects were aware of which foot would be stimulated and that the stimulation might be painful. However, they did not know in advance which stimulus would actually occur. Heart rate was continuously monitored in 40 subjects. All volunteers were instructed to rate pain intensity with a numerical 0–100 scale, where 0 denoted ‘‘no pain’’ and 100 denoted ‘‘the maximum imaginable intensity of pain.’’ It was explained that the estimate concerned the sensory intensity of pain and not unpleasantness (Price 1988). No hint was given on the expected intensity and duration of pain. Experiments lasted Ç20 min; a 4-min baseline period was followed by a ‘‘warning’’ signal (cleaning the skin with an antiseptic solution) and, 1 min later, by delivery of the stimulus. Twenty-nine subjects (‘‘on-line’’ experiments: 13 ascorbic acid, 8 saline, and 8 controls) were asked to communicate, with both hands, the intensity of perceived pain (0–100) at 1-min intervals during the whole course of the experiments (both before and after stimulation), in response to a light touch of the unstimulated foot. Specifically, they were instructed to lift their hands and fingers twice, the first time to indicate the tens (1–10 lifted fingers Å 10– 100) and the second one to indicate the units. Closed hands meant 0. The whole motor sequence was usually completed in 3–4 s. Twenty-seven subjects were requested to draw the time profile of the perceived pain intensity immediately after the end of the experiment (‘‘recall’’ experiments: 11 ascorbic acid, 8 saline and 8 controls). To this purpose, they were instructed to calculate time by paying attention to the rhythmical noises generated by the scanner (2 images were acquired in Ç21 s, and a brief but distinguishable pause occurred between each 21-s epoch). In both the recall and on-line experiments the end of pain sensation, if any, was marked by a conventional sign. Apart from these brief motor activities, all subjects were instructed to maintain their head and body still and not to speak throughout the experiments. In subjects injected with ascorbic acid, no difference between the recall and on-line experiments was found in maximum pain intensity (51 { 6 vs. 45 { 3, mean { SE: t Å 0.80, P ú 0.4), in the area under the pain intensity curve (930 { 209 vs. 901 { 108 arbitrary units: t Å 0.12, P ú 0.9), or in the spatial extent of activated clusters in any of the investigated regions [analysis of variance (ANOVA) group: F Å 0.22, P ú 0.6; group 1 region:
/ 9k2e$$no39 J424-8
3313
F Å 0.74, P ú 0.6]. In both the recall and on-line groups, a linear relationship was found between the extent of neural clusters showing signal changes related to pain intensity and the individual peak pain intensity (r Å 0.871 and r Å 0.782 for positively correlated clusters; r Å 0.836 and r Å 0.759 for negatively correlated clusters in the recall and on-line experiments, respectively). Mean normalized fMRI signals, in images acquired at times corresponding to hand signaling in the on-line subjects, were also similar in the two groups, suggesting that the brief hand movements were not associated to marked changes of the pattern of activity within the investigated brain areas (a nonsignificant trend toward higher values was indeed found in the recall subjects: group: F Å 3.89, P ú 0.06; group 1 region: F Å 0.91, P ú 0.5). On these grounds, data from the two groups were pooled together for subsequent analyses.
Data acquisition The study was performed with a 1.5-T Siemens MR scanner with quadrature head coils. Head motion was minimized by an adjustable padded head holder and orthopedic collars. Field homogeneity was adjusted by a global shimming procedure for each subject, line widths being Ç20 Hz. In each volunteer, fMRI data sets were continuously acquired by a FLASH gradient-echo sequence (TR/TE Å 63/40 ms, FA Å 407; FOV Å 230–245 mm; 128 1 128 acquisition matrix, interpolated to 256 1 256; scan time, 21 s for 2 images) over Ç20 min, beginning 5 min before and lasting 15 min after the onset of stimulation, from two sagittal planes (5 mm thick, interplane gap 1 mm) on the medial hemispheric wall contralateral to the stimulated foot. The imaged planes included the cingulate cortex and the putative foot representation area of SI (Fox et al. 1987). Fifty-seven images per plane were analyzed; the first image of each series was discarded. Anatomical images from the same planes were acquired with a two-dimensional (2-D) T 1-weighted sequence (TR/TE Å 600/15 ms, 256 1 256). To detect the course of major blood vessels in the two planes of interest and to allow transformation in stereotactic coordinates, respectively, a 2-D FLASH sequence (TR/TE Å 32/10 ms, FA Å 507, 256 1 256) and a three-dimensional Turbo-FLASH sequence (TR/TE Å 10/4 ms, TI Å 300 ms, FA Å 107, 192 1 256) were also run in each subject.
Data analyses Functional images were in-plane aligned with the AFNI software package (Cox 1996). Twelve volunteers showing clear motion artifacts were not included in the study. In the 56 investigated subjects, mean estimated motion parameters for the x and y directions (expressed in pixel fractions, unsigned) were 0.175 { 0.017 and 0.384 { 0.029, respectively; mean rotational parameter was 0.334 { 0.0377. They were not significantly different in the three groups (ascorbic acid, saline, and controls). For each subject and each plane, the first image of the functional data set was coregistered to the corresponding 2-D anatomic image. The boundary of cerebral cortex was outlined, excluding areas corresponding to visible artifacts or major blood vessels. Pixels displaying in the first functional image a signal intensity 2 SDs higher or lower than the mean of all pixels lying within the outlined cortical area, which were more likely to be associated with blood vessels or cortical sulci, were excluded from further analyses. Global drifts of signal intensity relative to baseline (mean percentage values at the end of the experimental period 0.57 { 0.05%, unsigned) were linearly corrected before statistical tests. The time course of the fMRI signal in each surviving pixel was compared with the individual (in the 40 subjects injected with ascorbic acid or saline) and/or the mean psychophysical pain intensity curve of the ascorbic acid group (all subjects), thus creating
11-18-98 22:30:57
neupa
LP-Neurophys
3314
PORRO, CETTOLO, FRANCESCATO, AND BARALDI
of the centers of mass of the identified clusters were calculated for each region of interest. The normalized spatial extents of neural clusters were compared with ANOVA, with group as a between-subjects factor and region (the 8 identified areas) and sign (positively or negatively correlated clusters) as within-subjects factors, followed by specific contrasts if appropriate. Psychophysical and heart rate data and the intensity of fMRI signal changes were analyzed by ANOVA and by the Student’s t-test. A value of P õ 0.05 was assumed as significant. RESULTS
Psychophysical and physiological data
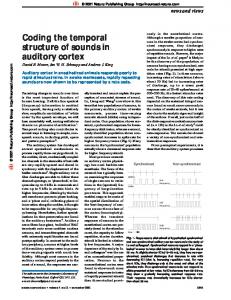
FIG . 1. Schematic drawing of the medial hemispheric wall, modified from the Talairach and Tournoux stereotaxic atlas, showing the location and extent of the 8 cortical areas of interest. AC, anterior cingulate; MI, primary motor cortex; MP, medial parietal cortex (precuneus); MPF, medial prefrontal cortex; PC, posterior cingulate; PGC, perigenual cingulate; SI, primary somatosensory cortex; SMA, supplementary motor area. The horizontal and vertical lines correspond to the bicommissural line and to the vertical planes passing through the anterior and posterior commissure, respectively.
statistical maps based on Pearson’s correlation coefficient r (possible range 01 to 1) (Bandettini et al. 1993). Given the relatively long acquisition time for functional images and the sampling period of psychophysical data, no shift was introduced to account for the time lag of the hemodynamic response (Friston et al. 1994; Kwong et al. 1992). A value of Ér É Å 0.45 (corresponding to z Å 3.56) and a cluster size Å 4 pixels were assumed as significance thresholds, yielding a nominal P õ 0.0005 (2-tailed), corrected for the number of comparisons, according to Xiong et al. (1995) (maximum number of investigated pixels Å 18,903; l Å 0.754). The empiric a level, estimated with the mean psychophysical curve of the ascorbic acid group in 57 images acquired with the same sequence in phantoms (n Å 20), was also õ0.05%. To account for variations in brain size and to allow interindividual comparisons, the spatial extents of identified areas were normalized by calculating differences between the individual brains and the standard Talairach brain and correcting values accordingly. To perform regional analyses, boundaries of eight areas of interest (Fig. 1) were outlined onto the individual structural images according to anatomic landmarks, such as the pattern of cortical sulci and the position relative to the anterior and posterior commissures (Picard and Strick 1996; Talairach and Tournoux 1988; Vogt et al. 1995) and then projected onto the aligned functional images. Pixels corresponding to cortical sulci or visible blood vessels were not included in the outlined regions. The foot and leg representation areas of the primary somatosensory cortex (SI) and of the primary motor cortex (MI) were defined as the portions of the paracentral lobule located posterior or anterior, respectively, to the medial root of the central sulcus, which was identifiable in all subjects. The cingulate cortex was divided into three different subareas, namely perigenual (anteroventral), anterior, and posterior cingulate (Devinsky et al. 1995; Vogt et al. 1995); the boundary between the anterior and posterior portions was arbitrarily set at the level of the posterior commissure. It is underlined that, given the interindividual variability in the structural and functional parcellation of cortical areas relative to sulcal anatomy (e.g., Rademacher et al. 1993), the identification of regional boundaries and the assignment of cytoarchitectural areas to the eight regions of interest (Table 1) is by necessity approximate. Functional maps were transformed in the Talairach space along with anatomic images and coordinates
/ 9k2e$$no39 J424-8
All twenty-four subjects subcutaneously injected with a dilute ascorbic acid solution into the dorsum of one foot reported the occurrence of localized pain with stinging and burning quality, occasionally radiating at the distal anterior portion of the leg during peaks of intensity. Pain lasted 11.9 { 0.8 min (range 4–15 min), maximum intensity being 48 { 3 (range 20–85; Fig. 2A). Volunteers receiving subcutaneous saline at the same body site experienced pain lasting 2.8 { 0.6 min, maximal intensity being 23 { 4; both values were significantly lower (P õ 0.001) than the ascorbic acid group. No subject in the control group reported pain. Mean heart rate value during the 4-min baseline period was 73 { 2 beats/min. A significant increase to 82 { 3 beats/min (t Å 6.46, P õ 0.0001) occurred during the minute immediately preceding the onset of stimulation. In almost all subjects, including the ascorbic acid group, this increase rapidly subsided, so that averaged heart rate in successive 5-min periods (0–5 min after stimulus: 73 { 2; 6–10 min: 72 { 2; 11–15 min: 71 { 2) was not significantly different from baseline in any group (group 1 time, F Å 0.50, P ú 0.8). Cortical fMRI signal changes related to the individual pain intensity curve In all 24 subjects of the ascorbic acid group, clusters of pixels whose signal time course was positively or negatively correlated (P õ 0.0005) with the individual psychophysical pain intensity curve were identified by cross-correlation analyses. Mean percentage fMRI signal differences from baseline during the first 3 min after the onset of stimulation, corresponding in most subjects to peak pain intensities, were approximately /3.9% for positively correlated (POS) and 03.5% for negatively correlated (NEG) clusters; these signal changes gradually declined toward baseline along with decreases in the intensity of perceived pain (Fig. 2, B and C). In the same neural populations, significant signal changes (approximately /1.4% for POS and 01% for NEG clusters: t Å 3.51 and t Å 4.78, P õ 0.01 and P õ 0.001, respectively) occurred even during the 40-s period after the ‘‘warning’’ signal, before stimulation onset (Fig. 2, B and C). However, mean fMRI signals during peak pain intensity were significantly different both from baseline and from the postwarning period (ANOVA / difference contrast: t Å 7.12, P õ 0.0001 and t Å 11.89, P õ 0.0001 for POS and NEG clusters, respectively). Representative maps from two subjects are reported in Fig. 3. On average, 3.8 { 0.7% (range 0.03–15.03%) of the total investigated area displayed significant changes; the
11-18-98 22:30:57
neupa
LP-Neurophys
F MRI
TABLE
1.
AND PAIN
3315
Mean centers of mass of clusters significantly correlated with the individual pain intensity curve Positively Correlated Talairach Coordinates, mm
Cortical Region Paracentral lobule, posterior (SI) Paracentral lobule, anterior (MI) Supplementary motor area (SMA) Medial parietal cortex Posterior cingulate Anterior cingulate Perigenual cingulate Medial prefrontal cortex
Negatively Correlated Talairach Coordinates, mm
BA
n
x*
y
z
r
P
n
x*
y
z
r
P
3, 1, 2, 5 4, 6
15 18
7 6
040 023
60 60
0.69 0.74
0.005† 0.001†
14 10
6 6
039 022
60 58
0.58 0.53
NS‡ NS‡
6 5, 7 23, 29, 30, 31 24*, 32* 24, 25, 32, 33 10
14 18 20 21 14 14
6 7 6 7 5 7
0 060 038 6 34 57
55 46 30 34 5 0
0.72 0.72 0.68 0.62 0.52 0.52
0.002† 0.002† 0.005† 0.05† NS‡ NS‡
13 17 18 15 19 20
6 7 6 5 7 7
2 061 046 13 39 56
57 47 29 32 2 0
0.70 0.66 0.50 0.65 0.57 0.37
0.002† 0.01† NS 0.01† NS‡ NS
n, Number of subjects with ¢1 cluster. BA, Brodmann areas; NS, not significant. * Areas from left or right hemispheres were pooled. †The spatial extent of the response was linearly related (Pearson’s correlation coefficient r, after Bonferroni correction for the number of comparisons) with the maximum intensity of perceived pain. ‡Statistical trend (significant without Bonferroni correction).
spatial extent of the response was linearly related to the individual peak intensity of perceived pain (POS clusters: r Å 0.85, P õ 0.0001; NEG clusters: r Å 0.74, P õ 0.0001). On the basis of a priori hypotheses stemming from previous neurophysiological and functional imaging studies, regional analyses were performed on data from eight selected
FIG . 2. Time profiles of the mean ( {SE, n Å 24) intensity of perceived pain (A) and of changes of functional magnetic resonance imaging (fMRI) signal intensity in the cortical populations displaying increases ( B) or decreases (C) significantly related to the individual psychophysical pain intensity curve, in subjects injected with subcutaneous ascorbic acid. Arrows: ‘‘warning’’ signal (cleaning the skin with an antiseptic solution). Vertical lines indicate time of injection. fMRI signals were normalized in every subject and for each pixel by dividing the actual value of signal intensity in each image by the mean intensity value of the same pixel in the 1st 10 images acquired during the baseline period.
/ 9k2e$$no39 J424-8
cortical areas (Fig. 1 and Table 1). Despite interindividual differences in their extent and spatial distribution, positively and negatively correlated clusters tended to concentrate in different regions. Clusters of positively correlated pixels were present in the majority of subjects in the posterior (SI) and/or anterior (MI) portions of the paracentral lobule, supplementary motor area (SMA), medial parietal, and anterior and posterior cingulate cortex. In all these regions, the spatial extent of the activated areas was linearly related to the individual maximal pain intensity. Clusters of negatively correlated pixels were found predominantly in the medial parietal, posterior and perigenual cingulate areas, and in medial prefrontal cortex (Table 1 and Fig. 4). No difference was detected between the spatial extent of the response in the contralateral hemisphere after injection into the right or left foot (side: F Å 1.24, P ú 0.25; side 1 region: F Å 1.19, P ú 0.30). The time profiles of fMRI signal changes of POS or NEG clusters in selected brain regions are shown in Fig. 5. In POS clusters, peak signal changes with respect to baseline (during the first 3 min after the s.c. ascorbic acid injection) tended to be higher in SI and in medial prefrontal cortex (on average, approximately /4.2%), but no significant difference was found in the investigated areas. In NEG clusters, peak signal changes were higher in medial prefrontal cortex (on average, 04.6%) than all other regions, with the exception of SI and MI (P õ 0.05, corrected for the number of comparisons). A small number of clusters (on average 0.5% of the investigated brain area, range 0.05–1.13%) whose signal time course was positively or negatively correlated (P õ 0.0005) with the individual psychophysical pain intensity curve were identified in 13 of 16 subjects of the saline group. ANOVA showed that the spatial extent of POS and NEG clusters was significantly higher in the ascorbic acid than the saline group in any of the investigated regions (group: F Å 12.03, P õ 0.001; group 1 region: F Å 1.44, P ú 0.15). Control analyses Additional analyses were performed to test whether the observed fMRI signal changes were related to factors other than pain intensity and duration. First, a correlation analysis
11-18-98 22:30:57
neupa
LP-Neurophys
3316
PORRO, CETTOLO, FRANCESCATO, AND BARALDI
FIG . 3. Statistical maps from 2 representative subjects, showing the spatial distribution of neural clusters displaying positive (red–yellow) or negative (green–blue) correlations with the individual pain intensity curve. The blue arrow on top points to a cluster in the postcentral gyrus (SI).
was done between the signal time course of POS and NEG pixels in the ascorbic acid group and the individual heart rate profile during the experimental period. The results showed that, on average, only 10 { 4% of the POS pixels and 10 { 4% of the NEG pixels were identified with both the pain intensity and the heart rate curves. A further correlation analysis was done between the mean psychophysical curve of the ascorbic acid group (Fig. 2A) and the time course of signal intensity in the cortex of volunteers of all three groups (ascorbic acid, saline, and controls). Expectation of a potentially painful stimulus was common to all 56 subjects (see METHODS ). However, the overall volume including clusters displaying significant (P õ 0.0005) changes was larger in subjects injected with ascorbic acid than the other two groups (ANOVA / difference contrast, P õ 0.0001). Regional analyses showed that positively correlated areas were significantly wider in the ascorbic acid than both other groups in SI, SMA, and anterior and posterior cingulate cortex, whereas volumes of negatively correlated clusters were larger in medial parietal, medial prefrontal, and perigenual cingulate cortex (Fig. 6). DISCUSSION
Time is a fundamental dimension of conscious experience, and this study yields the first direct demonstration of a link
/ 9k2e$$no39 J424-8
between the time course of perceived pain intensity and the activity of discrete cortical populations during noxious somatic stimulation lasting several minutes. Neural clusters encoding pain intensity over time were found not only in the somatotopically appropriate portion of the primary somatosensory cortex but also in premotor, cingulate, and medial prefrontal regions. Interestingly, the predominant sign of the response (positive or negative correlations between the fMRI signals and pain intensity) differed in various cortical regions, and the spatial extent of the identified clusters was in several areas linearly related to peak pain intensity across subjects. We hypothesize that these cortical neural populations may contribute to the sensory-discriminative aspects of pain perception and to the graded involvement of attentional, limbic, and motor networks during prolonged pain. Advantages and limitations of the adopted fMRI technique fMRI allows individual-based analyses and is potentially characterized by a better spatial and temporal resolution than conventional PET techniques (Cohen and Bookheimer 1994; Jones and Derbyshire 1994). Thus, fMRI maps may reflect the dynamic behavior of neural populations over time and the different pattern of response of adjacent cortical networks.
11-18-98 22:30:57
neupa
LP-Neurophys
F MRI
AND PAIN
3317
et al. 1994; Jones et al. 1991; Talbot et al. 1991) and the ipsilateral hemisphere, yielding a more comprehensive view of brain regions involved in temporal and intensity coding of pain. Specificity of the observed fMRI changes Several lines of evidence suggest that the changes of activity of the identified cortical clusters after noxious input were specifically related to time-varying changes in pain intensity and not to aspecific arousal or emotional reactions caused by anticipation or presence of pain, or to the activation of nonnociceptive afferents. First, in subjects experiencing pain lasting several minutes discrete, and not widespread, acti-
FIG . 4. Maximal pain intensity plotted against the normalized spatial extent (see METHODS ) of neural clusters showing positive or negative correlations with the individual curve of perceived pain intensity, in subjects injected with ascorbic acid. Lines show linear best fits.
Individual-based analyses, which do not require extensive spatial smoothing, also allow to quantify the extent of activated areas and relate it to psychophysical data. The interindividual variability of the response may in part be responsible for conflicting results obtained in PET studies when group analyses were performed (Jones and Derbyshire 1994; Porro and Cavazzuti 1996). However, some limitations inherent in the adopted fMRI technique must also be underlined. The in-plane spatial resolution, which is in principle on the order of 2–3 mm, may be hampered by signals coming from large veins, draining from potentially wide brain areas (Lai et al. 1993; Segebarth et al. 1994). In this study, care was taken to exclude from the analyses pixels corresponding to visible blood vessels or cortical sulci, where large veins are often encountered (e.g., Yousry et al. 1996). Although intraparenchimal small veins and venules obviously contribute to the observed signal changes, the activation of adjacent cortical areas such as MI and SI may be clearly differentiated with similar fMRI techniques (Porro et al. 1996). The temporal resolution of fMRI is otherwise limited by the time constant of the hemodynamic response (Friston et al. 1994; Kwong et al. 1992) and by the hardware and software configuration of the scanner. The main disadvantage of the adopted fMRI technique was that signals from only two planes could be imaged at a reasonable temporal resolution. We focused on the hemisphere contralateral to the injected site, where most rCBF changes are known to occur during brief noxious input (Casey et al. 1994, 1996; Coghill et al. 1994; Hsieh et al. 1995a; Jones et al. 1991; Talbot et al. 1991). However, additional fMRI studies characterized by higher acquisition speed (Kwong 1995) will allow to include areas not investigated in the present work, such as the anterior insula and secondary somatosensory cortex (Coghill et al. 1994; Dong
/ 9k2e$$no39 J424-8
FIG . 5. Time profiles of the mean changes of fMRI signal intensity in neural clusters displaying increases (SI, anterior cingulate) or decreases (perigenual cingulate, medial prefrontal cortex) significantly related to the individual psychophysical pain intensity curve, in subjects subcutaneously injected with ascorbic acid. Arrows: ‘‘warning’’ signal (cleaning the skin with an antiseptic solution). Vertical lines indicate time of injection.
11-18-98 22:30:57
neupa
LP-Neurophys
3318
PORRO, CETTOLO, FRANCESCATO, AND BARALDI
counting contributed to the observed results because they had conceivably a different time course than pain intensity (namely, either remained unchanged or increased over time after stimulation). On the other hand, it is worth noting that the identified neural populations displayed significant signal changes (although of lower intensity) even during anticipation of the impending stimulus, suggesting that their activity can be modulated by attentional and emotional factors. Cortical circuits showing changes of activity time-related to the perceived pain intensity
FIG . 6. Comparison of the normalized spatial extent of regions displaying fMRI signal changes significantly related to the mean pain intensity profile of the ascorbic acid group, in volunteers subjected to different kinds of stimuli. Pos and Neg: clusters of pixels displaying positive or negative correlations, respectively. ●, significantly different from the control group, analysis of variance (ANOVA) / Duncan test, P õ 0.05; n, significantly different from the saline group, ANOVA / Duncan test, P õ 0.05.
vated clusters were found. Second, the spatial extent of cortical areas showing significant changes was related to the individual maximal intensity of perceived pain. Third, the mean time course of the response was different from that of heart rate, a vegetative index of arousal. Indeed, only a minor fraction of the neural clusters encoding pain intensity could also be identified by cross-correlation with the heart rate profile. Fourth, cortical activity changes of similar entity and time courses were not found after nonnoxious or mild, shortlasting noxious stimulation in subjects who were unaware of the kind of impending stimulus. Were the observed fMRI signal changes, in subjects receiving ascorbic acid, related to stimulation of nonnociceptive slowly adapting receptors or to pain experience per se, irrespective of its magnitude and duration, the mean extent of the cortical response would have been similar in the saline and ascorbic acid groups. It is also unlikely that factors such as memory load or silent
/ 9k2e$$no39 J424-8
Different cortical areas, which are likely to subserve different functions, showed fMRI signal changes significantly related to pain intensity. The activation of the primary somatosensory cortex is consistent with a role for this region in sensory-discriminative aspects of pain (Backonja 1996; Kenshalo and Willis 1991), at least at suprathreshold intensity levels. However, pain intensity coding appears to occur in parallel cortical channels receiving inputs either from the ‘‘lateral’’ ascending system (parietal cortex) or the ‘‘medial’’ system (e.g., anterior cingulate) (Albe-Fessard et al. 1985; Craig 1994). Information regarding pain intensity may be conveyed to anterior cingulate by medial thalamic neurons (Bushnell and Duncan 1989), and, indeed, a linear relationship between peak hemodynamic changes and pain intensity during brief transcutaneous electrical stimulation of the median nerve was reported in a recent fMRI work in the posterior part of the anterior cingulate cortex (Davis et al. 1997). The anterior cingulate includes different subregions and may be associated with several functions, including affective aspects of pain (Devinsky et al. 1995; Picard and Strick 1996; Rainville et al. 1997). Interestingly, the mean coordinates of sites showing significant changes in this study closely correspond to foci of activation found in PET studies during acute noxious stimulation (Casey et al. 1994; Jones et al. 1991; Talbot et al. 1991), a perceived illusion of pain (Craig et al. 1996) or chronic neuropathic pain (Hsieh et al. 1995b). The presence of activated clusters in primary motor and medial premotor (SMA) areas confirms and extends the results of previous PET studies (e.g., Casey et al. 1996; Coghill et al. 1994; Hsieh et al. 1995a; Peyron et al. 1998) and it may be related to the organization (or inhibition) of motor reactions to noxious input (see also Hsieh et al. 1994). Decreases in brain fMRI signals during acute pain were previously described (Apkarian 1995). Although their exact physiological significance is yet to be clarified, it is worth mentioning that several areas showing mainly negatively correlated clusters, such as the ventromedial prefrontal, medial parietal, and posterior cingulate cortex, also displayed reduced rCBF during acute (Coghill et al. 1994; Vogt et al. 1996) and chronic (Hsieh et al. 1995b) pain as well as during active visual tasks relative to passive viewing of the same stimuli (Shulman et al. 1997). These hemodynamic changes may reflect shifts of activity in structures involved in monitoring the environment or the self (Damasio 1994). Neural changes in the medial prefrontal–perigenual cingulate cortex are of particular interest, given the extensive connections of these regions with components of the limbic
11-18-98 22:30:57
neupa
LP-Neurophys
F MRI
AND PAIN
system (Devinsky et al. 1995; Fuster 1989) and their likely involvement in mood regulation (Drevets et al. 1997; George et al. 1995; LeDoux 1996; Mayberg 1997). Interestingly, pain intensity and unpleasantness may closely covary during different kinds of pain (Price 1988; Wade et al. 1996). Our results support the hypothesis that encoding of pain intensity may be a major factor in the regulation of emotional and autonomic responses (Duncan et al. 1992). Another interesting issue concerns the relationship between the spatial extent of neural changes and pain intensity. Different sources of evidence suggest that both the frequency of impulse discharges and the total number of central neurons activated are critical for encoding noxious events and discriminating their intensity (Price 1988). At the spinal cord level, it has been shown by 2-deoxyglucose autoradiography in the rat that nonnoxious stimulation is associated with more delimited increases in glucose metabolic rates than noxious input; moreover, higher intensities of noxious stimulation induce wider metabolic changes (Coghill et al. 1993). Our demonstration of a relationship between the spatial extents of the identified clusters in specific cortical regions and peak intensities of perceived pain, and of a greater extent of the response in the group experiencing higher pain levels, is in line with the hypothesis that neural recruitment mechanisms are important for pain intensity coding. The authors thank P. E. di Prampero and M. Bazzocchi for valuable support to the project and L. Bon, M. E. Diamond, D. Mostofsky, P. Nichelli, and G. Pagnoni for helpful discussions. Supported by grants from Consiglio Nazionale delle Ricerche and Ministero dell’Universita` e della Ricera Scientifica e Technologia, Italy, to C. A. Porro. Address for reprint requests: C. A. Porro, Dip. Scienze e Tecnologie Biomediche, Universita` di Udine, P.le Kolbe 5, I-33100 Udine, Italy. Received 3 June 1998; accepted in final form 5 August 1998. REFERENCES ALBE-FESSARD, D., BERKLEY, K. J., KRUGER, L., RALSTON, H. J., AND WILLIS, W. D. Diencephalic mechanisms of pain sensation. Brain Res. Rev. 9: 217–296, 1985. APK ARIAN, A. V. Functional imaging of pain: new insights regarding the role of the cerebral cortex in human pain perception. Semin. Neurosci. 7: 279–293, 1995. BACKONJA, M. Primary somatosensory cortex and pain perception. Pain Forum 5: 174–180, 1996. BANDETTINI, P. A., JESMANOWICZ, A., WONG, E. C., AND HYDE, J. S. Processing strategies for time course data sets in functional MRI of the human brain. Magn. Reson. Med. 30: 161–173, 1993. BANDETTINI, P. A., KWONG, K. K., DAVIS, T. L., TOOTELL, R.B.H., WONG, E. C., FOX, P. T., BELLIVEAU, J. W., WEISSKOFF, R. M., AND ROSEN, B. R. Characterization of cerebral blood oxygenation and flow changes during prolonged brain activation. Hum. Brain Mapp. 5: 93–109, 1997. BUSHNELL, M. C. AND DUNCAN, G. H. Sensory and affective aspects of pain perception: is medial thalamus restricted to emotional issues? Exp. Brain Res. 78: 415–418, 1989. CASEY, K. L., MINOSHIMA, S., BERGER, K. L., KOEPPE, R. A., MORROW, T. J., AND FREY, K. A. Positron emission tomographic analysis of cerebral structures activated specifically by repetitive noxious heat stimuli. J. Neurophysiol. 71: 802–807, 1994. CASEY, K. L., MINOSHIMA, S., MORROW, T. J., AND KOEPPE, R. A. Comparison of human cerebral activation patterns during cutaneous warmth, heat pain, and deep cold pain. J. Neurophysiol. 76: 571–581, 1996. COGHILL, R. C., MAYER, D. J., AND PRICE, D. D. The roles of spatial recruitment and discharge frequency in spinal cord coding of pain. A combined electrophysiological and imaging investigation. Pain 53: 295–309, 1993. COGHILL, R. C., TALBOT, J. D., EVANS, A. C., MEYER, E., GJEDDE, A.,
/ 9k2e$$no39 J424-8
3319
BUSHNELL, M. C., AND DUNCAN, G. H. Distributed processing of pain and vibration by the human brain. J. Neurosci. 14: 4095–4108, 1994. COHEN, M. S. AND BOOKHEIMER, S. Y. Localization of brain function using magnetic resonance imaging. Trends Neurosci. 17: 268–276, 1994. COX, R. W. AFNI software for analysis and visualization of functional magnetic resonance neuroimages. Comput. Biomed. Res. 29: 162–173, 1996. CRAIG, A. D. Spinal and supraspinal processing of specific pain and temperature. In: Touch, Temperature and Pain in Health and Disease: Mechanisms and Assessments, edited by J. Boivie, P. Hansson, and U. Lindblom. Seattle, WA: IASP Press, 1994, p. 421–437. CRAIG, A. D., REIMAN, E. M., EVANS, A., AND BUSHNELL, M. C. Functional imaging of an illusion of pain. Nature 384: 258–260, 1996. DAMASIO, A. R. Descartes’ Error. New York: Putnam, 1994. DAVIS, K. D., TAYLOR, S. J., CRAWLEY, A. P., WOOD, M. L., AND MIKULIS, D. J. Functional MRI of pain- and attention-related activations in the human cingulate cortex. J. Neurophysiol. 77: 3370–3380, 1997. DEVINSKY, O., MORRELL, M. J., AND VOGT, B. A. Contributions of anterior cingulate cortex to behavior. Brain 118: 279–306, 1995. DONG, W. K., CHUDLER, E. H., SUGIYAMA, K., ROBERTS, V. J., AND HAYASHI, T. Somatosensory, multisensory, and task-related neurons in cortical area 7b (PF) of unanesthetized monkeys. J. Neurophysiol. 72: 542– 564, 1994. DREVETS, W. C., PRICE, J. L., SIMPSON, J. R., TODD, R. D., REICH, T., VANNIER, M., AND RAICHLE, M. E. Subgenual prefrontal cortex abnormalities in mood disorders. Nature 386: 824–827, 1997. DUNCAN, G. H., BUSHNELL, M. C., TALBOT, J. D., EVANS, A. C., MEYER, E., AND MARRETT, S. Localization of responses to pain in human cerebral cortex (Reply). Science 255: 215–216, 1992. FOX, P. T., BURTON, H., AND RAICHLE, M. Mapping human somatosensory cortex with positron emission tomography. J. Neurosurg. 67: 34–43, 1987. FRAHM, J., MERBOLDT, K.-D., AND HANICKE, W. Functional MRI of human brain activation at high spatial resolution. Magn. Reson. Med. 29: 139– 144, 1993. FRISTON, K. J., JEZZARD, P., AND TURNER, R. Analysis of functional MRI time series. Hum. Brain Mapp. 1: 153–171, 1994. FUSTER, J. M. The Prefrontal Cortex. New York: Raven, 1989. GEORGE, M. S., KETTER, T. A., PAREKH, P. I., HORWITZ, B., HERSCOVITCH, P., AND POST, R. M. Brain activity during transient sadness and happiness in healthy women. Am. J. Psychiatry 152: 341–351, 1995. HSIEH, J. C., BELFRAGE, M., STONE-ELANDER, S., HANSSON, P., AND INGVAR, M. Central representation of chronic ongoing neuropathic pain studied with positron emission tomography. Pain 63: 225–236, 1995b. ¨ ., STA˚HLE-BA¨CKDAHL, M., ERICSON, K., ERIKSHSIEH, J. C., HA¨GERMARK, O SON, L., STONE-ELANDER, S., AND INGVAR, M. Urge to scratch represented in the human cerebral cortex during itch. J. Neurophysiol. 72: 3004– 3008, 1994. ¨ ., STONE-ELANDER, S., HSIEH, J. C., STA˚HLE-BA¨CKDAHL M., HA¨GERMARK O ROSENQUVIST, G., AND INGVAR, M. Traumatic nociceptive pain activates the hypothalamus and the periacqueductal gray: a positron emission tomography study. Pain 64: 303–314, 1995a. JONES, A.K.P., BROWN, W. D., FRISTON, K. J., QI, L. Y., AND FRACKOWIAK, R.S.J. Cortical and subcortical localization of response to pain in man using positron emission tomography. Proc. R. Soc. Lond. Biol. Sci. 244: 39–44, 1991. JONES, A.K.P. AND DERBYSHIRE, S.W.G. Positron emission tomography as a tool for understanding the cerebral processing of pain. In: Touch, Temperature and Pain in Health and Disease: Mechanisms and Assessments, edited by J. Boivie, P. Hansson, and U. Lindblom. Seattle, WA: IASP Press, 1994, p. 491–520. JONES, A.K.P. AND DERBYSHIRE, S.W.G. Cerebral mechanisms operating in the presence and absence of inflammatory pain. Ann. Rheum. Dis. 55: 411–420, 1996. KENSHALO, D. R., CHUDLER, E. H., ANTON, F., AND DUBNER, R. SI nociceptive neurons participate in the encoding process by which monkeys perceive the intensity of noxious thermal stimulation. Brain Res. 454: 378– 382, 1988. KENSHALO, D. R. AND WILLIS, W. D. The role of the cerebral cortex in pain sensation. In: Cerebral Cortex, edited by A. Peters and E. G. Jones. New York: Plenum, 1991, vol. 9, p. 153–212. KWONG, K. K. Functional magnetic resonance imaging with echo planar imaging. Magn. Reson. Quart. 11: 1–13, 1995. KWONG, K. K., BELLIVEAU, J. W., CHESLER, D. A., GOLDBERG, I. E., WEIS-
11-18-98 22:30:57
neupa
LP-Neurophys
3320
PORRO, CETTOLO, FRANCESCATO, AND BARALDI
SKOFF, R. M., PONCELET, B. P., KENNEDY, D. N., HOPPEL, B. E., COHEN, M. S., TURNER, T., CHENG, H.-M., BRADY, T. J., AND ROSEN, B. R. Dynamic magnetic resonance imaging of human brain activity during primary sensory stimulation. Proc. Natl. Acad. Sci. USA 89: 5675–5679, 1992. LAI, S., HOPKINS, A. L., HAACKE, E. M., LI, D., WASSERMANN, B. A., BUCKLEY, P., FRIEDMAN, L., MELTZER, H., HEDERA, P., AND FRIEDLAND, R. Identification of vascular structures as a major source of signal contrast in high resolution 2D and 3D functional activation imaging of the motor cortex at 1.5 T: preliminary results. Magn. Reson. Med. 30: 387–392, 1993. LEDOUX, J. The Emotional Brain. New York: Simon & Schuster, 1996. MAYBERG, H. S. Limbic cortical dysregulation. A proposed model of depression. J. Neuropsychiatr. Clin. Neurosci. 9: 471–481, 1997. MELZACK, R. AND CASEY, K. L. Sensory, motivational, and central control determinants of pain. A new conceptual model. In: The Skin Senses, edited by R. Kenshalo, Springfield, IL: Thomas, 1968, p. 423–443. OGAWA, S., LEE, T. M., KAY, A. R., AND TANK, D. W. Brain magnetic resonance imaging with contrast dependent on blood oxygenation. Proc. Natl. Acad. Sci. USA 87: 9868–9872, 1990. PEYRON, R., GARCIA-LARREA, L., GREGOIRE, M. C., CONVERS, P., LAVENNE, F., VEYRE, L., FROMENT, J. C., MAUGUIERE, F., MICHEL, D., AND LAURENT, B. Allodynia after lateral-medullary (Wallenberg) infarct. A PET study. Brain 121: 345–356, 1998. PICARD, N. AND STRICK, P. L. Motor areas of the medial wall: a review of their location and functional activation. Cereb. Cortex 6: 342–353, 1996. PORRO, C. A. AND CAVAZZUTI, M. Spatial and temporal aspects of spinal cord and brainstem activation in the formalin pain model. Prog. Neurobiol. 41: 565–607, 1993. PORRO, C. A. AND CAVAZZUTI, M. Functional imaging studies of the pain system in man and animals. In: Towards the Neurobiology of Chronic Pain, edited by G. Carli and M. Zimmermann. Amsterdam: Elsevier, 1996, p. 47–62. PORRO, C. A., FRANCESCATO, M. P., CETTOLO, V., DIAMOND, M. E., BARALDI, P., ZUIANI, C., BAZZOCCHI, M., AND DI PRAMPERO, P. E. Primary motor and sensory cortex activation during motor performance and motor imagery: a fMRI study. J. Neurosci. 16: 7688–7698, 1996. PRICE, D. D. Psychological and Neural Mechanisms of Pain. New York: Raven, 1988. RADEMACHER, J., CAVINESS, V. S., STEINMETZ, H., AND GALABURDA, A. M. Topographical variation of the human primary cortices: implications for neuroimaging, brain mapping, and neurobiology. Cereb. Cortex 3: 313– 329, 1993.
/ 9k2e$$no39 J424-8
RAINVILLE, P., DUNCAN, G. H., PRICE, D. D., CARRIER, B., AND BUSHNELL, M. C. Pain affect encoded in human anterior cingulate but not somatosensory cortex. Science 277: 968–971, 1997. SEGEBARTH, C., BELLE, V., DELON, C., MASSARELLI, R., DECETY, J., LEBAS, J.-F., DECORPS, M., AND BENABID, A. L. Functional MRI of the human brain: predominance of signals from extracerebral veins. Neuroreport 5: 813–816, 1994. SHULMAN, G. L., FIEZ, J. A., CORBETTA, M., BUCKNER, R. L., MIEZIN, F. M., RAICHLE, M. E., AND PETERSEN, S. E. Common blood flow changes across visual tasks: II. Decreases in cerebral cortex. J. Cogn. Neurosci. 9: 648– 663, 1997. SIKES, R. W. AND VOGT, B. A. Nociceptive neurons in area 24 of rabbit cingulate cortex. J. Neurophysiol. 68: 1720–1732, 1992. SNOW, P. J., LUMB, B. M., AND CERVERO, F. The representation of prolonged and intense, noxious somatic and visceral stimuli in the ventrolateral orbital cortex of the cat. Pain 48: 89–99, 1992. SVENSSON, P., JOHANNSEN, P., JENSEN, T. S., ARENDT-NIELSEN, L., NIELSEN, J., STØDKILDE-JØRGENSEN, H., GEE, A. D., BAARSGAARD HANSEN, S., AND GJEDDE, A. Cerebral representation of graded painful phasic and tonic heat in humans: a positron emission tomography study. In: Proceedings of the 8th World Congress on Pain, edited by T. S. Jensen, J. A. Turner, and Z. Wiesenfeld-Hallin, Seattle: IASP Press, 1997, p. 867– 878. TALAIRACH, J. AND TOURNOUX, P. Co-planar Stereotaxic Atlas of the Human Brain. New York: Thieme, 1988. TALBOT, J. D., MARRETT, S., EVANS, A. C., MEYER, E., BUSHNELL, M. C., AND DUNCAN, G. H. Multiple representations of pain in human cerebral cortex. Science 251: 1355–1358, 1991. VOGT, B. A., DERBYSHIRE, S., AND JONES, A.K.P. Pain processing in 4 regions of human cingulate cortex localized with coregistered PET and MR imaging. Eur. J. Neurosci. 8: 1461–1473, 1996. VOGT, B. A., NIMCHINSKY, E. A., VOGT, L. J., AND HOF, P. R. Human cingulate cortex: surface features, flat maps, and cytoarchitecture. J. Comp. Neurol. 359: 490–506, 1995. WADE, J. B., DOUGHERTY, L. M., ARCHER, C. R., AND PRICE, D. D. Assessing the stages of pain processing: a multivariate statistical approach. Pain 68: 157–167, 1996. XIONG, J., GAO, J.-H., LANCASTER, J. L., AND FOX, P. T. Clustered pixel analysis for functional MRI activation studies of the human brain. Hum. Brain Mapp. 3: 287–301, 1995. YOUSRY, T. A., SCHMID, U. D., SCHMIDT, D., HAGEN, T., JASSOY, A., AND REISER, M. F. The central sulcal vein: a new landmark identifying the central sulcus by functional MRI. J. Neurosurg. 85: 608–617, 1996.
11-18-98 22:30:57
neupa
LP-Neurophys