However, the thinnest blade of a diamond saw available now is around 20 microns, which limits the frequency range of the composite transducers made by dice ...
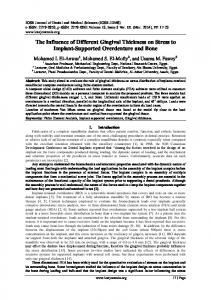
Finite element study on random design of 2-2 composite transducer Wenkang Qi and Wenwu Cao Whitaker Center for Medical Ultrasonic Transducer Engineering Materials Research Laboratory The Pennsylvania State University, university park, Pennsylvania, 16802 ABSTRACT Random 2-2 composite transducers are studied using FEM(ANSYS®). Admittance curves as well as beam patterns in the nearfield are calculated and used to evaluate the performance of random 2-2 composite designs. First, the pressure and the normal velocity distributions at the interface of water and transducer are calculated using ANSYS, then, these pressure and velocity data are used to calculate the beam pattern using Helmholtz integral. Different random configurations are studied and the results are discussed.
Keywords: ultrasound, transducer, composite, piezoelectric, FEM.
1. INTRODUCTION Piezoelectric composite has advantages over single phase piezoelectric ceramics and polymer materials for transducer applications[6I. It has lower acoustic impedance than that of ceramic, higher electromechanical coupling coefficient and lower Q than that of pure ceramic and much higher sensitivity than the piezoelectric polymer. But at high frequencies, its periodic structure causes spurious lateral modes, which interfere the thickness resonance. The coupling of these lateral modes with the thickness mode will reduce the thickness electromechanical coupling coefficient and prolong the ringdown. Conventional method to eliminate the coupling is to reduce the pitch size so that the lateral resonance is pushed up to twice of the thickness resonance frequency[71. However, the thinnest blade of a diamond saw available now is around 20 microns, which limits the frequency range of the composite transducers made by dice and fill technique to less than 20 MHz. It is shown that the lateral resonance may be destroyed by introducing randomness into the composite structure[8°I. In this paper, we further investigate this idea by introducing randomness into the polymer phase in low ceramic percentage composite. Various random patterns have been tested, and the beam pattern in the nearfield is studied by using ANSYS® combined with direct integration of the Helmholtz equation[1fl.
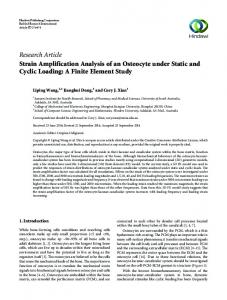
2. RESONANCE MODES IN 2-2 COMPOSITE Fig. 1 shows the thickness mode [Fig.! (B)] and the lateral mode[Fig. 1(C)]. This lateral mode shown in Fig 1(C) is the first lateral pitch resonance, in which the ceramic and polymer constituents are vibrating out of phase. This transducer is designed to have 44% PZT ceramic and the filler is spurs epoxy. The dimensions are: thickness 1.12mm, ceramic width 0.273mm, polymer width 0.362mm.
(c) The lateral anti resonance mode at I - ...
Fig.l
176
SPIE Vol. 3037 • 0277-786X/97/$1 0.00
Downloaded from SPIE Digital Library on 18 Feb 2010 to 146.186.113.216. Terms of Use: http://spiedl.org/terms
Fig.2 (a) and (b) are admittance curves from ANSYS calculation and experiment, respectively. The two peaks represent the thickness and the pitch resonance, respectively. We can see that the two modes strongly couple to each other in this design. In this case, the thickness coupling coefficient is rather low, k 0.5. In order to suppress the pitch resonance, we randomize the width of the kerfs which are filled with polymer. Fig. 3 shows the
admittance curve for the case of 100% random kerf width. Although the electric admittance of random composite shows encouraging results, we need to further examine the performance of this random composite by considering the beam pattern.
i.--..,.-.i..—-.-i...-i...
100
f'.
U,
C
100
Admittance
U,
E 10 U, Cl)
U,
Cl
C
V6 4 100
0.1 1.2
1.6 1.8
2 Frequency(MHz)
1.4
2.2
2.4
50
0
V a,
-50
1.2 1.4
2 Frequency(MHz) 1.6
1.8
2.2 2.4
-100
Fig.2 (a) The admittance curve of a 33 layer periodic 2-2 composite calculated by FEM. (b) The measured admittance curve of a 33 layer periodic 2-2 composite.
60 40
...i;
100 U,
C
20 0
:
20
V
4O ' -60 -80 0.1
-100 1
1.5 2 Frequency(M Hz)
2.5
Fig.3 The calculated admittance of a 33 layer random 2-2 composite using ANSYS®
3. BEAM PATTERN In medical imaging, we are interested in the beam characteristics in vicinity of the focal point, which is different from sonar applications. In order to accurately calculate the beam pattern, we have to consider the effect of water loading. This can be accomplished by using Fluid Structure Interface element in ANSYS®. Harmonic analysis using FEM can provide pressure distribution as well as normal velocity distribution at the interface. These distributions will then be used to do the Helmholtz integral to calculate the nearfiled beam pattern. Since the Green's function and its derivative have some singularity points at the
177
Downloaded from SPIE Digital Library on 18 Feb 2010 to 146.186.113.216. Terms of Use: http://spiedl.org/terms
integration surface, we can not do the integration in the original coordinate plane. Coordinate transformation has been performed
to resolve the singularity problem. This procedure has been applied to calculate the beam pattern for the random composite transducer and the result is shown in Fig. 4.
Fig.4 The beam pattern of a 33 layer random composite transducer immersed in water.
One can see several problems with this design: First, because the transducer is not symmetric in the x-direction, we lose the symmetry of the beam pattern. This is not desirable in medical imaging application since it causes imaging distortion. Second, although theoretically we can randomize the kerf, it is not feasible to dice with too many different kerfs in practice. Third, the beam width is wider than that of a periodic composite transducer, which means this design will not have better lateral resolution. The first problem can be overcome by introducing symmetry in the x-direction while keeping the random kerfs in half of the composite. The beam pattern produced by the symmtrized random composite is shown in Fig.5. We can see that the beam pattern becomes symmetric again.
Fig.5 The nearfield of the random composite with symmetry in the x-direction.
However for the second and third problem, we have to investigate other random designs. From FEM study, we found that it is not necessary to randomize every kerf, instead, a repeated sequence of different size kerfs can give reasonable reduction of the lateral mode. Figs. 6(a-e) are admittance curves of 2-2 composites with 33 cells and different sequential kerf configurations [Note that all the configurations have symmetry in the x-direction to keep the beam pattern symmetric].
In Fig.6(a), the first 16 kerfs are randomly chosen with a fixed volume percentage of ceramic, while the last 16 kerfs are obtained from mirror symmetry of the first 16 kerfs. The 17th is set equal to the first one. In Fig.6(b), the first 5 kerfs are randomly chosen, then repeat this pattern 3 times, the 16th is the same as the first one and the 17th is the same as thesecond. The other 16 kerfs are mirror symmetry of the first 16. In Fig.6(c), the first 4 kerfs are random, and the pattern is repeated 4 times, while the 17th is equal to the first. The other 16 kerfs are mirror symmetry of the first 16. In Fig.6(d), the first 3kerfs are random, and then repeat this pattern 5 times, the 16th is equal to the first, while the 17th is equal to the second. In Fig.6(e), the first 2 kerfs have different sizes, and then the pattern is repeated 8 times, the 17th is equal to the first. The other 16 kerfsare mirror symmetry of the first 16.
178
Downloaded from SPIE Digital Library on 18 Feb 2010 to 146.186.113.216. Terms of Use: http://spiedl.org/terms
As we can see in Fig.6(a), the admittance curve is almost the same as that in Fig. 3, in which every kerf size is randomly chosen, except there is a small bump around 1.2MHz. Interestingly, as we reduce the sequential random number from 17 down to 3, little change occurred for the admittance curve. However, when the sequential random number becomes 2, there is a new lateral mode showing clearly in the admittance curve as shown in Fig. 6(e). 100
0
100 ••%
10
50
0
E
V
0
0
C
01
-50
0.01
-100
10
100
50
0
C
E
V
0 Cl)
0
Cl
0.1
E
(b)'-..
4 0.01 100
-50 -100 100
10
50
U)
0
E 0.1 V
-50
E
0
V 0
4
-100 100
0.01 100
50
0
V
CD
-50 .1 flfl 100
50
0 V CD
-50 -100 1.5
2
2.5
Frequency(M Hz)
Fig.6
(a) Sequential number is 16; (b) Sequential number is 5; (c) Sequential number is 4; (d) Sequential number is 3; (e) Sequential number is 2.
As mentioned above, we can not use the admittance curve as the sole criterion, the beam pattern must also be investigated for designing random 2-2 composite transducers.
179
Downloaded from SPIE Digital Library on 18 Feb 2010 to 146.186.113.216. Terms of Use: http://spiedl.org/terms
In Fig.7, the pressure profiles near the focal point were compared for three different sequential numbers 3, 4, and 5. The beam width shows little change. Therefore, there are not much advantages for making higher sequential number composite transducers.
I_ X(cm)
Fig.7 Pressure profile near the focal point for sequential number 3,4,5, respectively.
4. CONCLUSION In a periodic 2-2 composite transducer, lateral modes are produced and they will couple to the thickness mode for high frequency operation. This coupling effect and the manufacture difficulties limit the current frequency range of composite transducer to less than 20 MHz. We show that these lateral modes may be suppressed through randomization of kerf width [3-41.However, FEM analysis shows that the randomization will introduce distortion to the beam pattern. In order to maintain the symmetry of the beam pattern, it is necessary to keep the 22 composite structure symmetric in the x-direction. From practical point of view, it is not feasible to randomize every kerf in a 2-2 composite due to production difficulties. A series of composites with sequential kerf width are explored using FEM. From the calculated admittance curves, the lateral mode can almost be suppressed when the sequential number is 3 or 4. By looking at the nearfield beam pattern, the sequential number 3 is preferred. It is also easier to fabricate for low sequential number than for higher sequential numbers.
ACKNOWLEDGMENT This research is sponsored by ONR under grant number N00014-93-l-0340 and the Whitaker Foundation under special opportunity award.
REFERENCES [1]. RE. Newnham, L.J. Bowen, K.A. Klicker, and L.E. Cross, 'Composite piezoelectric transducer." Materials in Engineering, Vol.2, pp. 93-106, 1980. [2]. WA. Smith, "The role of piezocomposites in ultrasonic transducers," Proc. 1989 IEEE Ultrason. Symp., 1989, pp. 755-766. [3. G. Hayward and iA. Hossack, "Unidimensional modeling of 1-3 composite transducer," Ultrason. mt. 89 Conf. Proc., 1989, pp. 53 1-536.
[4]. HA. Kunkel, etal, "Finite-Element Analysis of Vibration Modes in Piezoelectric Ceramic Disks,", IEEE transaction on ultrasonic, ferroelectrics, and frequency control, Vol. 37, No. 4, July 1990.
[5]. John A. Hossack and Gordon Hayward, "Finite-Element Analysis Of 1-3 Composite Transducers", IEEE transactions on ultrasonic, ferroelectrics, and frequency control, Vol. 38, No.6, Nov. l991.[6]. Anne-Christine, "Finite element modeling of active periodic structures: Application to 1-3 piezocomposites," J. Acoust. Soc. Am. 94(2), Pt. 1, Aug., 1993. [6]. Yukio Kagawa, etal, "Finite Element Simulation of a Composite Piezoelectric Ultrasonic Transducer," IEEE transactions on sonic and ultrasonics, Vol. Su-26, No. 2, Mar. 1979. [7] Smith, W.A., "Modeling 1-3 composite piezoelectric: thickness-mode oscillations", IEEE Trans. Ultrasonic. Ferroelect. Freq. Contr. 38, 40-47(1991).
[8] Hayward, G., and Hossack, iA., "Unidimensional Modelling of 1-3 composite transducer", in 1989 Ultrasonic International Conference Proceeding, PP. 531-536. [9] Wenwu Cao and Wenkang Qi, "Plane wave propagation in finite 2-2 composite", J. Appl.. Phys. Vol. 78, PP. 4627-4632, 1995. [10] Wenwu Cao and Wenkang Qi, "Multisource excitations in a stratified biphase structure",J. Appl. Phys. vol. 78, pp. 4640-4646, 1995. [11] D.T. Wilton. 1978. "Acoustic Radiation and Scattering from Elastic Structures," International Journal for nummerical Methods in Engineering, 13:123-138.
180
Downloaded from SPIE Digital Library on 18 Feb 2010 to 146.186.113.216. Terms of Use: http://spiedl.org/terms