First and second-order features for detection of masses in digital breast tomosynthesis
Ravi K. Samala,1 Jun Wei, Heang-Ping Chan, Lubomir Hadjiiski, Kenny Cha, Mark A. Helvie University of Michigan, 1500 E. Medical Center Drive, Ann Arbor, MI 48109-5842 ABSTRACT We are developing novel methods for prescreening of mass candidates in computer-aided detection (CAD) system for digital breast tomosynthesis (DBT). With IRB approval and written informed consent, 186 views from 94 breasts were imaged using a GE GEN2 prototype DBT system. The data set was randomly separated into training and test sets by cases. Gradient field convergence features based on first-order features were used to select the initial set of mass candidates. Eigenvalues based on second-order features from the Hessian matrix were extracted for the mass candidate locations in the DBT volume. The features from the first- and second-order analysis form the feature vector that was input to a linear discriminant analysis (LDA) classifier to generate a candidate-likelihood score. The likelihood scores were ranked and the top N candidates were passed onto the subsequent detection steps. The improvement between using only first-order features and the combination of first and second-order features was analyzed using a rank-sensitivity plot. 3D objects were obtained with two-stage 3D clustering followed by active contour segmentation. Morphological, gradient field, and texture features were extracted and feature selection was performed using stepwise feature selection. A combination of LDA and rule-based classifiers was used for FP reduction. The LDA classifier output a masslikelihood score for each object that was used as a decision variable for FROC analysis. At breast-based sensitivities of 70% and 80%, prescreening using first-order and second-order features resulted in 0.7 and 1.0 FPs/DBT. Keywords: Digital breast tomosynthesis, computer-aided detection, masses, linear discriminant analysis, gradient field analysis, Eigen value analysis, FROC
1. INTRODUCTION With the increasing use of digital breast tomosynthesis (DBT) in clinical practice1 there is a growing interest in developing computer-aided methods for various stages of DBT interpretation.2 Commercial computer-aided detection (CAD) systems for digital mammography (DM) have been widely used. Potentially the need of CAD systems for DBT is even higher due to the large search space. This is also a challenge for CAD because larger search space results in higher number of false positives (FPs). We have been developing CAD methods for mass 3-5 and microcalcification cluster detection.6-11 We continue to develop new techniques with a larger data set for mass detection in this work. The focus of this study is to improve the prescreening stage using first and second-order features.
2. MATERIALS AND METHODS 2.1 Data set A GE GEN2 prototype DBT system at the University of Michigan was used to acquire DBT images. The prototype system can be set up to acquire DBT with different tomographic angle and angular increments. The data set in this study was collected with a 60° tomographic angle at 3° increments, resulting in 21 projection views. IRB approval and written informed consent were obtained prior to the DBT imaging. For each subject, a craniocaudal (CC) view and a mediolateral oblique (MLO) view were obtained from the breast with a mass recommended for biopsy. A data set comprising a total of 186 views from 94 breasts were used in this study. The data set was split randomly into independent training and test sets by case. The training set contained 47 breasts with 92 views of which 30 were malignant and 58 benign, and the test set contained 47 breasts with 94 views of which 34 were malignant and 60 benign. The DBT volume was reconstructed with an in-plane resolution of 0.1 mm x 0.1 mm and a slice spacing of 1 mm using the simultaneous algebraic reconstruction technique (SART).12 A Mammography Quality Standards Act (MQSA)approved radiologist marked the mass lesion with a 3D bounding box based on all available clinical information. The histogram of BI-RADS breast density for the training and test sets is shown in fig. 1. 1
[email protected] Medical Imaging 2016: Computer-Aided Diagnosis, edited by Georgia D. Tourassi, Samuel G. Armato III, Proc. of SPIE Vol. 9785, 978523 · © 2016 SPIE · CCC code: 1605-7422/16/$18 · doi: 10.1117/12.2216327
Proc. of SPIE Vol. 9785 978523-1 Downloaded From: http://proceedings.spiedigitallibrary.org/ on 03/24/2016 Terms of Use: http://spiedigitallibrary.org/ss/TermsOfUse.aspx
2.2 Computer-aided detection system 50 -
40 -
imam Training set Test set I
I
30 20 10
I
1
2
1
II 3
ISIIiiii
4
BI -RADS breast density
Fig. 1. Distribution of breast density for training and test sets.
DBT volume
Preprocessing
Prescreening
2D & 3D gradient field analysis 3D Eigenvalue analysis
Segmentation Texture features Feature extraction
Morphological features
False positive reduction Detection Fig. 2. Flowchart of CAD for DBT mass detection. Figure 2 illustrates a schematic of the CAD system from preprocessing of an input DBT volume to the detection stage. Breast region from the DBT volume is extracted using breast boundary detection algorithm. The DBT slices are reduced to 400 μm x 400 μm resolution by averaging every 4x4 pixels in the in-plane direction. Potential mass candidates are detected in the prescreening step using first- and second-order features as discussed in Section 2.2. The detected
Proc. of SPIE Vol. 9785 978523-2 Downloaded From: http://proceedings.spiedigitallibrary.org/ on 03/24/2016 Terms of Use: http://spiedigitallibrary.org/ss/TermsOfUse.aspx
candidates are segmented using two-stage 3D clustering followed by active contour segmentation within a volume of interest (VOI) at each candidate location. The in-plane dimension of the VOI is fixed at 51.2 mm x 51.2 mm and the dimension along the in-depth direction is determined using an adaptive-Z approach.5 For each segmented object, morphological and texture features are extracted. A stepwise feature selection method is used to reduce the feature dimensionality. For false positive (FP) reduction, a combination of rule-based classifier and a linear discriminant analysis (LDA) classifier is implemented. 2.3 Prescreening of mass candidates In the prescreening stage mass candidates are detected by thresholding of a ranked list of objects. The objects are ranked based on the candidate-likelihood score, described below. From the ranked list, the top N candidates are selected for further processing. The goal of the prescreening stage is to keep the sensitivity as high as possible and to achieve higher ranks (top of the list) for the true masses. The subsampled DBT volume is first enhanced using a 3D Laplacian operator. First-order gradient feature extraction for 2D DBT slices is preceded with pixel averaging over 2 x 2 pixels. The gradient field is calculated over a circular region of 6 mm radius. The average gradient direction is calculated as a mean over three concentric circles in case of 2D. Similarly, a 3D gradient field convergence map is obtained by generalizing the above procedures to 3D spherical shells in the DBT volume. Both 2D and 3D gradient field convergence maps are generated. The top N locations with the highest values in the 2D and 3D gradient field convergence maps which are greater than two chosen thresholds ( , ) are considered initial set of potential candidates. Eigenvalues and Eigenvectors of the Hessian matrix ( ) has been widely used for shape based enhancement or detection. The Hessian matrix ( ) contains partial second-order derivatives in an image volume, ( , , ). The < < . The Hessian matrix was calculated in the DBT intensity Eigenvalues of are given by , , with volume and the average Eigenvalues ( and ) within a 12 mm x 12 mm x 5 mm region are calculated for all the candidate locations from the 3D gradient field step.
=
(1)
The 3D and 2D gradient field analysis features and the Eigenvalue features are input to an LDA classifier that combines the input features with a linear discriminant function and outputs a new candidate-likelihood score. The new score reorganizes the ranking of the candidates with TP appearing more at the top of the list. 2.4 False positive reduction For each segmented object, morphological and texture features are extracted. A stepwise feature selection method is used to reduce the feature dimensionality. A combination of rule-based classifier and another LDA classifier was trained to merge the input features into a mass-likelihood score. After FP reduction methods were applied to the candidates identified by prescreening, a free response receiver operating characteristic (FROC) curve was generated using the mass-likelihood score for each object as the decision variable. An object is categorized as true positive (TP) if the centroid of the object was within the radiologist marked bounding box and vice versa. For view-based analysis, a mass in each view was considered as a target. For breast-based analysis, a mass in the CC or MLO views of the same breast was considered as a single target.
Proc. of SPIE Vol. 9785 978523-3 Downloaded From: http://proceedings.spiedigitallibrary.org/ on 03/24/2016 Terms of Use: http://spiedigitallibrary.org/ss/TermsOfUse.aspx
1.0
J r
I
Only first order features First and second -order features
---
0.0
10
0
20
30
40
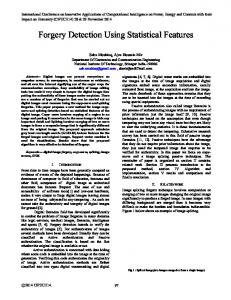
Rank threshold R Fig. 3. Rank-sensitivity plots at the prescreening stage comparing the use of 1st order features alone to that using a combination of 1st and 2nd order features for the training set.
1.0
i
i
-
t
Train: view -based Train: breast -based Test: view -based Test: breast -based
0.2
0.0
0
1 2 Mean No. of FPs per DBT volume
3
Fig. 4. FROC curves for training and test sets using a combination of the first- and second-order features at prescreening. View-based and breast-based curves are shown. FPs: false positives.
3. RESULTS The performance at the prescreening stage was evaluated by a rank sensitivity plot.13 The mass candidates were ranked based on the candidate-likelihood scores. The vertical axis represented the fraction (F) of DBT volumes that would have a correctly localized lesion when the candidate objects up to a given rank threshold R were kept as plotted in the horizontal axis. Similar to the FROC curve, the best rank-sensitivity plot is the one towards the top left corner. Figure 3 shows the curve using a combination of the first- and second-order features has better ranked list than using the firstorder features alone. For the test set, at the prescreening stage, 90% of the DBT masses were detected in the list of top
Proc. of SPIE Vol. 9785 978523-4 Downloaded From: http://proceedings.spiedigitallibrary.org/ on 03/24/2016 Terms of Use: http://spiedigitallibrary.org/ss/TermsOfUse.aspx
40 candidates. The rest of the TP objects were detected but are beyond the top N list. The view-based and breast-based FROC curves were shown in fig. 4. At 70% and 80% sensitivities, the CAD system had 1.3 and 2.7 FPs per DBT volume from the view-based FROC curve and 0.7 and 1.0 FPs per DBT volume from the breast-based FROC curve. The example in figure 5(c) was detected as the 59th object when ranked based on the candidate likelihood score resulting in missing of the TP.
4. DISCUSSION AND CONCLUSION Addition of DBT to DM has been shown to improve sensitivity and specificity of breast cancer detection over DM in clinical trials.14-20 CAD systems are expected to play an important role to utilize the DBT volumetric information while maintaining the workflow in clinical practice. CAD systems can assist in detection, diagnosis or be used as supplemental tools in the generation of “synthetic” mammogram.21, 22 The potential applications of computer-assisted tools for DBT interpretation are at a preliminary stage3, 23. The current study attempts to improve the prescreening sensitivity of CAD system for masses in DBT volumes. This work shows that the combination of first-order and second-order based features is more effective in identifying screening mass candidates compared to the use of first-order based features alone. By generating a candidate-likelihood score using first and second-order features of mass candidates, the TP objects would acquire higher ranking in the list of candidate objects and therefore increase the chance of being kept as candidate objects without retaining a large number of FPs. Improving the sensitivity and specificity of the prescreening step impacts the overall performance of the CAD system.
(a) DBT slice# 47
(b) DBT slice# 44
(c) DBT slice# 30
Fig. 5. Examples (a) and (b) are detected lesions and example (c) is missed lesion at the prescreening stage from the training set.
Proc. of SPIE Vol. 9785 978523-5 Downloaded From: http://proceedings.spiedigitallibrary.org/ on 03/24/2016 Terms of Use: http://spiedigitallibrary.org/ss/TermsOfUse.aspx
ACKNOWLEDGMENTS This work is supported by National Institutes of Health grant number RO1 CA151443. The digital breast tomosynthesis system was developed by the GE Global Research Group, with input and some revisions from the University of Michigan investigators, through the Biomedical Research Partnership (USPHS grant CA91713, PI: Paul Carson, Ph.D.) collaboration. The content of this paper does not necessarily reflect the position of the funding agencies and no official endorsement of any equipment and product of any companies mentioned should be inferred.
REFERENCES [1] [2] [3] [4] [5] [6] [7] [8] [9] [10] [11] [12] [13] [14]
[15]
L. A. Hardesty, S. M. Kreidler, and D. H. Glueck, “Digital Breast Tomosynthesis Utilization in the United States: A Survey of Physician Members of the Society of Breast Imaging,” Journal of the American College of Radiology, 11(6), 594-9 (2014). I. Sechopoulos, “A review of breast tomosynthesis. Part II. Image reconstruction, processing and analysis, and advanced applications,” Medical physics, 40(1), 014302 (2013). H.-P. Chan, J. Wei, B. Sahiner, E. A. Rafferty, T. Wu, M. A. Roubidoux, R. H. Moore, D. B. Kopans, L. M. Hadjiiski, and M. A. Helvie, “Computer-aided detection system for breast masses on digital tomosynthesis mammograms - Preliminary experience,” Radiology, 237, 1075-1080 (2005). H.-P. Chan, J. Wei, Y. H. Zhang, M. A. Helvie, R. H. Moore, B. Sahiner, L. Hadjiiski, and D. B. Kopans, “Computer-aided detection of masses in digital tomosynthesis mammography: Comparison of three approaches,” Medical Physics, 35(9), 4087-4095 (2008). J. Wei, H.-P. Chan, B. Sahiner, L. M. Hadjiiski, M. A. Helvie, C. Zhou, and Y. Lu, “Computer-aided detection of breast masses in digital breast tomosynthesis (DBT): improvement of false positive reduction by optimization of object segmentation,” Proc. SPIE, 7963, 796311-796311-6 (2011). R. K. Samala, H.-P. Chan, Y. Lu, L. M. Hadjiiski, J. Wei, and M. A. Helvie, “Computer-aided detection system for clustered microcalcifications in digital breast tomosynthesis using joint information from volumetric and planar projection images,” Physics in medicine and biology, 60(21), 8457 (2015). R. K. Samala, H.-P. Chan, Y. Lu, L. Hadjiiski, J. Wei, B. Sahiner, and M. A. Helvie, “Computer-aided detection of clustered microcalcifications in multiscale bilateral filtering regularized reconstructed digital breast tomosynthesis volume,” Medical Physics, 41(2), 021901 (2014). J. Wei, H.-P. Chan, L. M. Hadjiiski, M. A. Helvie, Y. Lu, C. Zhou, and R. K. Samala, “Multi-channel response analysis on 2D projection views for detection of clustered microcalcifications in digital breast tomosynthesis,” Medical Physics, 41, 041913 (2014). R. K. Samala, H.-P. Chan, Y. Lu, L. Hadjiiski, J. Wei, and M. A. Helvie, “Digital breast tomosynthesis: computer-aided detection of clustered microcalcifications on planar projection images,” Physics in medicine and biology, 59, 7457-7477 (2014). R. K. Samala, H.-P. Chan, Y. Lu, L. Hadjiiski, J. Wei, and M. Helvie, “Comparison of computer-aided detection of clustered microcalcifications in digital mammography and digital breast tomosynthesis,” Proc. SPIE, 9414, 94140K-94140K-7 (2015). R. K. Samala, H.-P. Chan, Y. Lu, L. Hadjiiski, J. Wei, and M. Helvie, “Digital breast tomosynthesis: application of 2D digital mammography CAD to detection of microcalcification clusters on planar projection image,” Proc. SPIE, 9414, 9414181-9414187 (2015). Y. Zhang, H.-P. Chan, B. Sahiner, J. Wei, M. M. Goodsitt, L. M. Hadjiiski, J. Ge, and C. Zhou, “A comparative study of limited-angle cone-beam reconstruction methods for breast tomosynthesis,” Medical Physics, 33(10), 3781-3795 (2006). B. Sahiner, H.-P. Chan, L. M. Hadjiiski, M. A. Helvie, J. Wei, C. Zhou, and Y. Lu, “Computer-aided detection of clustered microcalcifications in digital breast tomosynthesis: A 3D approach,” Medical Physics, 39(1), 28-39 (2012). S. Ciatto, N. Houssami, D. Bernardi, F. Caumo, M. Pellegrini, S. Brunelli, P. Tuttobene, P. Bricolo, C. Fantò, M. Valentini, S. Montemezzi, and P. Macaskill, “Integration of 3D digital mammography with tomosynthesis for population breast-cancer screening (STORM): a prospective comparison study,” The Lancet Oncology, 14(7), 583-589 (2013). P. Skaane, A. I. Bandos, R. Gullien, E. B. Eben, U. Ekseth, U. Haakenaasen, M. Izadi, I. N. Jebsen, G. Jahr, and M. Krager, “Comparison of digital mammography alone and digital mammography plus tomosynthesis in a population-based screening program,” Radiology, 267(1), 47-56 (2013).
Proc. of SPIE Vol. 9785 978523-6 Downloaded From: http://proceedings.spiedigitallibrary.org/ on 03/24/2016 Terms of Use: http://spiedigitallibrary.org/ss/TermsOfUse.aspx
[16] [17]
[18] [19] [20] [21] [22] [23]
S. L. Rose, A. L. Tidwell, L. J. Bujnoch, A. C. Kushwaha, A. S. Nordmann, and R. Sexton, “Implementation of Breast Tomosynthesis in a Routine Screening Practice: An Observational Study,” American Journal of Roentgenology, 200(6), 1401-1408 (2013). P. Skaane, A. I. Bandos, R. Gullien, E. B. Eben, U. Ekseth, U. Haakenaasen, M. Izadi, I. N. Jebsen, G. Jahr, M. Krager, and S. Hofvind, “Prospective trial comparing full-field digital mammography (FFDM) versus combined FFDM and tomosynthesis in a population-based screening programme using independent double reading with arbitration,” European Radiology, 23(8), 2061-2071 (2013). S. M. Friedewald, E. A. Rafferty, S. L. Rose, and et al., “Breast cancer screening using tomosynthesis in combination with digital mammography,” JAMA, 311(24), 2499-2507 (2014). E. S. McDonald, A. Oustimov, S. P. Weinstein, M. B. Synnestvedt, M. Schnall, and E. F. Conant, “Effectiveness of digital breast tomosynthesis compared with digital mammography: Outcomes analysis from 3 years of breast cancer screening,” JAMA oncology, (2016). S. Vedantham, A. Karellas, G. R. Vijayaraghavan, and D. B. Kopans, “Digital Breast Tomosynthesis: State of the Art,” Radiology, 277(3), 663-684 (2015). J. Wei, H.-P. Chan, M. A. Helvie, M. A. Roubidoux, C. H. Neal, L. Hadjiyski, C. Zhou, and R. K. Samala, “Synthesized 2D Mammogram from Digital Breast Tomosynthesis (DBT) as a Preview Image: A Pilot Observer Study,” RSNA Program Book, BR249-SD-TUB4, (2015). H. Homann, F. Bergner, and K. Erhard, “Computation of synthetic mammograms with an edge-weighting algorithm,” Proc. SPIE, 9412, 94121Q-94121Q-7 (2015). L. Morra, D. Sacchetto, M. Durando, S. Agliozzo, L. A. Carbonaro, S. Delsanto, B. Pesce, D. Persano, G. Mariscotti, and V. Marra, “Breast Cancer: Computer-aided Detection with Digital Breast Tomosynthesis,” Radiology, 277(1), 56-63 (2015).
Proc. of SPIE Vol. 9785 978523-7 Downloaded From: http://proceedings.spiedigitallibrary.org/ on 03/24/2016 Terms of Use: http://spiedigitallibrary.org/ss/TermsOfUse.aspx