May 18, 2011 ... 1.2 Making Flash more flexible - Adobe Flex. Flex is ... The Adobe Flex Charting
library uses an dataProvider- property as data source, which is ...
Flash/Flex based Information Visualization Tools Version of 18 May 2011
Christian Haintz, Stephan Moser, Michael Musenbrock , Karin Pichler
Abstract This document covers information visualization technologies based on Flash and Flex. In this survey Flex and Flash, Flare, Degrafa, Axiis, Birdeye and Kap Lab are introduced. All this tools can produce interactive charts and diagrams for information visualization. Most of them are based on Flex 4 which became very powerful. Because of this reason some of this external tools and techonlogies loose more and more on importance and are not acitvely maintained anymore. Just a few migrated to Flex 4.
Contents 1
Introduction 1.1 The Base - Adobe Flash . . . . . . . . . . . . . . . . . . . . . . . . . . . . . . . . . . . . . . 1.2 Making Flash more flexible - Adobe Flex . . . . . . . . . . . . . . . . . . . . . . . . . . . .
2
Flex Frameworks for Information Visualisation 2.1 Adobe Flex’ Internal Infvis Toolbox . . . . . 2.1.1 Introduction to Flex’ Charting . . . . 2.1.2 Detailed functionality . . . . . . . . . 2.1.3 Data-Import-Format . . . . . . . . . 2.1.4 Data-/Diagram-/SWF Export . . . . . 2.1.5 Flex Examples . . . . . . . . . . . . 2.2 flare - data visualization for the web . . . . . 2.2.1 Short Introduction to Flare . . . . . . 2.2.2 Detailed functionality . . . . . . . . . 2.2.3 Data-Import-Format . . . . . . . . . 2.2.4 Data-/Diagram-/SWF Export . . . . . 2.2.5 Examples . . . . . . . . . . . . . . . 2.3 Degrafa . . . . . . . . . . . . . . . . . . . . 2.3.1 InfoViz with Degrafa . . . . . . . . . 2.3.2 Data Sources . . . . . . . . . . . . . 2.3.3 Export Formats . . . . . . . . . . . . 2.3.4 Examples . . . . . . . . . . . . . . . 2.4 Axiis . . . . . . . . . . . . . . . . . . . . . . 2.4.1 Introduction to Axiis’ Charting . . . . 2.4.2 Detailed functionality . . . . . . . . . 2.4.3 Data-Import-Format . . . . . . . . . 2.4.4 Data-/Diagram-/SWF Export . . . . . 2.4.5 Axiis Examples . . . . . . . . . . . . 2.5 Birdeye . . . . . . . . . . . . . . . . . . . . 2.5.1 RaVis . . . . . . . . . . . . . . . . . 2.5.2 GeoVis . . . . . . . . . . . . . . . . 2.5.3 GuVis . . . . . . . . . . . . . . . . . 2.5.4 QaVis . . . . . . . . . . . . . . . . . 2.5.5 TaVis . . . . . . . . . . . . . . . . . 2.5.6 Data-Import-Format . . . . . . . . . 2.5.7 Data-/Diagram-/SWF Export . . . . . 2.5.8 Birdseye Examples . . . . . . . . . . 2.6 Kap Lab . . . . . . . . . . . . . . . . . . . . 2.6.1 Introduction to KapLab . . . . . . . . 2.6.2 Detailed functionality . . . . . . . . .
i
. . . . . . . . . . . . . . . . . . . . . . . . . . . . . . . . . . .
. . . . . . . . . . . . . . . . . . . . . . . . . . . . . . . . . . .
. . . . . . . . . . . . . . . . . . . . . . . . . . . . . . . . . . .
. . . . . . . . . . . . . . . . . . . . . . . . . . . . . . . . . . .
. . . . . . . . . . . . . . . . . . . . . . . . . . . . . . . . . . .
. . . . . . . . . . . . . . . . . . . . . . . . . . . . . . . . . . .
. . . . . . . . . . . . . . . . . . . . . . . . . . . . . . . . . . .
. . . . . . . . . . . . . . . . . . . . . . . . . . . . . . . . . . .
. . . . . . . . . . . . . . . . . . . . . . . . . . . . . . . . . . .
. . . . . . . . . . . . . . . . . . . . . . . . . . . . . . . . . . .
. . . . . . . . . . . . . . . . . . . . . . . . . . . . . . . . . . .
. . . . . . . . . . . . . . . . . . . . . . . . . . . . . . . . . . .
. . . . . . . . . . . . . . . . . . . . . . . . . . . . . . . . . . .
. . . . . . . . . . . . . . . . . . . . . . . . . . . . . . . . . . .
. . . . . . . . . . . . . . . . . . . . . . . . . . . . . . . . . . .
. . . . . . . . . . . . . . . . . . . . . . . . . . . . . . . . . . .
. . . . . . . . . . . . . . . . . . . . . . . . . . . . . . . . . . .
. . . . . . . . . . . . . . . . . . . . . . . . . . . . . . . . . . .
. . . . . . . . . . . . . . . . . . . . . . . . . . . . . . . . . . .
. . . . . . . . . . . . . . . . . . . . . . . . . . . . . . . . . . .
. . . . . . . . . . . . . . . . . . . . . . . . . . . . . . . . . . .
. . . . . . . . . . . . . . . . . . . . . . . . . . . . . . . . . . .
. . . . . . . . . . . . . . . . . . . . . . . . . . . . . . . . . . .
. . . . . . . . . . . . . . . . . . . . . . . . . . . . . . . . . . .
. . . . . . . . . . . . . . . . . . . . . . . . . . . . . . . . . . .
. . . . . . . . . . . . . . . . . . . . . . . . . . . . . . . . . . .
1 1 1 3 4 4 4 4 4 5 9 9 9 9 9 9 10 10 11 12 12 13 13 13 14 14 14 16 16 16 16 16 17 17 17 17 18 18 18
2.7
2.6.3 Data-Import-Format . . . . 2.6.4 Data-/Diagram-/SWF Export 2.6.5 Kaplab Examples . . . . . . Concluding Remarks . . . . . . . .
. . . .
. . . .
. . . .
. . . .
. . . .
ii
. . . .
. . . .
. . . .
. . . .
. . . .
. . . .
. . . .
. . . .
. . . .
. . . .
. . . .
. . . .
. . . .
. . . .
. . . .
. . . .
. . . .
. . . .
. . . .
. . . .
. . . .
. . . .
. . . .
. . . .
. . . .
. . . .
20 20 20 23
Chapter 1
Introduction This academic survey paper presents a overview of the state of the art toolkits used to create Flash/Flex based application used in the field of information visualization.
1.1
The Base - Adobe Flash
Adobe Flash is the key platforms to provide interactive and animated content in the world-wide-web. It is mostly used to display animations and videos. Flash uses as base vector graphics, which makes it the perfect tool for web-applications, because it lowers the needed size and bandwith for the data. Furthermore developing Flash is done in the object- oriented language ActionScript. Even if Flash us basically used for basic animations on webpages and videos, in practice with ActionScript Flash can be used to create any kind of data representation. [Reimers and Stewart, 2007]
1.2
Making Flash more flexible - Adobe Flex
Flex is a open source and therefore free framework for building Rich-Internet-Applicatons based on Flash. Flex provides an modern language and programming model. It is based on MXML (Macromedia XML), a declarative XML-based language. MXML is used for the description of the user interface. Which contains the layout and the layouts behaviour. On the other hand there is ActionScript, a programming language used to create the logic of the application. Flex can either to be used to create Application for the web, which are running the the Adobe Flash Player software, or desktop applcations, which run withoud a browser in the Adobe AIR runtime. [Adobe Systems Incorporated., 2011e]
1
2
CHAPTER 1. INTRODUCTION
Chapter 2
Flex Frameworks for Information Visualisation In this chapter, state-of-the-art frameworks are described, which are used to help creating flash/flex-based data visualisation.
(a) Flare Logo
(b) Flash Logo
(c) Flex Logo
Figure 2.1: Logos of described products UC Berkeley Visualization Lab. [2011d] UC Berkeley Visualization Lab. [2011d] UC Berkeley Visualization Lab. [2011d]
3
4
CHAPTER 2. FLEX FRAMEWORKS FOR INFORMATION VISUALISATION
2.1 2.1.1
Adobe Flex’ Internal Infvis Toolbox Introduction to Flex’ Charting
The Adobe Flex Framework is shipped with internal data visualization components. Before Flex 4, the data visualization was only available in the Adobe Flex Premium line, but was in March 2010 open sourced, and can now be used with the open source Flex SDK for free. [Deepa Subramaniam., 2010] That points also turns out to be the main advantage against all the competitors in the topic of data visualization with Flex, because that means that the development is synced with the base Adobe Flex development. So it is very unlikely, until Adobe drops Charting support completely, that there is no hurdle to switch to newer versions of Adobe Flex or having the problem that a external library would drop support or even stop development. [Adobe Systems Incorporated., 2011c]
2.1.2
Detailed functionality
The Flex visualization toolkit provides for representation of data an two dimensional visualization, which is known as charting. Flex supports a large number of commonly used charting-types, which are listed below, and provides control over the charts appearance. [Adobe Systems Incorporated., 2011a] Flex charting controls allows the creation of a number of common chart types. Additionally, flex allows customization to the charts appearance. This customization can be done via the Flex internal styling using the common CSS format. The following chart types are provided by Adobe Flex: Chart Types • AreaChart • BarChart • BubbleChart • CandlestickChart • ColumnChart • HLOCChart • LineChart • PieChart • PlotChart [Adobe Systems Incorporated., 2011a]
2.1.3
Data-Import-Format
The Adobe Flex Charting library uses an dataProvider- property as data source, which is accessed by the chart. As data provider, in the speech of Flex, an array of objects or objects contained in the format of the Flex collection API. [Adobe Systems Incorporated., 2011b] Additionally the data provider can be implemented as a XMLList objects. These objects contains XML nodes, as example resulting from an E4X query. [Adobe Systems Incorporated., 2011a]
2.1.4
Data-/Diagram-/SWF Export
Unfortunately there are no included or out-of-the-box exporting mechanisms provided by Adobe Flex Charting Tools. This means, that every export has to be done manually.
2.1. ADOBE FLEX’ INTERNAL INFVIS TOOLBOX
2.1.5
Flex Examples
Here a typical AreaChart is used as example 2.1: 1 2 3 4 5 6 7 8 9 10 11 12 13 14 15 16 17 18 19 20 21 22 23 24 25 26 27 28 29 30 31 32 33 34 35 36 37 38 39 40 41 42 43
Listing 2.1: Sample code using of a Adobe Flex Pie-Chart Adobe Systems Incorporated. [2011a]
It is also possible to define a data provider for each element, as the following example shows 2.2: 46
7
8
106
CHAPTER 2. FLEX FRAMEWORKS FOR INFORMATION VISUALISATION
Listing 2.2: Sample code using of a Adobe Flex Pie-Chart Adobe Systems Incorporated. [2011a]
Figure 2.3: Adobe Flex Multiple Data ProvidersAdobe Systems Incorporated. [2011a]
2.2. FLARE - DATA VISUALIZATION FOR THE WEB
2.2 2.2.1
9
flare - data visualization for the web Short Introduction to Flare
Flare is a very powerful framework used to create information visualizations directly in ActionsScript. This is also one of the advantages and at the same time one of the drawbacks. The development in ActionScript can be more complex, but makes it much easier to develop individual and customized applications, because it provides the most flexibility. [UC Berkeley Visualization Lab., 2011b]
2.2.2
Detailed functionality
The flare library is used to create information visualizations with a set of packages or modules used to build complex visualizations. The flare library consists, as mentioned, of a list of submodules with different core areas. These modules are categorized as shown: Flare subpackages • flare.vis.axis: provides axes, labels and gridlines • flare.vis.controls: interaction handlers for selection, zooming, and more • flare.vis.data: visual objects that represent data elements • flare.vis.data.render: pluggable renderers that draw DataSprites • flare.vis.events: event types used in the flare framework • flare.vis.legend: represents legends for describing visual encodings • flare.vis.operator: building blocks for defining visualizations • flare.vis.palette: palettes for color, shape, and size values • flare.vis.util: general utility classes [UC Berkeley Visualization Lab., 2011d]
2.2.3
Data-Import-Format
Flare uses as standard data sources the Flash Types Object and Array. Additionally flare provides utils, which can handle external data. These data can be provided as: Flare datatypes • ”tab”, tab-delimited text, such as comma seperated values • ”json”, JavaScript Object Notation, which is a open, text-based data interchange format. • ”graphml”, GraphML, XML format used to store and exchange graph structures [UC Berkeley Visualization Lab., 2011d]
2.2.4
Data-/Diagram-/SWF Export
Unfortunately there are no included or out-of-the-box exporting mechanisms provided by flare. This means, that every export has to be done manually.
2.2.5
Examples
An example demo of the the provided flare tools showing all the feature of flare can be found at the flare demo-page [UC Berkeley Visualization Lab., 2011c]. Complete example applications, can be found at the flare application-page [UC Berkeley Visualization Lab., 2011a].
10
2.3
CHAPTER 2. FLEX FRAMEWORKS FOR INFORMATION VISUALISATION
Degrafa
Degrafa tries to fill the gap between frameworks for designers and for developers. It tries to be a most easy to use framework for designers which is also powerful enough for developers. Due to the lack of high level classes for graphics and visualization in Flex 2 and Flex 3, Degrafa wants to become a first class citizen of the Flex framework. During the development of Flex 4 Adobe were in contact with the Degrafa developers regarding migrating Degrafa in Flex 4. In the end Adobe decided not to fully implement Degrafa in the Flex 4 framework but used a similar approach as Degrafa. Therefore the native Flex 4 classes for graphics are not compatible with the Degrafa framework but they are quite similar. Degrafa was not developed only with InfoViz in mind, it is a graphic framework which is used in many different areas e.g. web-design, animations, games and of course information visualization. As already mentioned Degrafa was build with productivity in mind. Visualization of things should be done in an efficient way. One goal to achieve this is to optimize the learning curve of the framework especially for designers. Therefore Degrafa can be used even without the use of action script but is not limited to. With action script Degrafa graphics can be made more interactive or even animated. Degrafa highly abstract low level graphic classes to bring them to a language or dialect which is understandable by most designers and developers new to action script. This language is called MXML[Adobe, 2011]. Additionally Degrafa tries to make high reuse of methods, algorithms and overrides to provide the user an interactive playground were he can experiment with the tools Degrafa provides. With this points in respect Degrafa looks similar to SVG. The Degrafa Team states on the Website: SVG ” is a tight format and grammar, it does not readily lend itself to readability. Thus a more verbose mark-up is required, which is why MXML is used for Degrafa to provide a more transparent transition. “[Degrafa, 2011b] Another goal of Degrafa is optimization. It uses different tactics to achieve this. Degrafa makes reuse of objects instead of recreating a quite similar object, it also uses overrides and bindings.
2.3.1
InfoViz with Degrafa
Degrafa is a flexible graphics framework which can also be used for info visualization. There are some widgets made by others to provide info visualization. Degrafa is used to make it easy for designers to create a visualization without going to much in code details. But for interactive visualization you have to put some effort in creating the widgets or use a framework which uses Degrafa and build some special InfoViz widgets for it e.g. Axiis[Tom Gonzalez, 2009b].
Figure 2.4: Degrafa Micro Charts[Brithpoint, 2011]
2.3. DEGRAFA
2.3.2
11
Data Sources
Due to the nature of Degrafa data sources can be reached with action script. Therefore every data source can be reached if a suitable data provider is written in Action Script which feeds the Degrafa widget with data. Therefore Degrafa gives you much flexibility but you have to invest development time to create fitting data providers. On the other way round, widgets written with Degrafa have not a uniform data source interface instead it depends on the widget author. When developing widgets for InfoViz the recommended approach will be a uniform widget data source format to provide loose coupling between data and representation. A sample of how widgets are used is in Listing 2.3.
107 108
109
110 111 112 113 114 115 116 117 118 119
120 121 122 123
124 125 126 127 128 129 130 131 132 133 134 135 136 137 138 139
12
CHAPTER 2. FLEX FRAMEWORKS FOR INFORMATION VISUALISATION
Listing 2.3: Sample code using of Microcharts [Brithpoint, 2011]
2.3.3
Export Formats
Due to the low level nature of Degrafa it doesn’t provide export formats as we would expect from typical InfoViz frameworks. Therefore we just get a flash representation of the visualization. If we need a special export format you need to write an exporter.
2.3.4
Examples
(a)
(b)
(c)
Figure 2.5: Examples of information visualization using Degrafa [Degrafa, 2011a]
As mentioned above Degrafa is not a pure InfoViz framework instead it tries to be a solid graphics framework for Flex to provide the base for InfoViz frameworks. In Figure 2.5 you see examples of information visualization widgets which are based on the Degrafa framework.
2.4. AXIIS
2.4
13
Axiis
The Axiis data visualization framework was founded in 2009 by Tom Gonzalez and Michael VanDaniker. Because Tom Gonzalez was a developer of Degrafa they decided to create a new framework which builds on the Degrafa graphics framework and on Adobe Flex 3. With Degrafa it is possible to draw much more things than just charts and data visualization. The Axiis framework was especially designed for data visualization, they focused on an easy-to-use framework where the developer can get very fast some data visualization results. One initial factor why Axiis was developed was that customization of charts is in Flex a very big challenge. The whole framework works with MXML and ActionScript. The whole project is open sourced and licensed under the MIT license, the framework can be used by any person for commercial and non commercial use. [Tom Gonzalez, 2009a]
2.4.1
Introduction to Axiis’ Charting
The variations of the different Charts which are available in Axiis are high. The developer has the possibility to make every chart which was build with Axiis interactive, which means that additional information can be put on a chart which can be seen when the user interacts with the data visualization chart. Axiis provides the possibility to use any given visualization components or to do completely new types of charts. If a developer decides to make his own chart Axiis has some types for abstract layout patterns which are well documented and can be easily used. [Tom Gonzalez, 2009a] Here are just some examples what different types of charts can be done with the Axiis framework: • Wedge Stacks Graphs • Lines and Area Charts • Column/Bar Clusters and Stacks • Plot and Bubble Charts • Waterfall Charts • Nested Columns • HCluster Column • Smith Charts • TreeMaps • Browser Statistics The developer of Axiis focused on the easy-to-use aspect. The goal was that everyone can use it without any huge problems. One goal was to provide an easy way of doing some customization of the charts which is not that easy in Flex because of the inheritance chain. In the Axiis framework exists a new inheritance chain, the focus was on building a flat and interchangeable class-structure. [Tom Gonzalez, 2009a]
2.4.2
Detailed functionality
The Axiis framework follows two main core concepts which are geometries and layouts. The geometries are used from the Degrafa framework and represent what the basic concepts of a chart look like, for example circles or rectangular. The other concept are layouts. The layouts provide the functionality to arrange the geometries and to build a relationship between the geometries. In principal the layouts consists of two main elements. One is the geometry which should be used for the visualization and the other element is a set of property modifiers. With the property modifiers some special properties for each geometry can be defined. In principal the structure and the hierarchies of a chart are developed through iterating over the dataset.
14
CHAPTER 2. FLEX FRAMEWORKS FOR INFORMATION VISUALISATION
Render Lifecycle One basic concept of the Axiis framework is the DataCanvas which provides the space for the visualization and which initiates the whole chart to render. As soon as a chart is going to be rendered the layout is going to loop over the data. The data is provided by the DataProvider and the layout communicates with this data-provider. In the loop some basic steps must be executed. At first the geometry for a data item which can be retrieved from the DataProvider must be created. The defined properties are applied to the geometry which is used in this iteration. Afterwards the relations between the geometries which are already drawn must be set. The next looping iteration starts afterwards. As soon as the whole loop has finished the DataCanvas updates the display list and the creation process of the chart has finished. The following enumeration shows the basic steps again [Gonzalez, 2009]: 1. DataCanvas initiates the Layouts render() method 2. Loop through each item in the dataProvider Create a Sprite for each data item (if it has not already been created) Apply all property modifiers to the referenceGeometry for that iteration Set all ”current” properties of Layout (currentReference, currentValue, currentLabel, currentDatum) Binding triggers updates to all drawingGeometries Layout renders the drawingGeometries to the graphics context of that iterations sprite Continue loop for each data item 3. DataCanvas updates its display list
2.4.3
Data-Import-Format
The Axiis framework provides two ways of importing the data. One possibility is to use ActionScript and to import the data via Objects, Arrays, ArrayCollections and XMLListCollections. The Axiis framework itself provides a class which can be used for importing the data. The main issue of this class is providing the possibility to pre-process the data for the visualization.
2.4.4
Data-/Diagram-/SWF Export
Axiis provides no functionality for exporting diagrams or SWF-Files.
2.4.5
Axiis Examples
In this section some examples of Axiis are shown. All these examples are taken from the homepage [Tom Gonzalez, 2009a]. The examples include a wedge stack chart, an area chart, a radial chart and a treemap. Every example is interactive.
2.4. AXIIS
15
(a) Wedge Stack
(b) Area Chart
(c) Radial Chart
(d) Treemap
16
CHAPTER 2. FLEX FRAMEWORKS FOR INFORMATION VISUALISATION
2.5
Birdeye
The Birdeye framework was created in 2009 [Birdeye, 2011a]. It is an open source project licensed under the MIT License and community driven. The whole project is Flex library which is especially used for data visualization. The whole Birdeye project consists of five libraries. Basically the Birdeye framework works with Flex 3 but some libraries are converted to Flex 4.
(a) RaVis
2.5.1
(b) GeoVis
(c) GuVis
(d) QaVis
(e) TaVis
RaVis
RaVis stands for Relational Analysis [Birdeye, 2011e]. This library provides visualization methods for analyzing relationships, structures and links between objects. In the library are different graph theory algorithms implemented, for example radial algorithms, hierarchical algorithms and force-directed algorithms. All concerning the mathematics, which is needed for the visualization is done in the library itself. RaVis supports Flex 4 since February 2011.
2.5.2
GeoVis
GeoVis stands for GeoSpatial Analysis [Birdeye, 2011b]. This library was developed to analyze geographic data. The base of GeoVis are vector-based maps. With GeoVis objects can be overlaid with this maps, symbols can be added, etc. The GeoVis library is in a pre-Alpha state and not very stable yet.
2.5.3
GuVis
GuVis is the abbreviation for General Utility [Birdeye, 2011c]. The GuVis library provides basic concepts for information visualization and for visual design as for example UI controls, animation, filters and so on. This library can be used with any other Birdeye libraries.
2.5.4
QaVis
QaVis stands for Quantitative Analysis [Birdeye, 2011d]. This library provides tools and methods for numerical ans statistical analysis. QaVis is used for building • Treemaps • MicroCharts • Sparklines • Venn diagrams • Prymids • etc... At the moment this library is under heavy development.
2.5. BIRDEYE
2.5.5
17
TaVis
TaVis is the abbreviation for Temporal Analysis [Birdeye, 2011f]. This library was developed for analyzing the change of data over time. TaVis provides functionality for visualizing the time with time-series, timelines and chronologial data analysis.
2.5.6
Data-Import-Format
The data can be imported via XML files or via the Flex Collections (Ojbects, Arrays, ArrayCollections and XMLListCollections) [Jachimowicz, 2010].
2.5.7
Data-/Diagram-/SWF Export
The Birdeye framework provides the functionality to export the diagrams as SVG.
2.5.8
Birdseye Examples
In this section some examples of Birdseye are shown. This examples are taken from the Birdeye Demo Explorer [Birdeye, 2009]. In the examples are a Bar Chart, a Bubble Chart a Column Chart and a Radar Area. Every example is interactive.
(a) Bar Chart
(b) Bubble Chart
(c) Column Chart
(d) Radar Area
18
CHAPTER 2. FLEX FRAMEWORKS FOR INFORMATION VISUALISATION
2.6
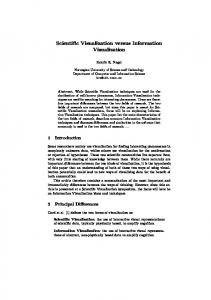
Kap Lab
Kap Lab offers data visualization components and development optimization tools for the Flex community. The Kap Lab product range generally includes two main components: • Kalileo - Flex Diagramming Components
Figure 2.6: Kalileo visualization of computer networks Kap IT SAS [2011b]
• Kolbert - Flex Reporting Components Kap Lab framework is free for non commercial use with a Community License and you can purchase it for commercial use with a Standard License and a OEM License. [Kap IT SAS, 2011b]
2.6.1
Introduction to KapLab
As already mentioned Kap Lab splits into 2 main components. Kalileo provides customizable multi-layout data visualization components for Adobe Flex and Air. It includes Visualizer for displaying graphs and data and Diagrammer for diagram edition and visual data modeling. Visualizer and Diagrammer are two Flex components, fully developed in AS3. Visualizer aims at visualizing data sources and relationships in any graph based visualization, Diagrammer inherits such behavior and enriches it with edition capabilities and advanced data model handling. Diagrammer extends Visualizer which means that all features available in Visualizer are automatically found in Diagrammer. Four reporting components named Treemap, Radar Chart, Ring Chart and Elastic Search are bundled in one package called Kolbert. Kolbert is a Flex component that can be integrated in any Flex or Air application to provide a data analysis tool and can be parameterized using a set of properties. [Kap IT SAS, 2011a]
2.6.2
Detailed functionality
Kalileo Layouts • Orthogonal (Cyclic) • FadeLayout (Dynamic repositioning)
2.6. KAP LAB
• Balloon (Strict tree, Cyclic) • Hierarchical Cyclic • Circular (Cyclic) • Radial (Strict tree, Cyclic) • Hierarchical Tree • Mindmap • BiHierarchical • Organic (Strict tree, Cyclic) [Kap IT SAS, 2011b] Graph Browsing • Overview sub-component • Relation Map sub-component • FishEye Effect • Bifocal Effect • Zoom on mouse wheel or click • Area selection or zoom • Pan • Smart grouping • Expandable / Collapsable groups • Pools / Lanes • Multi-level tables • Different types of links: orthogonal, curved, straight ... Kolbert • Treemap • Radar Chart • Ring Chart • Elastic Search
19
20
CHAPTER 2. FLEX FRAMEWORKS FOR INFORMATION VISUALISATION
2.6.3
Data-Import-Format
Kalileo Kalileo provides interfaces for importing: • CSV • GraphML • XML • AS3 elements (Array, ArrayCollection, Objects, XML/XMLList) [Kap IT SAS, 2011b] Kolbert Kolbert provides interfaces for importing: • CSV • XML • ArrayCollection [Kap IT SAS, 2011b]
2.6.4
Data-/Diagram-/SWF Export
The KapLab framework is able to export diagrams and reports in these formats: • PNG • XML [Kap IT SAS, 2011b]
2.6.5
Kaplab Examples
[Kap IT SAS, 2011b]
2.6. KAP LAB
21
Figure 2.7: Simple GraphML integration in Kalileo Kap IT SAS [2011b]
Figure 2.8: Kolbert Radarchart visualization Kap IT SAS [2011b]
22
CHAPTER 2. FLEX FRAMEWORKS FOR INFORMATION VISUALISATION
Figure 2.9: Kolbert Ringchart visualization Kap IT SAS [2011b]
Figure 2.10: Kolbert Treemap visualization Kap IT SAS [2011b]
Figure 2.11: Kolbert Elasticsearch visualization Kap IT SAS [2011b]
2.7. CONCLUDING REMARKS
2.7
23
Concluding Remarks
Our research for the state-of-the-art flex information visualization technologies results in this table. It gives a short overview of frameworks which we evaluated in this research. This research covers only the most famous and active frameworks. Diag Export Input Formats
Flex Data Viz FlexCollection
Degrafa
KapLab
Axiis
Flare
Birdeye
FlexCollection
FlexCollection
SVG FlexCollection, XML, FlexJSON, Collection GraphML
++
+
++
Maintainance +++ State Age 2007 (Flex 4) Level Highlevel
+
PNG, XML FlexCollection, CSV, XML, GraphML +++
2006
2009
2009
2007
2009
Lowlevel
Highlevel
Lowlevel
Highlevel
License
OpenSource
Noncommercial: free, Commercial: 4000$
High-& Lowlevel OpenSource
OpenSource
OpenSource
OpenSource
There is not a real winner of these frameworks, it depends on the use case. The KapLab is the most complete framework but it is commercially licensed. We observed the trend that during 2009/2010 many frameworks in this area existed and were actively maintained. This was the time before Flex 4. It seams that with Flex 4 many of the functionalities of these frameworks got integrated although not completely.
References Adobe [2011]. MXML Specification 2009. http://opensource.adobe.com/wiki/display/flexsdk/ MXML+2009. Adobe Systems Incorporated. [2011a]. Adobe Flex 4.5 * About charting. http://help.adobe.com/en_ US/flex/using/WS2db454920e96a9e51e63e3d11c0bf69084-7c77.html. Adobe Systems Incorporated. [2011b]. Adobe Flex 4.5 * Data providers and collections. http://help. adobe.com/en_US/flex/using/WS2db454920e96a9e51e63e3d11c0bf69084-7fb8.html. Adobe Systems Incorporated. [2011c]. Adobe Flex 4.5 * Introduction to charts. http://help.adobe.com/ en_US/flex/using/WS2db454920e96a9e51e63e3d11c0bf69084-7bdf.html. Adobe Systems Incorporated. [2011d]. Adobe Flex 4.5 * Remote data in data provider components. http:// help.adobe.com/en_US/flex/using/WS2db454920e96a9e51e63e3d11c0bf69084-7b63.html. Adobe Systems Incorporated. [2011e]. Open Source Software — Flex — Adobe. http://www.adobe.com/ products/flex/overview/. Birdeye [2009].
Birdeye Demo Explorer.
http://birdeye.googlecode.com/svn/branches/ng/ examples/demo/BirdEyeExplorer.html.
Birdeye [2011a]. Birdeye Homepage. http://code.google.com/p/birdeye/. Birdeye [2011b]. GeoVis Homepage. http://code.google.com/p/birdeye/wiki/GeoVis. Birdeye [2011c]. GuVis Homepage. http://code.google.com/p/birdeye/wiki/GuVis. Birdeye [2011d]. QaVis Homepage. http://code.google.com/p/birdeye/wiki/QaVis. Birdeye [2011e]. RaVis Homepage. http://code.google.com/p/birdeye/wiki/RaVis. Birdeye [2011f]. TaVis Homepage. http://code.google.com/p/birdeye/wiki/TaVis. Brithpoint [2011]. Brithpoint Consulting Website. http://www.brightpointinc.com/. Deepa Subramaniam. [2010]. iamdeepa on flex � Blog Archive � Flex advanced data visualization components now part of the FREE open source Flex SDK! http://iamdeepa.com/blog/wp-trackback.php?p= 53. Degrafa [2011a]. Degrafa Data Visalization Examples. http://www.degrafa.org/samples/datavisualization.html. Degrafa [2011b]. Degrafa Website About. http://www.degrafa.org/about/. Gonzalez, Tom [2009]. Axiis - New data visualization framework. http://www.twgonzalez.com/blog/ ?p=172.
24
REFERENCES
25
Jachimowicz, Wojciech [2010]. Birdeye Tutorial. http://flashflex.com/visualizing-relationaldata-using-graph-theory/. Kap IT SAS [2011a]. Help - Developer Guide. http://lab.kapit.fr/help/index.jsp. Kap IT SAS [2011b]. Kap Lab: Flex data visualization components and development optimization tools. http://lab.kapit.fr/display/kaplabhome/Home. Reimers, Stian and Neil Stewart [2007]. Adobe Flash as a medium for online experimentation: a test of reaction time measurement capabilities. Behavior research methods, 39(3), pages 365–70. ISSN 1554351X. http://www.ncbi.nlm.nih.gov/pubmed/17958146. Tom Gonzalez, Michael VanDaniker [2009a]. Axiis. http://www.axiis.org/. Tom Gonzalez, Michael VanDaniker [2009b]. Axiis - Google Code. http://code.google.com/p/axiis/. UC Berkeley Visualization Lab. [2011a]. Flare — Apps — Index. http://flare.prefuse.org/apps/ index. UC Berkeley Visualization Lab. [2011b]. Flare — Data Visualization for the Web. http://flare.prefuse. org/. UC Berkeley Visualization Lab. [2011c]. Flare — Demos. http://flare.prefuse.org/demo. UC Berkeley Visualization Lab. [2011d]. Flare — Tutorial. http://flare.prefuse.org/tutorial.