FlashLogging: Exploiting Flash Devices for Synchronous Logging Performance Shimin Chen Intel Research Pittsburgh 4720 Forbes Avenue, Suite 410 Pittsburgh, PA 15213, USA
[email protected] ABSTRACT
General Terms
Synchronous transactional logging is the central mechanism for ensuring data persistency and recoverability in database systems. Unfortunately, magnetic disks are ill-suited for the small sequential write pattern of synchronous logging. Alternative solutions (e.g., backup servers or sophisticated battery-backed write caches in high-end disk arrays) are either expensive or complicated. In this paper, we exploit flash devices for synchronous logging based on the observation that flash devices support small sequential writes well. Comparing a wide variety of flash devices, we find that USB flash drives are a good match for this task because of its unique characteristics: widely available USB ports, hot-plug capability useful for coping with flash wear, and low price so that multiple drives are affordable. We propose F lashLogging, a logging solution that exploits multiple (USB) flash drives for synchronous logging. We identify and address four challenges: (i) efficiently exploiting multiple flash drives for logging; (ii) coping with the large variance of write latencies because of device erasure operations; (iii) efficient recovery processing; and (iv) combining flash drives and disks for better logging and recovery performance. We implemented our solution within MySQL-InnoDB. Our real machine experiments running online transaction processing workloads (TPCC) show that F lashLogging achieves up to 5.7X improvements over magnetic-disk-based logging, and obtains up to 98.6% of the ideal performance. We further compare our design with one that uses Solid-State Drives (SSDs), and find that although SSDs improve logging performance, multiple USB flash drives can achieve comparable or better performance with much lower price.
Algorithms, Design, Performance, Reliability
Keywords FlashLogging, Online Transaction Processing, Synchronous Logging, Flash Devices, Unconventional Array Organization, Outlier Detection and Hiding, Near-Zero-Delay Archival Disk, Recovery Processing
1. INTRODUCTION Synchronous logging, in which log records are forced to stable media, is one of the most important techniques for achieving fault-tolerant computation. It is used extensively in a wide variety of computer systems. In relational database systems, synchronous logging is the central mechanism to ensure transaction durability [12, 17, 22, 27]. Before a transaction commits, the redo log records associated with the transaction must be flushed to the synchronous redo log. If later the database system fails and restarts, these redo log records guarantee that any data changes in the transaction persist across the failure. Similarly, synchronous logging (a.k.a. synchronous journal) can be used to guarantee the durability of file I/O operations in file systems [26], and it can be employed in distributed systems (e.g., multi-tier systems providing web services) to restore server states upon crash recovery [2, 8, 36]. This paper investigates efficient solutions for synchronous logging. As DRAM capacity doubles every two years [14], an OLTP database that was considered “large” ten years ago can now fit into main memory. For example, in the TPCC benchmark [34], a warehouse, which represents 30 thousand users, occupies less than 100MB1 space. Note that a low-end server machine today is often equipped with 4–32GB of memory. Therefore, a database for 30 million users, which requires less than 100GB space, can easily fit into the aggregate main memory of a small cluster of low-end server machines. Recent database studies have explored this trend to redesign database architecture for better transaction processing performance [13, 33]. In contrast, synchronous logging always requires to write to stable media. Therefore, the performance of synchronous logging is becoming increasingly important to the overall performance of transaction processing. However, efficient solutions for synchronous logging are not straightforward.
Categories and Subject Descriptors H.2.2 [DATABASE MANAGEMENT]: Physical Design; H.2.4 [DATABASE MANAGEMENT]: Systems—Transaction processing; H.2.7 [DATABASE MANAGEMENT]: Database Administration—Logging and recovery
Permission to make digital or hard copies of all or part of this work for personal or classroom use is granted without fee provided that copies are not made or distributed for profit or commercial advantage and that copies bear this notice and the full citation on the first page. To copy otherwise, to republish, to post on servers or to redistribute to lists, requires prior specific permission and/or a fee. SIGMOD’09, June 29–July 2, 2009, Providence, Rhode Island, USA. Copyright 2009 ACM 978-1-60558-551-2/09/06 ...$5.00.
1 KB=103 B, MB=106 B, GB=109 B; KiB=210 B, MiB=220 B, GiB=230 B.
73
100%
31762
80% CDF
NOTPM
40000 35000 30000 25000 20000 15000 10000 5000 0
5466
60% 40% 20% 0% 0
disabled(required) enabled(ideal) logging disk write cache
10
20 30 40 log flush size (KB)
50
60
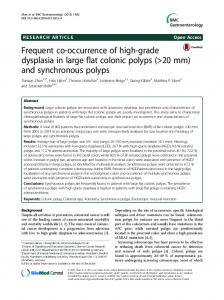
Figure 1: TPCC transaction rates while a magnetic disk is used as the logging device for synchronous transactional logging. (NOTPM: New Order Transactions Per Minute)
Figure 2: The cumulative distribution of MySQLInnoDB log flush sizes when running a TPCC test with the logging disk write cache disabled (corresponding to the left bar in Figure 1).
1.1 Magnetic Disks Suffer from Small Sequential Writes of Synchronous Logging
platters in a disk are constantly spinning, a small write to a subsequent (sequential) location often incurs a full rotational delay. Even the highest-performing 15k rpm disks experience 4ms rotational delays. Fundamentally, this penalty is determined by the mechanical capabilities of magnetic disks, which is difficult to reduce.
The first solution that comes to mind is to use magnetic disks as the stable media for synchronous logging. Figure 1 shows the TPCC transaction rates with disk-based logging. Two Dell PowerEdge 1955 blade servers are used in the experiments: one is running a MySQL server with the InnoDB backend storage engine supporting a 20-warehouse TPCC database, the other is running a client driver that repeatedly issues TPCC transaction requests and measures the transaction rates. Each blade server is equipped with two 10k rpm SAS disk drives. The database server uses one disk for storing TPCC tables and indices, while the other is devoted to synchronous redo logging. We make sure that the entire TPCC database and its indices can fit into the main memory buffer pool on the server. In each experiment, the client driver runs 32 driver threads for an hour, modeling 32 independent clients without thinking time. (More experimental details and more results varying from 1 to 128 clients are described in Section 5.) In Figure 1, the left bar corresponds to the required configuration: The write cache in the logging disk is disabled so that log flushes are guaranteed to be on stable media. In contrast, for the right bar, we enable the write cache in the logging disk. While an invalid configuration, the latter is interesting because it models a logging device with ideal performance (modeling the cost of operating system calls, device driver scheduling, and device interface delays). As shown in Figure 1, compared to the ideal configuration, the transaction rate of the required configuration is a factor of 5.8 times lower, indicating that magnetic-disk-based logging is a major performance bottleneck. But why is this the case? By instrumenting the source code of MySQL-InnoDB, we obtain the cumulative distribution of log flush sizes, as shown in Figure 2. While log writes are often accumulated in an in-memory log buffer, log flushes send actual I/O writes to the logging device. As shown in Figure 2, the distribution is dominated by small I/O write sizes: 82.9% of the write sizes are less than 10KB large, 90.5% of the write sizes are less than 15KB large, and 99.0% of the write sizes are less than 36KB. Compared to the track size of a typical disk (e.g., 8MB), the write size is very small. Since synchronous logging mainly sequentially appends to the log, the major access pattern is small sequential writes. It is common knowledge that magnetic disks (without write caching) are ill-suited for handling small sequential writes. Because the
1.2 Alternatives are Expensive or Complicated In light of the above problem, high-end disk arrays often provide battery-backed write caches that are controlled by the caching mechanisms to prevent data loss [22]. Upon a power failure, data is required to be maintained for up to several days until power is properly restored. Note that a UPS (Uninterruptible Power Supply) is insufficient for this purpose. This solution achieves good logging performance by using caches but incurs the cost of purchasing expensive disk array systems. Another alternative approach is to replicate the state of a database server across one or more backup servers (a.k.a. replicas) for fault tolerance. If the states of all the replicas are kept consistent, then database requests can be served as long as at least one of the replicas does not fail. However, it is challenging to implement a working and scalable replication solution for transaction processing [1, 4, 7, 11, 21]. Eagerly updating replicas as part of a transaction may incur significant overhead, while lazily updating replicas after transactions commit may result in loss of transactions, stale data versions, and/or complicated conflict resolution problems. Even if a replication scheme could replace transactional logging, purchasing backup servers multiplies the cost of ownership.
1.3 Our Approach: Exploiting Flash Devices We would like to find a synchronous logging solution that is efficient, inexpensive, and simple. In this paper, we study flash devices as a promising candidate for such a solution based on the following observations: • Efficiency: There are no moving components in flash devices. Therefore, flash devices do not suffer from the limitation of magnetic disks. We observe that for small sequential writes, flash devices are up to 9X faster than magnetic disks. • Low Price: Flash memory capacity has been increasing and its price per GB decreasing exponentially [23] thanks to the demand in the mobile and embedded markets. Note that although the capacity of flash de-
74
vices (e.g., 1—32GB) is often smaller than that of magnetic disks, it is typically sufficient for synchronous logging (whose requirements are detailed in Section 3.1). • Simplicity: Unlike replication schemes discussed in the above, the design impact of employing flash devices for logging can be constrained to the logging subsystem, thereby avoiding significant changes to the entire database system. Traditionally, flash devices have been favored in the mobile and embedded markets because of their energy efficiency, shock resistance, small form factors, and good performance. Recently, flash memory has been regarded as an alternative (replacement or addition) to magnetic disk technology, with new products, such as Solid State Drives (SSDs), targeting the mainstream computing market. Recent research studies have investigated the use of flash devices in various aspects of data management systems [3, 5, 10, 18, 19, 20, 24, 25, 29, 30, 32, 35]. We focus on exploiting flash devices for synchronous logging in this paper. Comparing a wide variety of flash devices, we find that USB flash drives are particularly suitable for synchronous logging because of its unique characteristics: (i) widely available USB ports on almost all modern computers, (ii) hotplug capability useful for coping with flash wear, and (iii) low prices so that multiple drives can be used for better performance. Previous study [20] shows that SSDs can significantly improve transactional logging performance. In Section 5, we compare our solution with designs using a stateof-the-art SSD and find that although SSDs improve logging performance, multiple USB flash drives can achieve comparable or better performance with much lower price. We propose F lashLogging, a logging solution that exploits multiple (USB) flash drives and addresses the following four key challenges: • Efficiently exploiting an array of flash drives. We find that the conventional array organization (in disk arrays), which stripes data across all the drives in a round-robin manner, results in sub-optimal behaviors (such as request splitting or skipping) for synchronous logging. In fact, the goal of this round-robin organization is to support random access pattern well. However, synchronous logging mainly performs sequential writes during normal operations and sequential reads during recovery, while random accesses for given Log Sequence Numbers (LSNs) are rare. Therefore, we can employ an unconventional array organization, which only enforces that the LSNs written to each individual device are non-decreasing, thus enabling request scheduling to maximize logging performance. • Coping with large variance of write latencies. We observe that most writes to flash devices are fast but occasionally some outlier writes incur delays that are much longer—possibly orders of magnitudes longer for some devices. The behavior can be explained by the sophisticated flash block erasure and management operations in flash devices [9]. To reduce its negative impact, we leverage multiple flash drives to hide the outlier latency. Because of the difficulty in predicting outliers, we instead propose a solution that performs outlier detection. We find that an adaptive outlier detection and hiding scheme is desirable. • Efficient recovery processing. Recovery processing consists of two steps: (i) locating the log record corre-
sponding to a given checkpoint LSN; and (ii) scanning the log sequentially until the crash point. (i) is a rare random access to the log. Since we maintain the invariant of non-decreasing LSNs for all devices, we can perform binary searches for random accesses. For further narrowing the search range, we construct a low-cost index structure on each device during normal logging operations. For (ii), multiple flash drives are scanned concurrently, providing larger read bandwidth. • Combining USB flash drives with disks for better logging and recovery performance. Although magnetic disks have poor performance for small sequential writes, they are competitive to or better than USB flash drives for writes that are 32KiB or larger. Disks also support larger sequential read bandwidth, which is important for recovery processing. We propose to include a disk drive in F lashLogging as a nearzero-delay archival log device. During normal processing, the disk performs log flushes as soon as log data is more than a predefined size S (e.g., 32KiB). Logging performance is improved because the disk can serve requests when all the flash drives are busy. Moreover, a large portion of the log can be read from the archival log disk, achieving good recovery scan performance.
1.4 Contributions This paper makes the following main contributions. First, we identify USB flash drives as a good match for synchronous logging (Section 2). To our knowledge, this is the first study to exploit USB flash drives for synchronous logging. Second, we propose F lashLogging, a logging system design that addresses four key challenges and exploits multiple flash drives for good performance (Section 3). Third, we implemented F lashLogging as the logging subsystem in MySQLInnoDB (Section 4) and performed extensive real-machine experimental evaluations using TPCC workloads (Section 5). Experimental results show that F lashLogging achieves up to 5.7 times improvements over magnetic-disk-based logging, obtaining up to 98.6% of the ideal performance, while recovery times are similar. Finally, we compare F lashLogging with designs employing SSDs. Experimental results show that naively employing SSDs already significantly improves logging performance, that F lashLogging can further improve the performance of a SSD by dividing it into multiple partitions and treating the partitions as virtual flash devices, and that compared to a single SSD, multiple USB flash drives can achieve comparable or better performance with much lower price.
2.THE CASE FOR EXPLOITING USB FLASH DRIVES FOR SYNCHRONOUS LOGGING In this section, we make the case for exploiting USB flash drives for synchronous logging. Section 2.1 compares the performance characteristics of flash devices and magnetic disks. Then Section 2.2 compares a wide variety of flash devices to show that USB flash drives are a good match for the task of synchronous logging.
2.1 Flash Devices vs. Magnetic Disks Both magnetic disks and flash devices are non-volatile. There are two types of flash memory: NAND and NOR. NAND is targeted at mass storage devices and is the focus of
75
sequential read
sequential write
1M
2M 2M
512K
256K
128K
64K
(b) Sequential write performance
random read
random write
1000.00
read request size (bytes)
512K
256K
128K
64K
32K
0.01
16K
0.10 8K
2M
1M
512K
256K
128K
64K
32K
16K
8K
4K
2K
1K
0.10
1.00
4K
1.00
10.00
2K
10.00
100.00
1K
100.00
512
average time (ms)
1000.00
512
average time (ms)
32K
write request size (bytes)
(a) Sequential read performance
0.01
1M
read request size (bytes)
16K
0.01
8K
0.10
2M
1M
512K
256K
128K
64K
32K
16K
8K
4K
2K
0.01
1K
0.10
1.00
4K
1.00
10.00
2K
10.00
disk flash-A flash-B flash-C ssd disk-wce
100.00
1K
100.00
512
average time (ms)
1000.00
512
average time (ms)
1000.00
write request size (bytes)
(c) Random read performance
(d) Random write performance
Figure 3: Comparing the performance of four flash devices and a 10k rpm magnetic disk drive. (Flash A, B, and C: three USB flash drives from three different vendors. SSD: a state-of-the-art SSD with 250MB/s peak read bandwidth and 70MB/s peak write bandwidth. disk-wce: write cache enabled.) formed on a PowerEdge 1955 blade server using the block device interface on Linux. The devices are opened with the O_DIRECT|O_SYNC flag in order to avoid operating system cache effects as much as possible. Elapsed times are measured with the rdtsc (Read Time Stamp Counter) x86 instruction in cycles, then converted to wall-clock times by dividing the CPU frequency. We vary the I/O request size from 512B to 2MiB. The requests are all aligned on requestsize boundaries. A data point shown represents the average of 10,000 requests of the same type for 512B–32KiB sizes, and 1,000 requests for 64KiB–2MiB sizes. As shown in Figure 3, the low-end flash devices have better small sequential write performance and better random read performance compared to the disk. This is expected because flash devices do not suffer from the mechanical limitations of magnetic disks. However, the low-end flash devices suffer from worse random write performance because random writes often incur expensive erase and erase unit management operations. Moreover, the sequential read performance of low-end flash devices is much lower than the disk. This is partly limited by the target use model and price range of the devices. In contrast, the SSD has better or comparable performance than the disk in all aspects. An explanation is that these high-end flash devices can exploit the parallelism of many flash memory chips. Studying the characteristics more closely, we make the following observations related to synchronous logging. First, sequential write performance is the most important characteristics for synchronous logging. As shown in Figure 3(b), the 10k rpm magnetic disk suffers from a full 6ms rotational delay for every small write. Compared to the disk, the flash devices are 1.2–9.4 times faster when write sizes are 16KiB or smaller. Moreover, compared to the SSD with write cache disabled, the low-end devices have compa-
this paper. NAND flash devices support the logical block addressing interface similar to magnetic disks; read/write I/Os can be performed on 512-byte sized logical blocks. However, unlike magnetic disks, flash memory does not contain moving components. A NAND flash memory chip is composed of flash blocks (e.g., 128KiB–512KiB large). Every flash block consists of flash pages (e.g., 512B–4KiB large). Only clean pages can be directly written (a.k.a. programmed). Before overwriting a page that contains data, a flash device has to erase the entire flash block. Such an erase operation is often an order of magnitude slower than a write operation. To avoid confusions with the 512-byte sized logical blocks at the device interface, we refer to a flash block as a flash erase unit in the rest of the paper. Moreover, flash memory has a finite number of erase-write cycles. A flash erase unit can typically endure 100,000 erase-write cycles [31]. A flash device contains a controller and one or more flash memory chips. For example, SSDs often contain tens of flash memory chips [15]. To cope with the erase-write constraints, flash controllers employ erase unit mapping and wear-leveling algorithms in order to reduce the number of erase operations and evenly distribute them to physical flash erase units [9]. As a result, flash devices often have very different performance characteristics from flash memory chips. Figure 3 compares the sequential/random read/write performance of four flash devices and a 10k rpm disk. The three USB flash drives in the experiment represent low-end flash devices, while the SSD2 represents high-end flash devices. The write caches of the disk and the SSD are disabled unless otherwise noted. All the experiments are per2
The SSD was released in Fall, 2008. It has been shown by third party to perform significantly better than several previous SSD products [15].
76
Table 1: Comparing properties of flash devices.
that the active online log size is consciously kept small (e.g., a few hundred MBs) in order to reduce recovery time. Log capacity can be easily provided by magnetic disks that archive the log. Because of the low prices, a logging solution can exploit multiple drives to achieve better performance. Our experimental results in Section 5.4 show that multiple USB flash drives can achieve comparable or better performance with lower price than a state-of-the-art SSD.
Interface Interface Easily Price/ availability bandwidth replaceable capacity† USB flash drive good good yes $15/8GB PCMCIA card laptops good yes $80/1GB CompactFlash digital good yes $20/8GB MicroSD etc. cameras Solid state drive good excellent possible $350/80GB † Data were obtained from shopping web sites in April 2009.
rable sequential write performance, suggesting the potential of using low-end flash devices for synchronous logging. Second, sequential read performance is important for recovery processing. As shown in Figure 3(a), the low-end flash devices are 2.6–11.4 times slower compared to the disk, posing a challenge for achieving good recovery performance. We will address this challenge in Section 3.6. Finally, flash devices have faster random read performance than disks, which we leverage in our solution (in Section 3.6).
3. FLASHLOGGING DESIGN
2.2 USB Flash Drives are a Good Match for Synchronous Logging
3.1 Synchronous Logging Requirements
We propose F lashLogging, a synchronous logging solution that exploits multiple (USB) flash drives. In this section, we first summarize the requirements of synchronous logging that we learned from MySQL-InnoDB in Section 3.1. We present the overall architecture of F lashLogging in Section 3.2. Then we describe our techniques and algorithms for addressing the four challenges in Section 3.3–3.7. We study MySQL with InnoDB as the backend storage engine. MySQL provides a database frontend with SQL query parser, optimizer, and query processing algorithms, while InnoDB supports the in-memory buffer pool, transaction processing, and write-ahead logging. The following summarizes the requirements of synchronous logging that we learned from the MySQL-InnoDB implementation: • The online log is circular. Its size is kept small (e.g., a few hundred MBs) to reduce recovery time. Note that log capacity can be easily provided by archiving the online log with large-sized writes (to disks). • During normal processing, sequential log writes are the frequent operation. A 64-bit Log Sequence Number (LSN) is assigned to each write, which uniquely identifies the log record. The LSN is monotonically increasing and represents the log offset if the log size were infinite. • During normal processing, checkpoints are periodically written to well-known fixed locations in the log. Compared to the normal log writes, checkpoint frequency is very low. A checkpoint contains a checkpoint LSN and a checkpoint number. This LSN corresponds to the oldest modified data page in the database buffer pool; all data changes before this LSN are already on disks. InnoDB guarantees that all committed log records since the last checkpoint LSN are in the online log by (i) flushing log records when transactions commit, and (ii) monitoring log wrap-around margins and flushing old dirty buffer pool pages accordingly so that log wrap-arounds are correct. • During recovery processing, InnoDB first locates the log record corresponding to the LSN recorded in the last checkpoint. Then the log is sequentially scanned until the crash point (i.e. log blocks containing inconsistent checksums or LSNs). After the log scan, necessary redo operations are carried out.
There are many different types of NAND flash based storage devices: e.g., USB flash drives, PCMCIA cards, CompactFlash, MicroSD, and Solid State Disks (SSDs)3 . Table 1 compares the properties of these flash devices. We find that USB flash drives are a good match for synchronous logging for the following reasons: • USB ports are widely available. In contrast to interfaces of PCMCIA cards, CompactFlash, and MicroSD, USB ports are widely available in all kinds of computer systems. This is true even for blade servers with very compact designs. The PowerEdge 1955 blade servers in our experiments support two USB ports with an extension cable shipped with the machine. Therefore, solutions based on USB flash drives can be readily employed in almost all modern computers. • USB bus bandwidth is good for logging. From our experiences with running MySQL on blade servers, the USB 2.0 bus bandwidth (60MB/s) is sufficient for synchronous logging purpose. Moreover, the upcoming USB 3.0 specification [6] targets 600MB/s (or 4.8Gbit/s) bandwidth, which is greater than the logging bandwidth required by even the highest rated TPCC performance results [34]. • The hot-plug capability allows easy replacement of drives. Even with wear-leveling support, a flash drive may wear out more quickly than magnetic disks due to the frequent log writes. For example, the peak write bandwidth of a USB flash drive is typically 10– 20MB/s. Therefore, it takes at least 400 seconds to write an entire 8GB drive once. Given the 100,000 erase-write cycles, an 8GB drive can last at least 462 days in the worst case. Note that this worst-case lifetime increases proportionally with device capacity. • The price of an individual drive is low. Compared to SSDs, the price of an individual USB flash drive is much lower. In April 2009, an 8GB USB flash drive costs about $15. The drive capacity is good for logging purpose. our experiences with MySQL show
3.2 FlashLogging Architecture Figure 4 depicts the overall architecture of a F lashLogging system. We employ a simple producer-consumer design. A set of interface routines accept logging requests. Log records are cached in an in-memory log buffer (e.g., 16MiB in our
3
For synchronous logging purpose, SSDs represent the performance and prices for all devices targeting the mainstream mass storage market (e.g., including hybrid drives).
77
Worker
In-memory log buffer
8 6 4 2 0
2 4 8 16 32 num requesters
(a) flash-A
Figure 4: FlashLogging architecture.
8
no-split split
6 4 2 0
10
bandwidth (MB/s)
Request queue
bandwidth (MB/s)
Worker
10
10
Interface: write, flush, checkpoint; recovery
bandwidth (MB/s)
Archival Worker
8 6 4 2 0
2 4 8 16 32 num requesters
(b) flash-B
2 4 8 16 32 num requesters
(c) flash-C
Figure 5: Micro-benchmark results comparing two cases: (left bars) processing 4KiB requests, and (right bars) splitting each 4KiB requests into two then processing the split requests. Two drives of each device are used in the experiments.
experiments). Upon a flush call, the system creates request node(s) for all the log data since the last flush call, and appends it to the request queue. A request node contains begin and end pointers to the actual log data in the log buffer. Each logging device is serviced by a dedicated worker thread. The worker thread obtains new requests from the request queue and performs the requested I/O operations. Optionally, a disk is employed for both archival purpose and for better logging and recovery performance (as will be described in Section 3.7). The architecture for recovery processing is similar except that the data flow is reverse: The workers read data from the devices into the log buffer, while the interface routines deliver log data from the log buffer to upper-level callers. As will be shown in Section 5, this simple design achieves good logging performance.
Second, if the stripe unit size S is large, request splitting is less frequent, while request skipping occurs more frequently. Imagine that the request queue contains a number of small requests R1 , R2 , ..., Rm . Because of the large stripe unit size, several consecutive requests may fall into a single stripe unit. For example, a worker starts working on R1 before the other requests arrive. R1 + ... + Ri ≤ S, while Ri+1 starts a new stripe unit. As a result, a second worker may be constrained to skip many early requests in the queue because the requests do not belong to the corresponding device. There could be two consequences: (i) response times for the skipped requests are longer than necessary, which may in turn impact throughput in a closed-loop system, such as TPCC; (ii) the request queue may not be long enough (e.g., Ri+1 does not exist yet), and the device may be forced to be idle since no requests belong to the device. To avoid these sub-optimal behaviors, we would like to exploit the special access pattern of synchronous logging to organize the array in an unconventional way.
3.3 Exploiting an Array of Flash Drives What’s wrong with the conventional array organization? In a conventional array design, data are striped across the array of devices in a round robin manner. If there are N devices and the stripe unit size is S, then data at address A are found on the k-th device, where k = ⌊A/S⌋ mod N. In this way, the physical location of data can be computed easily, enabling fast random accesses. However, the major access pattern in synchronous logging is small sequential writes during normal processing and sequential reads during recovery. Random data access is rare. On the other hand, round robin addressing may result in behaviors such as request splitting and/or request skipping, incurring unnecessary overhead for our purpose. First, request splitting occurs if the log data to flush is larger than the stripe unit size S. Under conventional array organization, the log data has to be split into multiple request nodes to be serviced by multiple devices. This may occur frequently if S is small. Request splitting can be suboptimal because for small sequential writes, the latency TR of a request size R satisfies T2R < 2TR , as evidenced in Figure 3(b). In other words, if there are two homogeneous devices and two outstanding requests of size 2R, processing two 2R-sized requests are faster than splitting the requests and processing four R-sized requests. To confirm this observation, we perform a set of micro benchmark experiments, as shown in Figure 5. The experimental setting is similar to that described in Section 2.1. In each experiment, two USB flash drives serve 2–32 concurrent requesters, who repeatedly sends 4KiB-sized flush requests. The X-axis varies the number of requesters. The Y-axis shows the aggregate writing bandwidth of the two drives. From Figure 5, we see that compared to request splitting, no splitting achieves 1.41–1.51X higher bandwidth for flashA, 1.79–1.83X for flash-B, and 1.13–1.85X for flash-C.
Unconventional Array Design. Because the major access patterns are sequential for logging and recovery, the conventional array organization is unnecessary. Instead, we propose an unconventional array organization: Log data can be appended to a device as long as the LSNs on the device are non-decreasing. Here, we sacrifice the ability to quickly compute the locations for random accesses. In return, the log data since the last flush can always be formed to a single request node, and be processed by a single device, thereby avoiding the request splitting and skipping problems. The invariant of non-decreasing LSNs is naturally satisfied because of the property of logging4 . This invariant enables the system to support rare random accesses through binary searches on the flash drives.
3.4 Coping with Outlier Writes Sequential writes have large variance. Figure 6 shows the individual request latencies of 5000 back-to-back sequential writes of fixed request size for the three USB flash drives in our study. Figure 6(a) and (b) show the results for 512B and 4KiB requests, respectively. The experimental setting is similar to that described in Section 2.1.5 4 The rare event that a 64-bit LSN wraps around can be easily detected and specially handled. 5 We use a pair of rdtsc’s to measure latencies. The measurement overhead is less than 1/10000 of the lowest reported latencies.
78
(a)
(b)
average latency (ms)
Figure 6: Large variance of elapsed times for 5000 back-to-back sequential writes. (Note the different Y scales for different devices.) As shown in Figure 6, we see that the elapsed times display a bimodal distribution: Most writes are fast while a number of long latency writes take possibly orders of magnitude longer time to complete. We call these long latency writes outliers. An explanation for outlier writes is that these writes somehow trigger the device to perform management tasks such as wear-leveling and erase unit management [9]. Since outlier writes may have a negative impact on the response time and throughput of the logging system, we investigate how to minimize such impacts.
3.5 3.0 2.5 2.0 1.5 1.0 0.5 0.0
normal stream1 stream2
flash-A
flash-B
flash-C
Figure 7: Writing two separate sequential streams to a single USB flash drive.
Outlier prediction is difficult. The first idea that comes to our mind is to accurately predict the outliers and proactively avoid them by sending dummy write requests to devices that are predicted to experience outliers at the next writes. However, as shown in Figure 6, we find that accurate outlier prediction is difficult. First, outlier patterns are different across different devices. Second, outlier patterns may be different for different request sizes, which cannot be predicted by combining simple statistics, such as the number of requests and the aggregate request size since the last outlier. Third, the number of requests between outliers may change even if both the request size and the device are fixed, as evidenced with flash-A and flash-B in Figure 6. Finally, when back-to-back requests of different sizes are measured (not shown in the figure), we see that outlier pattern is much less obvious from what are shown in Figure 6. We believe these complications are caused by the large variety of sophisticated erase unit mapping and wear-leveling algorithms implemented in different devices [9].
However, a problem arises: At the time of detection, an outlier request must have existed for quite some time, and its LSN may be smaller than the LSNs of all ready devices. In such situations, the request cannot be re-issued because of the invariant of non-decreasing LSNs. Unfortunately, this frequently happens as will be shown in Section 5.2. Our solution to this problem is to take advantage of an observation of flash devices: they often support a limited number of (separate) sequential write streams well. This property is called semi-randomness [24]. Micro-benchmark experiments in Figure 7 confirm this observation. In the experiments, we generate two sequential write streams of 4KiB sized writes: 99% of the writes are in “stream1”, which models the main logging use of the device, while the rest 1% of the writes go to “stream2”, which models the area for re-issuing outlier requests. “normal” latency of a single streams of 4KiB writes is provided for comparison purpose. As shown in Figure 7, the latencies of stream2 are comparable or moderately worse than stream1. In summary, we reserve an area on each device for outlier hiding. Upon outlier detection, we re-issue the outlier request to the outlier hiding area on a different ready device. Note that we also maintain the invariant of non-decreasing LSNs for the outlier hiding areas. In this way, during recovery, we can simply treat these areas as “pseudo” devices and perform the same processing as a normal device.
Outlier Detection and Hiding. The good news is that outliers can be easily detected because of the bi-model distribution. Therefore, instead of outlier prediction, we propose to perform outlier detection. To do this, we measure the average sequential write latencies for different request sizes for a device, and list the latencies in a table as part of the device description. In this way, a worker can estimate the average latency of a request by interpolation using the table. A request that takes longer than twice the average latency is considered an outlier. Upon detecting an outlier, we would like to re-issue the same request to a different ready device in hope that the re-issued request completes faster than the outlier, thus hiding the outlier latency.
3.5 Logging Algorithm Figure 8 shows the logging algorithm. The algorithm uses an in-memory log buffer, and three queues for new
79
requests (new_queue), busy requests (busy_queue), and completed but not released requests (done_queue), respectively. Several LSN (Log Sequence Number) variables record the last known LSN on stable media (LSN_done), the end LSN of all flush requests (LSN_flushreq), and the end LSN of the in-memory log buffer (LSN_write).
Global variables: CircularBuffer log_buf; UInt64 LSN_write, LSN_flushreq, LSN_done; ReqQueue new_queue, busy_queue, done_queue; Bool is_outlier_hiding; UInt64 LSN_archived; Worker private variable: LogDevice stream1; LogDevice stream2;
Frontend Functions. A transaction calls frontend_write to append log records to the in-memory log buffer (L.3). When the transaction commits, it calls frontend_flush with the largest LSN of all its log records. frontend_flush determines whether the request is already serviced (L.6) or being serviced (L.7). If not, it composes a new request, including all new log data (L.8).6 Then it enqueues and waits for the request to complete (L.10–12).
frontend_write(logdata, size) 1. while (log_buf.avail < size) 2. waiting for log buffer space; 3. append logdata to log_buf; 4. LSN_write += size; 5. return LSN_write;
Worker Algorithm. A worker is dedicated to serving requests for a device. In an infinite loop, a worker checks and calls process_req for new requests (L.9–12). process_req sets the owner of the request (L.15) and enqueues the request into busy_queue (L.18). The worker records the last LSN for the device (L.21) and performs blocking I/O for the request (L.22). When completed, it checks to see if it still owns the request (both outlier hiding and archival disk worker in Section 3.7 may change the ownership). If yes, then the worker moves the request to done_queue (L.24). Note that the worker notifies a frontend transaction that is blocking on a request r only if request r and all previous requests have completed (L.25–28).
frontend_flush(LSN) 6. if (LSN =stream2.last_lsn)) 7. process_req(r, stream2); 8. goto Infinite_worker_loop; 9. if (new_queue is not empty) 10. r= dequeue(new_queue); 11. process_req(r, stream1); 12. goto Infinite_worker_loop; 13. block waiting for notification; 14. goto Infinite_worker_loop;
Unconventional Array Organization. Our algorithm avoids request splitting because frontend_flush composes a request from all the new log data (L.8). Request skipping is avoided because a worker can process any new request (L.10–12). The invariant of non-decreasing LSNs is naturally achieved. New requests are generated with increasing LSNs in frontend_flush. Therefore, the first-in-first-out nature of a queue guarantees that at any worker, the LSNs of de-queued requests (L.10) are non-decreasing. Adaptive Outlier Detection and Hiding. Before performing I/O for a request, a worker Wi computes an estimated maximum end time of the request (L.17). Later, another worker Wj may find that the maximum end time has passed (L.5), thus detecting an outlier. Upon outlier detection, worker Wj re-issues the request to its outlier hiding area (L.7) if the invariant of non-decreasing LSNs of this area holds (L.6). For simplicity, we do not check if a reissued request is again an outlier by setting the end time of the re-issued request to infinity (L.20). Note that an outlier request eventually takes at least three times of the average latency (for detection and re-issuing). Moreover, outlier hiding incurs additional I/Os. Therefore, the significance of outlier hiding is device dependent: The larger the latency difference between outliers and normal requests, the more significant impact outlier hiding can have, as will be shown in Section 5.2. Therefore, we propose to use an adaptive algorithm. In Figure 8, the global variable is_outlier_hiding enables/disables outlier detection and hiding in the worker algorithm (L.2–8). The adaptive algorithm can initially enable outlier hiding, then measure the number of outliers successfully hidden to determine whether to continue or disable outlier hiding.
process_req(r, stream) 15. r.owner= this_worker; 16. if (stream == stream1) // new request 17. r.end_threshold= get_current_time() + 2*avg_latency(r.size); 18. enqueue(busy_queue, r); 19. else // re-issue outlier request 20. r.end_threshold= infinity; 21. stream.last_lsn= r.end_lsn; 22. perform blocking device I/O for r; 23. if (r.owner == this_worker) 24. move r from busy_queue to done_queue; 25. if (r.start_lsn == LSN_done+1) 26. release contiguous done requests and wake up frontend_flush; 27. release log buffer space, and wake up frontend_write; 28. update LSN_done;
Figure 8: Logging algorithm. (Details of synchronization between the frontend and the workers, and 512B log block alignment are omitted for clarity.)
6 Requests must be multiple of 512B blocks. Details are omitted for clarity and will be discussed in Section 4.
80
start_lsn prev_section_lsn[]
Section 0
header
common block
Section 1
archival_worker() 1. Infinite_archival_worker_loop: 2. while(LSN_write – LSN_archived < 32KiB) 3. waiting for more frontend writes; 4. perform blocking I/O for up to LSN_write; 5. update LSN_archived; 6. if (LSN_done < LSN_archived) 7. process all queues, release requests, wake up frontend_flush, free buffer space, wake up frontend_write; 8. LSN_done = LSN_archived; 9. goto Infinite_archival_worker_loop;
Section k
(a) A log device is divided into sections, each with a header block. header 1
Section 0
header 2
header 0
Section 1
Section k
(b) Header blocks are non-leaf nodes in the index structure.
Figure 10: Archival worker algorithm.
Figure 9: A simple index structure on a log device.
32KiB or larger. Therefore, we may improve the logging performance by including a disk in the design. For achieving the goal, we propose to flush log data to the disk as soon as log data is more than a predefined size S (e.g., 32KiB in our experiments). We call such a disk a nearzero-delay archival disk because the disk eagerly archives data larger than S. Figure 10 shows the archival worker algorithm. Whenever the unarchived log data (including log data in memory) is at least 32KiB, the archival worker flushes the data to the archival disk (L.4). If log data is archived before the associated normal flush requests complete (L.6), the archival worker will consider these requests as completed, set ownership of the requests, and wake up frontend transactions that are blocking on the requests (L.7), thereby potentially improving logging performance. During recovery processing, the starting LSN is mostly likely found on the archival disk. Therefore, the system first performs the log scan on the archival disk, followed by scanning (a small portion of) the flash drives. The starting points of the latter can be found similarly using binary search as described in Section 3.6.
3.6 Efficient Recovery Processing From the perspective of the logging subsystem, recovery processing consists of two main steps: (i) locating the log record corresponding to the LSN in the last checkpoint; (ii) scanning the log sequentially until the crash point. Essentially, step (i) performs a random read operation. As discussed in Section 3.3, we can support random accesses by performing binary searches on the flash drives because of the invariant of non-decreasing LSNs. We can further improve the performance by constructing a simple index structure to narrow the search scope, as shown in Figure 9. The space of a log device is divided into equal-sized sections with wellknown starting offsets. As shown in Figure 9(a), the first block (called header) in a section records meta-information: (i) the starting LSN of the current section; and (ii) a small array mapping equally strided logical blocks to LSNs for the previous section. During normal processing, when a worker is working on section i-1, it generates the content for the header of section i. After section i-1 is filled, the worker moves onto section i. At this point, it can write out the header of section i while maintaining the sequential write pattern. As shown in Figure 9(b), the header blocks form a simple index structure. To locate the block for an random LSN, the system searches the section headers to narrow the search range before performing binary searches for the block. For step (ii), the F lashLogging architecture allows scanning multiple devices in parallel for good scan bandwidth. During recovery, workers pro-actively read data in chunks (e.g., 64KiB) into the in-memory log buffer. The log blocks in the chunks are then merged according to the ascending LSN order and delivered to the upper-level recovery processing requesters. A global variable, delivered_lsn, is maintained. The workers compare delivered_lsn with the LSNs of the last read chunks, and check the availability of inmemory buffer in order to determine whether or not to perform new chunk read I/Os
4. IMPLEMENTATION We implemented F lashLogging as the logging subsystem in MySQL version 5.0.24a with InnoDB as the backend storage engine. We modified MySQL to recognize a configuration variable in MySQL’s my.cnf configuration file to decide whether to use the original logging subsystem or the F lashLogging subsystem. The configuration file also specifies the devices to be used in F lashLogging. F lashLogging supports an array of K (K ≥ 1) homogeneous devices and an optional archival device. The device paths, capacities, and starting offsets are specified in the configuration file. F lashLogging uses the Linux open system call to open the devices. In a typical setting, we will specify K flash devices and zero or one archival magnetic disk device. In this way, raw devices are used. In contrast, MySQL-InnoDB does not support raw devices as the logging media. The log is configured as a set of normal file system files. This may pose disadvantages for MySQLInnoDB. To compensate for this, we run two sets of experiments for disk-based logging. The first sets use MySQLInnoDB with log files. The second sets use F lashLogging and specify the disk device as a single logging device. The former may have better code quality, while the latter enjoys the raw device interface. In our experiments, we report the better of the two cases. Overwriting data at the same logical address is an expensive operation for USB flash drives, which often triggers an
3.7 Combining USB Flash Drives and Disks for Better Performance We propose to optionally include a disk in F lashLogging. Our goal is three-fold. First, the disk can serve as a large capacity archival device to complement our online logging design. Second, recovery scan described in Section 3.6 is limited by the maximum USB bus bandwidth (60MB/s), while a magnetic disk may provide larger recovery scan bandwidth. Third, as shown previously in Figure 3(b), magnetic disks are competitive to USB flash drives for writes that are
81
erasure of an entire (128–512KiB) flash erase unit, incurring performance overhead and reducing devices’ life time. We observe in micro-benchmark experiments (not shown due to space limitation) that if subsequent writes overlap even a small part (512B) of the previous ones, the write performance can degrade drastically (up to 60.8X worse) for some USB flash drives. In the original MySQL logging implementation, overlapping writes are common. A flush request r may end in the middle of a 512B block x. Because of the block device interface, the entire x is flushed. A subsequent request s will continue to use the unused portion in x. When s is to be flushed, x has to be re-sent to the device, resulting in an overlapping write. In F lashLogging, a worker always appends a flush request to its device and avoids any overlapping writes. This entails that multiple log blocks (possibly partially full) with the same LSNs may exist. During recovery processing, F lashLogging merges multiple log streams in the LSN order. When it sees two 512B blocks with the same LSN in the header, it chooses the full block or the block with more data. For outlier hiding purpose, the configuration file can optionally contain a path to a characteristics file with the device’s average sequential write latencies for different request sizes. If such a file is configured, F lashLogging will read the file content to build a latency table and use it to implement avg_latency in Figure 8 (L.17). Otherwise, is_outlier_hiding is set to false to disable outlier hiding and avg_latency always returns infinity.
5.
TPCC Workload. We configure an MySQL 5.0.24a database server to run on one blade server and store data on one of its disks, while storing the circular transactional log on the other disk, or on flash drives. Transaction isolation level is set to be serializable. We configure the database inmemory buffer pool to use 2GB of the main memory. The number of warehouses in the TPCC benchmark is chosen to be 20. As reported by the “show table status” statement, the resulting database size, including database tables and indices, is 1803.6 MB. Therefore, the entire database and its indices are memory resident. The circular log size is set to be 900 MB. Note that as discussed in Section 3.1, MySQL-InnoDB performs background writes for dirty buffer pool pages to guarantee the correctness of the wrap-rounds of the circular log. We enhanced MySQL-InnoDB with (i) implementation of F lashLogging and (ii) instrumentation for statistics. The other blade server runs an open source TPCC driver, based on OSDL DBT2 version 0.39 [28]. Originally, the driver has a two-level thread architecture: The first level threads generate TPCC requests, send the requests to the second level threads through Unix sockets, which connect and forward the requests to the database server through TCP connections. We simplified the driver by combining the two levels: Each thread maintains a persistent TCP connection to the database server, and repeatedly generates and sends transaction requests to the server. TPCC think time is set to be zero to maximize the load at the database server. The number of client threads is an adjustable parameter, which we vary from 1 to 128 in our experiments.
PERFORMANCE EVALUATIONS
In this section, we present real-machine experimental evaluations for F lashLogging using TPCC workloads. We first describe the experimental setups in Section 5.1. Then we present experimental results for the logging and recovery experiments in Section 5.2 and Section 5.3, respectively. Finally, we compare F lashLogging with designs that employ SSDs in Section 5.4.
5.2 Logging Performance For every logging experimental result, we run TPCC test for the configuration for 60 minutes and report the average transaction rate, NOTPM (New Order Transactions Per Minute), as was output from OSDL DBT2. Before every test run, we perform three preparation steps to ensure that the size of the TPCC database is roughly the same, and the MySQL-InnoDB buffer pool is warmed up. First, we rebuild the TPCC database by dropping the entire database, creating the database, creating tables and indices, loading the table data, and loading stored procedures for TPCC transactions. Second, we perform a “select count(*) from table” for every TPCC table. Third, we run 10 minute TPCC test with 20 clients.
5.1 Experimental Setup Machine Configuration. Two Dell PowerEdge 1955 blade servers are used in the experiments. Each machine is equipped with a 3.0GHz Intel 5160 Woodcrest CPU (dual core, two hardware threads per core), 4MB L2 cache, 4GB DRAM, and two 73GB 10K RPM SAS (Serial-Attached SCSI) disks, running Linux 2.6.17-10. The two machines are connected through 1Gbps Ethernet.
Overall performance. Figure 11 compares the transaction performance of disk-based logging, F lashLogging, and the ideal case. From Figure 11, we can see the following points. First, disk-based logging is a major bottleneck. As shown in Figure 11(a), disk-based logging obtains only 11.2%–29.9% of the ideal case performance. As the number of concurrent clients increases from 1 to 128, the transaction rates first increase then decrease, with the peak being around 32 clients.7 (Figure 1 in Section 1 shows the 32-client points.) Second, employing USB flash drives naively in MySQLInnoDB achieves marginal gains at best, as shown in Figure 11(a). This is mainly because the original InnoDB logging system performs overlapping writes, which incurs poor performance for USB flash drives.
Logging Devices. We use the same devices as in the characteristics study in Section 2.1. An extension cable supports up to two USB ports. Therefore, we use up to two USB flash drives for flash-A, flash-B, and flash-C. In every configuration, the devices in a flash array are homogeneous. The capacity of the USB flash drives range from 1 to 4GB. For experiments in Section 5.4, we replace one of the disks in a blade server with the SSD. The write caches of the logging devices are disabled unless otherwise noted. The devices are opened with the O_DIRECT|O_SYNC flag to avoid operating system cache effects as much as possible. We report experimental results for the following logging device configurations: disk, ideal (i.e. disk with write cache enabled), three configurations for each flash device (1f: one drive, 2f: two drives, 2f-1d: two drives with an archival disk), and multiple designs that employ SSDs.
7
In our experiments, the number of clients is a power of 2. Therefore, the best transaction rates should be achieved in the range of (16, 64).
82
NOTPM
NOTPM
35000 30000 25000 20000 15000 10000 5000 0 1
2
4 8 16 32 number of clients disk ideal flashB flashC
64
1
128
4 8 16 32 number of clients disk ideal 2f 1f
64
4 8 16 32 number of clients disk ideal 2f 1f
64
128
2f-1d
(b) F lashLogging with USB flash drive A
NOTPM
NOTPM
(a) Employing USB flash drives naively
2
2
flashA
35000 30000 25000 20000 15000 10000 5000 0 1
35000 30000 25000 20000 15000 10000 5000 0
35000 30000 25000 20000 15000 10000 5000 0
128
1
2
2f-1d
(c) F lashLogging with USB flash drive B
4 8 16 32 number of clients disk ideal 2f 1f
64
128
2f-1d
(d) F lashLogging with USB flash drive C
256KiB
64KiB
128KiB
(a) Normalized to disk (b) Normalized to ideal Figure 12: Normalized throughputs for the 32-client cases in Figure 11(b)–(d).
0%
32KiB
flashA flashB flashC
20% 16KiB
0%
flash-A flash-B flash-C
40%
8KiB
20%
60%
4KiB
40%
80%
2KiB
60%
100%
1KiB
flashA flashB flashC
80%
512B
normalized performance
100%
1f 2f 2f-1d 1f 2f 2f-1d 1f 2f 2f-1d
6 5 4 3 2 1 0
1f 2f 2f-1d 1f 2f 2f-1d 1f 2f 2f-1d compared to ideal
improvement over disk
Figure 11: Logging performance (disk: magnetic disk; ideal: disk with write cache enabled; 1f: 1 flash drive; 2f: 2 flash drives; 2f-1d: 2 flash drives and an archival disk). The same disk and ideal curves are included in all figures for ease of comparisons.
stripe unit size
Figure 13: TPCC performance with conventional array organization normalized to that of F lashLogging. (2f is used)
Third, almost all F lashLogging configurations achieve significant improvements over disk-based logging. Using one flash drive achieves significant improvements for flash-A and flash-B. Using two flash drives as an array leads to better performance for all three kinds of USB flash drives. The best performance is achieved with two flash drives and an archival disk. As shown in Figure 12, we see that F lashLogging with flash-A, flash-B, and flash-C achieves up to 5.7X, 5.7X, and 4.7X improvements over disk-based logging, respectively, thus obtaining up to 98.6% of the ideal performance.
we see that small stripe unit sizes (512B–8KiB) and large unit size (256KiB) both result in sub-optimal performance across all devices. As discussed in Section 3.3, this is because of request splitting and request skipping, respectively. The best performance of conventional scheme is achieved with 64KiB–128KiB stripe units. However, even in these cases, conventional scheme can incur significant performance loss compared to F lashLogging— up to 26.6% performance loss for flash-C and up to 9.8% loss for flash-A. This is because of remaining request splitting and skipping behaviors, e.g., due to log requests not aligned on stripe unit boundaries. In contrast, F lashLogging’s unconventional array design avoids request splitting and skipping, thereby achieving good performance without parameter tuning for the stripe unit sizes.
Array Organization. Figure 13 shows the performance of the conventional striping array organization that employs round robin addressing, normalized to that of F lashLogging (2f) for each device. We vary the stripe unit size from 512B to 256KiB. Note that less than 100% means that the conventional scheme suffers performance loss. From Figure 13,
Outlier Detection and Hiding. Figure 14 and Figure 15 study the effects of outlier detection and hiding. As
83
8KiB
4KiB
2KiB
request size
16KiB
request size
3.0 2.5 2.0 1.5 1.0 0.5 0.0
1KiB
bandwidth (MB/s)
0
8KiB
2 16KiB
request size
4
16KiB
8KiB
4KiB
0
2KiB
5
6
4KiB
10
8
2KiB
15
10
1KiB
bandwidth (MB/s)
no-hiding naive-hiding 2streams
1KiB
bandwidth (MB/s)
20
(a) flash-A 2f (b) flash-B 2f (c) flash-C 2f Figure 14: Potential study of outlier hiding with micro-benchmarks. (naive-hiding: outlier requests are re-issued to the main logging area. 2streams: outlier requests are re-issued to the separate outlier area.) 30000
we choose no hiding for flash-A and flash-B, and 2-streams hiding for flash-C.
NOTPM
25000 20000
Archival Disk. As shown in Figure 11, adding a nearzero-delay archival disk to 2f significantly improves logging performance. As described in Section 3.7, we flush log data to the disk as soon as un-archived log data in memory is more than 32KiB. Logging performance can be improved because an archival disk flush may cover pending requests while both flash drives are busy serving earlier requests. For example, the two flash drives are serving requests R1 and R2 when R3 arrives. It is possible that an archival flush including data up to R3 is initiated. Later, flash drive 1 may complete R1 and start serving R3 . If the time to serve R1 then R3 on the flash drive is longer than the time to serve the archival flush, the archival flush may return before flash drive 1 completes R3 , thus improving the logging performance for R3 . Such situations are possible mainly because (i) disk performance is competitive for writes of 32KiB or larger; (ii) a single write of large size can be faster than multiple writes of small sizes; and (iii) the flash drive may encounter an outlier. As a result, the archival disk approach is more effective for lower performing flash drives, as shown in Figure 11(b)–(d).
15000 10000 5000 0 1
2
4 8 16 32 64 number of clients 2f-no-hide 2f 2f-1d-no-hide 2f-1d
128
Figure 15: Effects of outlier detection and hiding on overall TPCC performance for flash-C. described in Section 3.4, the efficacy of the outlier hiding scheme depends on the latency difference between outliers and normal requests. Therefore, we first perform a set of micro-benchmarks in Figure 14 to understand the potentials of outlier hiding. Here, we build a stand-alone program on F lashLogging, where four threads repeatedly issue log requests of a given size via F lashLogging to logging devices. We report the aggregate logging bandwidth. As shown in Figure 14, we see that outlier hiding achieves up to 1.37X improvements with fixed sized requests for flashC, while it has almost no effect for flash-A and flash-B. Note that flash-C has the largest latency difference between outliers and normal writes (Figure 6). Therefore, it is reasonable to expect outlier hiding to have the most significant impact on flash-C. Moreover, from Figure 14(c), we see that the choice of where to re-issue outlier requests is important. Upon detection, naive hiding is hardly able to re-issue outlier requests, because of the invariant of non-decreasing LSNs, while 2streams hiding works well with the invariant. As a result, 2-streams hiding re-issues up to 18.6 times more outlier requests than naive hiding. Furthermore, Figure 15 shows the impact of outlier hiding on the overall TPCC performance for flash-C. Outlier hiding achieves up to 1.66X improvements over the no hiding cases. Given the above results, we believe that for addressing the large variance across USB flash drive types, a logging system should employ an adaptive scheme that detects the efficacy of outlier hiding, and dynamically enable/disable it, as described in Section 3.5.8 In our TPCC experiments,
5.3 Recovery Performance Recovery experiments are performed as follows. First, we carry out the same preparation steps as in a logging experiment. Second, we run 30-minute TPCC workloads with 32 clients. Third, we kill the MySQL server process. Finally, we restart the MySQL server and collect statistics for recovery processing. For each configuration, we report the results of five recovery experiments. Figure 16 shows the recovery scan performance of diskbased logging and F lashLogging. Figure 16(a) is a scatter plot, where each point represents a single recovery run. The X-axis is the log data size scanned during recovery. The Y-axis reports the elapsed time for the recovery scan. Figure 16(b) compares the average recovery scan bandwidth of all the configurations. The error bars show the standard deviation of the five runs of each scheme. From the figures, we can see the following points. First, all F lashLogging schemes achieve comparable or better recovery scan times compared to disk-based logging. Second, it is effective to scan multiple flash drives in parallel. Scanning two flash drives in parallel achieves 1.19–1.81X higher bandwidth than using a single flash drive.
8
self-contained algorithmic solution to a solution that requires all DBAs to use certain types of USB flash drives for avoiding large outliers.
It happens that flash-C has the largest latency difference between outliers and normal requests and it is also the lowest performing flash drive. In general, this may not be true. We prefer a
84
300
400
500
600
700
(a) Scatter plot of data scanned and elapsed times
10 5
disk
flash-A
flash-B
2f
1f
2f
1f
0 2f-1d
200
data scanned during recovery (MB)
15
2f-1d
100
20
2f-1d
0
25
2f
flashA-1f flashA-2f flashA-2f1d flashB-1f flashB-2f flashB-2f1d flashC-1f flashC-2f flashC-2f1d disk
1f
recovery scan bandwidth (MB/s)
elapsed time of data scan (s)
45 40 35 30 25 20 15 10 5 0
flash-C
(b) Scan bandwidth with standard deviations as error bars
Figure 16: Recovery scan performance of F lashLogging. (Every recovery experiment is repeated five times.) 35000 30000 25000 NOTPM
20000 15000 10000
flash-A flash-B flash-C ssd
10p
8p
4p
2p
1p
2f-1d
naïve
2f
2f-1d
2f
2f-1d
Figure 17 studies the performance of logging designs using a state-of-the-art SSD [16]. For comparison purpose, we include TPCC results for disk, ideal, and three USB drives from Figure 11. For the first configuration (“ssd naive”), we replace the logging disk with the SSD and run the original MySQL-InnoDB without changes. Unlike USB flash drives, this configuration immediately achieves 2.98X higher TPCC transaction rates over disk-based logging. This finding is consistent with previous work [20]. An explanation is that compared to the inexpensive USB flash drives, SSDs have more sophisticated controllers that handle overlapping writes well. Next, we exploit F lashLogging for further improving the logging performance of SSDs. The idea is to divide the SSD into K partitions and treat each partition as a (virtual) flash device for F lashLogging. We vary K from 1 to 10 because there are 10 internal parallel channels in the SSD [16]. From Figure 17, we indeed see significant improvements by using this technique: 1.33X better performance from 1p to 2p, and 1.12X better performance from 2p to 4p, thus achieving 4.12X better performance over disk-based logging. However, the improvements soon diminish. Since the SSD only supports standard SATA interface, it is difficult to figure out the internal flash page layout and the way that the parallel channels are used. Therefore, it is possible that writes to different partitions may actually compete for the same channel, limiting the gains. Finally, comparing configurations using USB flash drives and configurations using SSDs in Figure 17, we see that configurations with USB flash drives can achieve comparable or better performance than configurations using a single SSD while incurring much lower prices. Note that the SSD chosen in this study has been reported by third party to have better performance than several other types of SSDs [15]. Therefore, we believe our results are representative (at least for a subset of existing SSDs). In summary, F lashLogging with inexpensive USB flash drives provide a viable solution for efficiently supporting transactional logging.
2f
0
ideal
5000
5.4 Performance Comparison with Designs Using Solid State Drives
disk
Third, the archival disk can bring significant improvements when the disk bandwidth is much higher than the combined bandwidth in the flash array, which is the case of flash-A. On the other hand, two flash drives of flash-B or flash-C already achieve similar recovery scan bandwidth as the disk, leaving little room for improvements.
ssd+flashlogging
Figure 17: Comparing TPCC performance of F lashLogging using USB flash drives with designs using SSDs (32 clients).
6. CONCLUSION Synchronous logging is one of the most important techniques for achieving fault tolerance in computer systems. It is the central mechanism to ensure transaction durability in database systems. However, previous magnetic-disk-based solutions are ill-suited for the small sequential write patterns of synchronous logging, while existing alternative solutions are either complicated or expensive. In this paper, we study flash devices as a solution that is efficient, inexpensive, and simple. In particular, we identify USB flash drives as a good match for the task of synchronous logging because of its unique characteristics compared to other types of flash devices. We proposed F lashLogging, a logging solution that exploits multiple (USB) flash drives for good logging performance. We address four key challenges by proposing unconventional array organization, adaptively performing outlier detection and hiding, performing parallel device scans for efficient recovery processing, and combining a near-zero-delay archival disk in the design. Experimental results show that our solution achieves dramatically better performance over disk-based logging. Combining multiple USB flash drives also achieve comparable or better performance with much lower prices compared to designs employing a single SSD. While we focus on transaction processing as a case study for designing and evaluating F lashLogging, we believe that similar considerations are applicable to other computer systems that employ synchronous logging, such as synchronous file system journals and checkpointing/recovery systems for distributed web services.
85
[16] Intel X25-M and X18-M Mainsteam SATA Solid State Drives. http://download.intel.com/design/flash/nand /mainstream/mainstream-sata-ssd-product-brief.pdf. [17] D. Kline and N. Pilaka. An overview of transactional logging in db2 universal database. http://www.ibm.com/developer works/db2/library/techarticle/0301kline/0301kline.html. [18] I. Koltsidas and S. Viglas. Flashing up the storage layer. In VLDB, 2008. [19] S.-W. Lee and B. Moon. Design of flash-based dbms: an in-page logging approach. In SIGMOD, pages 55–66, 2007. [20] S.-W. Lee, B. Moon, C. Park, J.-M. Kim, and S.-W. Kim. A case for flash memory ssd in enterprise database applications. In SIGMOD, pages 1075–1086, 2008. [21] Y. Lin, B. Kemme, n.-M. Marta Pati and R. Jim´enez-Peris. Middleware based data replication providing snapshot isolation. In SIGMOD, pages 419–430, 2005. [22] Microsoft Corp. Sql server 7.0, sql server 2000, and sql server 2005 logging and data storage algorithms. http://support.microsoft.com/kb/230785. [23] S. L. Min and E. H. Nam. Current trends in flash memory technology: invited paper. In ASP-DAC, pages 332–333, 2006. [24] S. Nath and P. Gibbons. Online maintenance of very large random samples on flash storage. In VLDB, 2008. [25] S. Nath and A. Kansal. Flashdb: dynamic self-tuning database for nand flash. In IPSN, pages 410–419, 2007. [26] E. B. Nightingale, K. Veeraraghavan, P. M. Chen, and J. Flinn. Rethink the sync. In OSDI, 2006. [27] Oracle Corp. Oracle database administrator’s guide 10g release 1 (chapter 6. managing the redo log). Part Number B10739-01. [28] OSDL DBT2. http://sourceforge.net/projects/osdldbt. [29] V. Prabhakaran, T. L. Rodeheffer, and L. Zhou. Transactional flash. In OSDI, 2008. [30] K. Ross. Modeling the performance of algorithms on flash memory devices. In DaMoN Workshop, 2008. [31] Samsung Electronics. Onenand specification. http://www.samsung.com. [32] M. A. Shah, S. Harizopoulos, J. L. Wiener, and G. Graefe. Fast scans and joins using flash drives. In DaMoN Workshop, 2008. [33] M. Stonebraker, S. Madden, D. J. Abadi, S. Harizopoulos, N. Hachem, and P. Helland. The end of an architectural era (it’s time for a complete rewrite). In VLDB, pages 1150–1160, 2007. [34] Transaction Processing Performance Council. TPC-C benchmark. http://www.tpc.org/tpcc/. [35] V. Vasudevan, J. Franklin, D. Andersen, A. Phanishayee, L. Tan, M. Kaminsky, and I. Moraru. Fawndamentally power-efficient clusters. In HotOS, 2009. [36] R. Wang, B. Salzberg, and D. B. Lomet. Log-based recovery for middleware servers. In SIGMOD, pages 425–436, 2007.
Moreover, our experimental results show that we can apply F lashLogging to a single SSD by dividing it into multiple partitions and treating each partition as a virtual flash device. We believe that flash devices such as SSDs can be specialized for the access pattern of synchronous logging by taking into account the design considerations discussed in this paper.
ACKNOWLEDGMENTS We would like to thank Anastasia Ailamaki, Phil Gibbons, and Steve Schlosser for discussions on an early draft of the paper. We thank the anonymous reviewers for their helpful comments.
7.
REFERENCES
[1] T. Anderson, Y. Breitbart, H. F. Korth, and A. Wool. Replication, consistency, and practicality: are these mutually exclusive? In SIGMOD, pages 484–495, 1998. [2] R. S. Barga, S. Chen, and D. B. Lomet. Improving logging and recovery performance in phoenix/app. In ICDE, pages 486–497, 2004. [3] L. Bouganim, B. T. J´ onsson, and P. Bonnet. uFLIP: Understanding flash io patterns. In CIDR, 2009. [4] Y. Breitbart, R. Komondoor, R. Rastogi, S. Seshadri, and A. Silberschatz. Update propagation protocols for replicated databates. In SIGMOD, pages 97–108, 1999. [5] A. M. Caulfield, L. M. Grupp, and S. Swanson. Gordon: using flash memory to build fast, power-efficient clusters for data-intensive applications. In ASPLOS, pages 217–228, 2009. [6] Chris Mellor. Faster usb 3.0 is coming. http://www.pcworld.com/article/137551/. [7] K. Daudjee and K. Salem. Lazy database replication with snapshot isolation. In VLDB, pages 715–726, 2006. [8] E. N. Elnozahy, L. Alvisi, Y.-M. Wang, and D. B. Johnson. A survey of rollback-recovery protocols in message-passing systems. ACM Comput. Surv., 34(3):375–408, 2002. [9] E. Gal and S. Toledo. Algorithms and data structures for flash memories. ACM Comput. Surv., 37(2):138–163, 2005. [10] G. Graefe. The five-minute rule twenty years later. In DaMoN Workshop, 2007. [11] J. Gray, P. Helland, P. O’Neil, and D. Shasha. The dangers of replication and a solution. In SIGMOD, pages 173–182, 1996. [12] J. Gray and A. Reuter. Transaction Processing: Concepts and Techniques. Morgan Kaufmann, 1993. [13] S. Harizopoulos, D. J. Abadi, S. Madden, and M. Stonebraker. OLTP through the looking glass, and what we found there. In SIGMOD, pages 981–992, 2008. [14] J. L. Hennessy and D. A. Patterson. Computer Architecture, Fourth Edition: A Quantitative Approach. Morgan Kaufmann Publishers Inc., 2006. [15] Intel X25-M 80GB SATA Solid State Drive, Intel Ups The Ante. http://hothardware.com/Articles/Intel-X25M-80GBSATA-Solid-State-Drive-Intel-Ups-The-Ante/?page=2.
86