World Academy of Science, Engineering and Technology 53 2009
Flexible Sensor Array with Programmable Measurement System Jung-Chuan Chou, Wei-Chuan Chen, and Chien-Cheng Chen
on the same structure for excluding the package of transistor. Both ISFET and EGISFET can also be immobilized with particular enzyme-selective membrane to form the structure of enzyme field-effect transistor (ENFET), and to measure the series of the enzymes including the glucose, urea, and penicillin, etc. [7-10]. In this study, we prepared a structure of separative extended gate ion-sensitive field-effect transistor (SEGISFET) which consists of a sensing part and the commercial integration circuits (ICs). Besides, the programmable software, LabVIEW 7.1, was used to design an acquired and analyzed array measurement system. The analyzed method is about voltage versus time (V-T) measurement system for acquirement of response voltage of sensor array. Recently, LabVIEW is gradually used to program the virtual instrumentations and measurement system using the built-in library and modules, especially for mechanical, electronic and biomedical engineering [11,12]. The LabVIEW-based modules can be used to develop the control system as well as virtual biomedical instrumentations (VBI) [13] and to satisfy the integration and convenience of requirement on the signal acquisition and analysis of bioelectrochemistry. The sensitivity and linearity of sensor array are displayed by least squares fitting [14], which is effectively used to analyze and improve the characteristics of these WEs of sensor array for pH solution detection
Abstract—This study is concerned with pH solution detection using 2 × 4 flexible sensor array based on a plastic polyethylene terephthalate (PET) substrate that is coated a conductive layer and a ruthenium dioxide (RuO2) sensitive membrane with the technologies of screen-printing and RF sputtering. For data analysis, we also prepared a dynamic measurement system for acquiring the response voltage and analyzing the characteristics of the working electrodes (WEs), such as sensitivity and linearity. In this condition, an array measurement system was designed to acquire the original signal from sensor array, and it is based on the method of digital signal processing (DSP). The DSP modifies the unstable acquisition data to a direct current (DC) output using the technique of digital filter. Hence, this sensor array can obtain a satisfactory yield, 62.5%, through the design measurement and analysis system in our laboratory.
Keywords—Flexible sensor measurement, data analysis.
array,
PET,
RuO2,
dynamic
I. INTRODUCTION
T
HE solution/electrode interface (SEI) is referred to electron transfer; the prior principles and relationships of electrochemistry had been described in 19 century [1]. In 1970, a structure of ion-sensitive field-effect transistor (ISFET) was provided to an electrochemical sensor by Piet Bergveld [2], and this structure is formed via that the metal in gate electrode of metal-oxide-semiconductor filed-effect transistor (MOSFET) was removed. Interestingly, the principle of MOSFET was still worked when the transistor was immersed in pH solution reacting with a silicon oxide layer. Afterword, many studies were discussed to coat a sensing membrane for increasing the sensitivity, such as PVC, Si2N4, and SnO2, for organic acid detection [3–5]. The structure of extended gate ion-sensitive field-effect transistor (EGISFET) was improved from ISFET and efficiently applied to detect carboxylic acids and other ions
II. EXPERIMENT A. Measurement System In this study, we prepared a real-time and programmable V-T array measurement system to research the structure designs and analyses of the 2 × 4 array devices. The array system is consisted of frond-ended and back-ended devices. The frond-end represents the array-designed WEs based on a flexible PET substrate; the back-end contains a readout circuit, a data acquisition (DAQ) hardware, and an analysis unit using LabVIEW in personal computer. The measurement system is shown as Fig. 1.
such as H+, F-, Cl- and Ag [6]. The major advantage of this structure is that the sensing part is extended from the transistor J. C. Chou is with the Graduate School of Electronic Engineering, National Yunlin University of Science and Technology, Douliou, Taiwan 64002, R.O.C. (corresponding author to provide phone: 886-5-5342601 #2101; fax: 886-5-5321719; e-mail:
[email protected]). W. C. Chen is with Graduate School of Optoelectronics, National Yunlin University of Science and Technology, Douliou, Taiwan 64002, R.O.C. (e-mail:
[email protected]). C. C. Chen is with the Graduate School of Engineering Science and Technology, National Yunlin University of Science and Technology, Douliou, Taiwan 64002, R.O.C. (e-mail:
[email protected]).
340
World Academy of Science, Engineering and Technology 53 2009
Fig. 1 Structure of array measurement system
B. Electrode Device In this study, we prepared 2 × 4 sensor array by using a screen-printed method under the same parameters (e.g. environment, time, usage of reagents). This sensor array is shown as Fig. 2, indicating that the each sheet contains a series of three multi-sensors; a T-shape of silver ink was firstly
Fig. 3 Fabrication process of screen-printing 2x4 sensor arrays
C. Readout Circuit According to electrochemistry theory, it is well-known that the fast response of potentiometric sensor is occurred by the bond effect in SEI, and it is unstable. Another response, slow response, immediately presents and provides a steady response voltage which closes to the base-line. The base-line is a normal level to decide specific concentration of solution. The readout circuit applied to impedance matching was mainly integrated using eight instrumental amplifiers (IAs). And the gains of IAs were set to 1 for original acquisition. The power supply of the
deposited and baked in 120 ℃ over for 20 minutes, and then the first insulating epoxy-ink was printed over the T-shape silver layer and baked in 140 ℃ over for 40 minutes. Furthermore, eight ruthenium dioxide (RuO2) thin films were deposited on insulating epoxy layer by radio frequency (RF) sputtering system. And eight strips of silver ink were formed and connected with eight RuO2 thin films on to the first insulating epoxy layer and baked in 120 ℃ over for 20 minutes. Finally, the second insulating epoxy-ink of the sensor was deposited,
whole system is ±5 V.
and then the sensors were baked in 140 ℃ over for 40 minutes. The fabrication process is shown in Fig. 3.
D. DAQ Device For digital signal processing (DSP), conversion of the analog signal to digital signal can be carried out by the analog-to-digital converter (ADC) IC, digital signal processors (DSPs), DAQ Device, etc. Digital signal can effectively reduce the distortion when signal is transmitted, because the transmissible state only has two levels, the high “1” and low “0”. In this study, we used a DAQ board, NI-PCI-6010, whose parameters were set as follows: rate was 30 KHz, samples to read was 30 KS, input port was AI0 ~ AI7, and output port was AO0 ~ AO7. The expected analog signal was between +1000 mV and -1000 mV from IA IC output, and that would be converted into a 16-Bit digital signal. E. LabVIEW The structure was mainly developed by flat sequence forming a data flow from left to right. In this structure, however, the data array was first inputted in the program from DAQ device, and then, the data array was passed through a digital filter. For DC output, LabVIEW provides an object, AC & DC Estimator, to modify the input data array and to obtain a DC value, using Hanning Window. Finally, the set of DC values would be saved in computer and analyzed for deriving the sensitivity and linearity of the WEs on the same substrate. The block chart of program was designed as Fig. 4. The parameter
Fig. 2 Diagram of screen-printing 2 x 4 sensor array
341
World Academy of Science, Engineering and Technology 53 2009
setting comprises the selections of devices and acquisition parameters. Moreover, the program supports common file format (*.xls) for MS Office Excel and a graph (*.png) to review the outcome of measured curve. The front panel of array measurement system is shown as Fig. 5.
n
x=
∑a i =1
i
(2-a)
n n
y=
∑b
i
i =1
(2-b)
n
Additionally, the Regression (explained) sum of square (ESS) is the sum of the squares of the differences of the predicted values and the grand, where SSx , SSy and SSxy , are built by the obtained ai and bi as follows: n
(
)
(3-a)
(
)
(3-b)
SSx = ∑ ai − x
2
i =1 n
SSy = ∑ bi − y i =1
n
[(
2
) (
SSxy = ∑ ai − x × bi − y i =1
)]
(3-c)
Therefore, we can find the coefficient b that is the slope of approximation line, and is also the sensitivity of sensor shown as follows:
sensitivity = b = Fig. 4 Block chart of array measurement system
SSxy SSx
(4)
The linearity of measurement curve can be expressed by the coefficient of correlation that is built by the square root of the correlation of determination. The simplified result of linearity is shown as follows:
linearity =
SSx 2 b SSy
(5)
III. RESULTS AND DISCUSSION The analytic modules of semi-auto array-measured system combine the results of algorithms and functions that were referred above. The fabrication of 2 × 4 sensor array was effectively used to produce the high efficiency pH-sensing WEs for pH detection. The feasibility of mass production can be achieved through these techniques of screen-printing and RF sputtering. This V-T array measurement system can provide a real-time and dynamic scan-responsive curve, as well as, present perfect results for pH detection with the sensor array based on the same PET substrate. The dynamic curve output was shown in Fig. 6, and the access file in outcome was shown as Table I.
Fig. 5 Front panel of array measurement system on LabVIEW
According to least squares fitting theory, the values of solution concentrations and output voltages were expressed as (a i ,bi ) , respectively, where i is the sequence of pH values from 0 to n-1. The linear regression equation was prepared as formula (1) to calculate the coefficients, a and b .
Y = a + bX And the average values, x and
(1)
y , were expressed by the
sets of ai and bi as follows:
342
World Academy of Science, Engineering and Technology 53 2009
Fig. 6 Scan-responsive curves at pH 9 TABLE I ACCESS FILE FOR MS OFFICE EXCEL (AT PH 9)
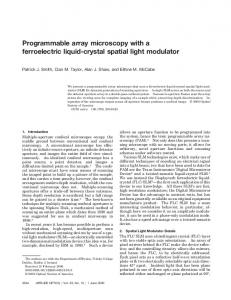
Fig. 7 Sensitivity and linearity of sample 8
For high sensitivity (> 50 mV/pH) and linearity (> 0.999), this sensor array is certainly effective for pH solution detection, and the yield is satisfactory to 62.5% in our laboratory. IV. CONCLUSION This study is about the feasibility of sensor array including sensor fabrication and measurement system. The WEs of sensor array were based on the PET substrate with screen-printing technology. And a RuO2 sensing membrane was deposited with RF sputtering technology. Under these conditions, we can use an array measurement system based on LabVIEW 7.1 to acquire the signal from readout circuit and to complete the numerical analysis by DSP with specific functions or algorithms. A satisfactory yield of the measurement result based on high sensitivity and linearity can be obtained. Therefore, the integration of this sensor system can be developed as a high efficiency measured and analyzed system.
According to Nernst response, the sensor array has excellent sensitivity and linearity. The result, shown as Fig. 7, was achieved with a homemade module. Finally, the sensor array can be represented eight analysis results after one-process measurement. The results were shown in Table II.
ACKNOWLEDGMENT This study is supported by National Science Council, The Republic of China, under the contracts NSC 96-2628-E-224-008-MY3 and NSC 97-2221-E-224-058-MY3.
TABLE II SENSITIVITY AND LINEARITY OF EACH WORKING ELECTRODE Sample Sensitivity (mV/pH) Linearity 1
41.529
0.9883
2
34.132
0.9746
3
43.800
0.9960
4
51.334
0.9994
5
53.077
0.9998
6
55.291
0.99995
7
55.854
0.99995
8
56.437
0.9999
REFERENCES [1] [2]
[3]
[4]
343
M. Ciobanu, “Handbook of electrochemistry,” 1st ed. C. G. Zoski, Ed., Amsterdam: Elsevier, 2006, pp. 3-10. P. Bergveld, “Development of an ion-sensitive solid-state device for neurophysiological measurements,” IEEE Transactions on Bio-Medical Engineering, vol. BME-17, pp. 70-71, Jan. 1970. I. Poels, R. B. M. Schasfoot, S. Picioreanu, J. Frank, and G. W. K. Van Dedem, “An ISFET-based anion sensor for the potentiometric detection of organic acid in liquid chromatography,” Sensors and Actuators B, vol. 67, pp. 294-299, Sep. 2000. D. L. Harame, L. J. Bousse, J. D. Shott, and J. D. Meindl, “Ion-sensing devices with silicon nitride and borosilicate glass insulators,” IEEE Transactions on Electron Devices, vol. ED-34, pp. 1700-1707, Aug. 1987.
World Academy of Science, Engineering and Technology 53 2009
[5]
[6]
[7]
[8]
[9]
[10]
[11]
[12]
[13] [14]
C. L. Wu, J. C. Chou, W. Y Chung, T. P. Sun, and S. K. Hsiung, “Study on SnO2/Al/SiO2/Si ISFET with a metal light shield,” Materials Chemistry and Physics, vol. 63, pp. 153-156, Feb. 1999. J. Van der Spiegel, I. Lauks, P. Chan, and D. Babic, “The extended gate chemical sensitive field effect transistor as multi-species microprobe,” Sensors and Actuators B, vol. 4, pp.291-298, 1983. X. L. Luo, J. J. Xu, W. Zhao, and H. Y. Chen, “Glucose biosensor based on ENFET doped with SiO2 nanoparticles,” Sensors and Actuators B, vol. 97, pp. 249-255, Feb. 2004. S. Yabuki, F. Mizutani, “Modifications to a carbon paste glucose-sensing enzyme electrode and a reduction in the electrode and a reduction in the electrochemical interference from L-ascorbate,” Biosensors and Bioelectronics, vol. 10, pp. 353-358, spring 1995. A. Zhang, Y. Hou, N. Jaffrezic-Renault, J. Wan, A. Soldatkin, and J. M. Chovelond, “Mixed urease/amphiphile LB films and their application for biosensor development,” Bioelectrochemistry, vol. 56, pp. 157-158, May 2002. A. Poghossian, M. J. Schöning, P. Schroth, A. Simonis, and H. Lüt h, “An ISFET-based penicillin sensor with high sensitivity, low detection limit and long lifetime ,” Sensors and Actuators B, vol. 76, pp. 519-526, June 2001. J. Hakala, V.-V. Elomaa, T. Eronen, U. Hager, A. Jokinen, and J. Äystö, “The JYFLTRAP control and measurement system,” Nuclear Instruments and Methods in Physics Research Section B, vol. 266, pp. 4628-4631, Oct. 2008. J. H. Cho, Y. W. Kim, K. J. Na, and G. J. Jeon, “Wireless electronic nose system for real-time quantitative analysis of gas mixtures using micro-gas sensor array and neuro-fuzzy network,” Sensors and Actuators B, vol. 134, pp. 104-111, Aug. 2008. The NI website. [Online]. Available: http://www.ni.com/. M. Benson, “Parameter fitting in dynamic models,” Ecological Modelling, vol. 6, pp. 97-115, 1979.
Jung-Chuan Chou was born in Tainan, Taiwan, Republic of China, on July 13, 1954. He received the B.S. degree in physics from Kaohisung Normal College, Kaohsiung, Taiwan, in 1976; the M.S. degree in applied physics from Chung Yuan Christian University, Chung-Li, Taiwan, in 1979; and the Ph.D degree in electronics from National Chiao Tung University, Hsinchu, Taiwan, in 1988. He taught at Chung Yuan Christian University from 1979 to 1991. Since 1991 he has worked as an associate professor in the Department of Electronic Engineering at the National Yunlin University of Science and Technology. From 1997 to 2002 he was Dean, office of Technology Cooperation at the National Yunlin University of Science and Technology. And since 2002, he has been Secretary-General at the National Yunlin University of Science and Technology. His research interests are in the areas of amorphous materials and devices, electrographic photoreceptor materials and devices, electronic materials and devices, sensor devices, and science education. Wei-Chuan Chen was born in Pingtung, Taiwan, Republic of China, on October 5, 1983. He received the B.S. degree in the Department of Electronic Engineering at National Kaohsiung University of Applied Sciences, Kaohsiung, Taiwan, in 2006. At the present, he is working toward the Master's degree in the Graduate School of Optoelectronics at the National Yunlin University of Science and Technology. His research interests are semiconductor devices, chemical sensors and their applications. Chien-Cheng Chen was born in Taichung, Taiwan, Republic of China, on August 20, 1984. He received the B.S. degree in the Department of Electronic Engineering at the National Yunlin University of Science and Technology, Yunlin, Taiwan, in 2006. In 2008, he has received the Master's degree in the Graduate School of Optoelectronics at the National Yunlin University of Science and Technology. At the present, he is working toward the Ph. D degree in the Graduate School of Engineering Science and Technology at the National Yunlin University of Science and Technology. His research interests are semiconductor devices, chemical sensors and their applications.
344