P-40: Flicker-Free Restricted-Pattern Addressing Techniques with Low ... Addressing techniques for displaying restricted pat- .... shift in time domain. This is also ...
P-40 / Ruckmongathan
P-40: Flicker-Free Restricted-Pattern Addressing Techniques with Low Supply Voltage T. N. Ruckmongathan Raman Research Institute, Bangalore, India
Abstract
background pixels [6]. This technique is referred to as Restricted Pattern addressing Technique— Positive Contrast(RPAT-PC). Advantages of RPAT-NC and RPAT-PC are: — Good contrast ratio can be achieved even with large matrix of TN-LCD since the selection ratio of RPATs is independent of the matrix size and higher than the conventional technique. — Standard row and column drivers can be used since the addressing technique is simple and similar to the conventional addressing technique.
Addressing techniques for displaying restricted patterns in RMS responding matrix LCDs are proposed. Their salient features are high selection ratios and low supply voltages that are independent of the matrix size. High resolution displays in oscilloscopes and Logic Analyzers can be driven without flicker.
Introduction Alt & Pleshko have shown that the maximum selection ratio (ratio of RMS voltage across the ON pixels q to the RMS voltage across the OFF pixels) is
p p N + 1)=( N , 1), wherein N is the number
(
of address lines that are multiplexed [1]. A higher selection ratio can be achieved when restricted patterns are displayed [2,3]. Correlation properties of pseudo random binary sequence(PRBS) waveforms were exploited to achieve infinite selection ratio when a single waveform is displayed in a matrix LCD [4]. An addressing technique for displaying multiple waveforms in matrix LCDs was proposed [5] by the author in the year 1986. Selection ratio of this technique is independent of matrix size and just depends on the number of waveforms w ( also equal to the number of selected pixels in each column) being displayed. Here, selected pixels (points on the displayed waveforms) get a lower RMS voltage as compared to the background. Hence this technique is referred to as Restricted Pattern Addressing Technique— Negative Contrast (RPAT-NC). It is also possible to get higher voltage across the selected pixels as compared to the
ISBN 1-887595-50-3-$1.00+.00 c 1997 SID
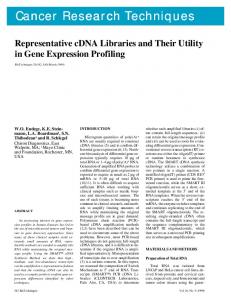
Figure 1: Typical waveforms of RPAT-NC Figure 1 gives the typical waveforms for RPAT-NC for N=7. Voltage across any pixel in a display addressed with RPATs is zero during most of the time intervals in a period as illustrated in figure 1. This will result in flicker if N is very large. In addition to this problem, the amplitude of the row select pulse increases with N, the number of rows being multiplexed. This will lead to frame response phenomenon in fast responding LCDs. New addressing techniques are proposed to over come this problem 1
SID 96 DIGEST
P-40 / Ruckmongathan erated based on the following equation
in this paper.
C (t) =
N X i=1
di � Oi(t)
(1)
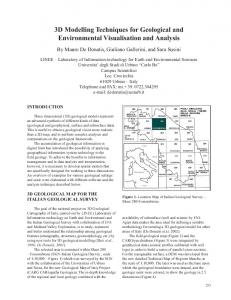
wherein di is the data in the i-th row of the given column and Oi(t) is the orthogonal waveform applied to Oscilloscopes, Logic Analyzers and Electro-Cardio- the i-th row of the matrix LCD. Principle explained Graph (ECG) displays mostly display single valued here is general and can be used with any set of orfunctions of time. If w waveforms are displayed thogonal functions. in these displays, then only w pixels in a column carry information while rest of the (N-w) pixels are Techniques background pixels. This restriction in the displayed patterns is exploited to improve the display perfor- The N rows in a matrix display are driven with waveforms corresponding to a set of orthogonal mance for applications mentioned above. functions. Hardware complexity of the drive electronics varies considerably on the choice of the Driving matrix LCDs is similar to multiplexing in orthogonal functions. Simple orthogonal functions connnunication [7,8]. Waveforms applied to the N derived from Hadamard matrices, pseudo random row electrodes of a matrix LCD are orthogonal to binary sequences or walsh functions are preferred. each other. Column waveforms depend on the data These orthogonal functions take a value of +1 or to be displayed in a column since information is -1 only. Here the generation of row waveforms is multiplexed through the column electrodes. Column simpler as compared to other orthogonal functions waveforms are generated by taking orthogonal derived from a set of sine or cosine functions or transform of the data to be displayed. The data to be slant matrices. Multiplication in equation (1) is also displayed is assigned a value +1 for OFF pixels and avoided with these orthogonal functions. Hence -1 for ON pixels, when the pattern to be displayed is generation of column waveforms is simple. Number general (without any restrictions on the pattern). of voltage levels in the column waveforms is also less when data to be displayed is assigned -1 or +1 New addressing techniques for displaying restricted (for ON and OFF pixels respectively). patterns are based on assigning a value 0 to the background pixels. This is similar to assigning the non- The pseudo random binary sequence(PRBS) used select voltage of the row waveform to be the column by Shanks and Holland [4] (for addressing Nonvoltage for the background pixels in RPAT-NC and multiplexed oscilloscope displays) is a good choice RPAT-PC. Assigning 0 to be the data (di ) for back- for row waveforms for the following reasons. The ground pixels results in selection ratios that are inde- number of transitions (from +1 to -1 or from -1 to pendent of the matrix size. There is still some flex- +1) in the waveform is a constant for the PRBS and ibility in assigning a value for the w pixels, which its shifted versions are the same. Waveforms applied are points on the waveforms being displayed on the to the matrix LCDs get distorted due to the resisoscilloscope. These selected pixels can be assigned tance of the indium tin oxide and capacitance of the either +1 or -1. Assigning +1 to the w pixels re- pixels. Error in the RMS voltage across the pixels sults in negative contrast with background pixels get- due distortion in the waveform is same for all the ting a higher voltage compared to the selected pixels. pixels if the number of transitions in the addressing Background pixels get a lower voltage across them waveforms are equal. Hence brightness uniformity as compared to selected pixels when the data (di ) for of pixels will be better if PRBS waveforms are used. the selected pixels is -1. Column waveforms are gen- Figure 2 gives the PRBS of length 7 and its shifted
Principle
2
SID 96 DIGEST
P-40 / Ruckmongathan 2L . Any N waveforms (N � (2L ,1)) out of the (2L 1) waveforms can be used for driving the N rows of a matrix LCD. Let O1(t); O2(t); O3(t)); :::; ON (t) be the N orthogonal waveforms applied to rows of a Matrix LCD. Hence
Z
T
Oi(t)Oj (t)dt =
(
1 0
8i = j 8i 6= j
(2)
Amplitude of these waveforms is either Vr or -Vr corresponding to +1 or -1 in the orthogonal function. Let w be the number of pixels in each column that are driven to a selected state Then (N-w) pixels in each column are the background pixels. Let i,k,...,s be the rows in a column wherein the pixels are selected, while rest of the pixels in that column are background pixels. The column waveform is chosen to be proportional to the sum of the orthogonal functions applied to the i,k,...,s rows of the matrix display. Hence the column waveform is
Figure 2: (a) Matrix of PRBS and its shifted versions and (b) Corresponding waveforms. versions. Frequency spectrum of these waveforms are also same since they are identical except for the shift in time domain. This is also an useful property since brightness non- uniformity of pixels due to variations of threshold voltage and electro-optic characteristics with frequency is minimised by using PRBS sequences.
Oc(t) = Oi(t) + Ok + � � � + Os(t)
(3)
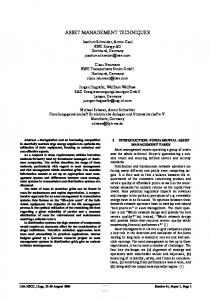
PRBS sequences are not orthogonal. Hence they are not suitable for multiplexing . However these when di = +1. This technique will be referred to as sequences can be converted to orthogonal form by PRBS-NC. Column waveforms is as given below adding a column of +1 to the matrix in figure 2 as Oc(t) = ,(Oi(t) + Ok + � � � + Os(t)) (4) shown in figure 3. when di = -1, this will result in selected pixels getting a higher RMS voltage as compared to the background pixels. Hence this technique will be referred to as PRBS-PC. Typical addressing waveforms for PRBS-NC are shown in Figure 4. The row waveforms are identical for both PRBS-NC and PRBS-PC. Polarity of the column voltages is reversed in the case of PRBS-PC as compared to PRBS-NC (Figure 5). Column waveforms have (w + 1) voltage levels and suitable (8 or 16 level) column drivers are readily available.
Figure 3: (a) Orthogonal matix based on PRBS and (b) Corresponding waveforms. Length of the PRBS is (2L -1) wherein L is an integer indicating the number of stages (flip-flops) necessary in the shift register circuit used for generating these sequences. Number of transitions in a waveform shown in Figure 3 is either 2(L,1) or (2(L,1) +2). This difference is not much for very long sequences and in any case less than that of Walsh functions, wherein the number of transitions ranges from 0 to
Analysis Voltage across pixel is the difference between row and column waveform. RMS voltage across the pixels is given in equation (5)
s Z Vpixel(RMS ) = T1 (Oj (t) , Oc(t))2dt T
3
(5)
SID 96 DIGEST
P-40 / Ruckmongathan dent of the matrix size. Neq [5] gives the number of lines that are to be multiplexed using the Alt & Pleshko technique to achieve the same selection ratio (equation 6 or 7) as the present technique. Neq for PRBS-NC and PRBS-PC are
and
p Neq(PRBS , NC ) = (2 w , 1)2
(8)
p Neq(PRBS , PC ) = (2 w + 1)2
(9)
Supply voltage for the drive electronics is given by the maximum swing in the addressing waveforms and is given by the following equation
VSupply (PRBS , NC ) =
Figure 4: Typical waveforms of PRBS-NC.
q
w VSaturation
(2 )
(10)
Supply voltage for PRBS-NC is independent of matrix size and just depends on w, the number of selected pixels in a column. Supply voltage of RPATNC is given below for comparison,
q VSupply(RPAT , NC ) = (N=2)VSaturation
(11)
Hence the reduction in supply voltage is given by
, NC ) = 2r w R = VVSupply ((PRBS RPAT , NC ) N Supply
(12)
Similarly the comparison of supply voltages for PRBS-PC to that of RPAT-PC is given below
! VSupply (PRBS , PC ) = 2rw ppw VSupply (RPAT , PC ) N w +1
Figure 5: Typical waveforms of PRBS-PC
p
Selection ratio is optimum when Vr = w Optimum Selection ratio for PRBS-NC is
s p SR = pw w, 1 8 di = 1
(13)
Results
Neq for PRBS-NC and PRBS-PC as functions of w are shown in Figure 6. Neq is 9 and 25 for PRBS-NC
(6)
and PRBS-PC respectively, when four waveforms (w=4) are displayed. Hence TN-LCDs with faster This is same as that obtained for RPAT-NC [5]. response times as compared to the STN-LCDs can Maximum selection ratio for PRBS-PC is sp be used in displays for Oscilloscopes. w +1 SR = pw 8 di = ,1 (7) Figure 7 gives the plot of equation (12) as a function of N for several values of w. Supply voltage for which is same as that of RPAT-PC [6]. Thus the se- PRBS-NC is just 25% of that required for RPAT-NC, lection ratios for both these techniques are indepen- when N is 256 and w=4. Hence 75% reduction in 4
SID 96 DIGEST
P-40 / Ruckmongathan References: [1] Alt P.M, Pleshko P, IEEE trans. Electron Devices, Vol. ED-21, pp 146–155, 1974 [2] Nehring J, Kmetz A.R, IEEE trans. Electron Devices, Vol.ED-26, pp 795–802, 1979. [3] Clark M.G, Shanks I.A, Patterson N.J, SID 79 Digest, pp 110–111, 1979. [4] Shanks I.A, Holland P.A, SID 79 Digest pp 112– 113, 1979. [5] Ruckmongathan T.N, SID 86 Digest, pp 128– 131, 1986. [6] Ruckmongathan T.N, Thesis submitted to ECE, Indian Institute of Science, Bangalore, India, 1988. [7] Ruckmongathan T.N, pp 302–306, Proceedings of the Conf. on Emerging Optoelectronic Technologies (CEOT-94), IISc, Bangalore, 1994. [8] Ruckmongathan T.N, Reports of the Research Laboratory, Asahi Glass Co., Ltd, Vol.43, No.1, pp 65–87, 1993.
Figure 7: Supply voltage comparison R vs N supply voltage is possible when PRBS-NC is used. Reduction in supply voltage is even more for higher values of N. It is important to note that psupply voltage decreases with w and is equal to 2Vsaturation as in the case of non-multiplexed oscilloscope display in reference [4].
Conclusion PRBS-NC & PC can be used for displaying restricted patterns with TN-LCDs (with faster response times as compared to STN-LCDs), since selection ratio of these techniques are high. Limited alphanumeric information can also be displayed by using dummy rows as discussed in reference [5]. Frame response and flicker are suppressed due to high address duty factor(unity) of PRBS-NC & PC . Low supply voltage which is independent of matrix size is an additional advantage of these techniques especially in portable devices. 5
SID 96 DIGEST