Proceedings of the Seventh International Conference on Information Quality (ICIQ-02)
Formulation of A Decision Support Model Using Quality Attributes (Research In-Process)
Michael S Gendron Central Connecticut State University
[email protected]
Marianne J. D’Onofrio Central Connecticut State University
[email protected] Abstract: Today’s managers are required to make decisions in a techno-complex rapid decision-making environment. This environment is data and information based which requires that managers have tools based on data and information quality (DIQ) to supplement their decision-making activities. The researchers propose a decision support paradigm based on Multi-Attribute Utility Theory (MAUT) that employs a DIQ model to represent attributes. Representing attributes by using an MAUT implementation with a DIQ model facilitates the collection of importance weightings and expected utility for DIQ driven decisions. The basis of the proposed DSS framework, the Q Function, provides a Q Value that represents the multi-attribute utility of decision choices weighted by relative importance. Keywords: Data-and-Information-Quality, Decision-Making, Multi-Attribute-Utility-Theory
INTRODUCTION Managers are required to collect data and information and to make decisions of increasing complexity in today’s technology-laden firm. Today’s emphasis on decisions based on quality information requires that managers are aware of the quality of inputs to their decision processes. The complexity of those data and information inputs, and the resultant decisions have increased because of the number of choices made possible through technology as well as the pace at which decisions must be made. In order to support this increased need for techno-complex rapid decision-making, managers need tools. This paper proposes a model that combines data and information quality attributes with multi-attribute utility theory (MAUT) for improved decision making. The model is based on principles of decision analysis and is currently being used to pilot a web-based decision support system designed to enhance managerial decisions. Automatic methods are often used to assist decision-making. Those methods eliminate or reduce the direct influence of the expert. In other words, either the expert is completely removed from the process or the functions are fine-tuned based on an initial input from an expert. There are many examples of systems that store knowledge from experts and then allow non-experts to make better decisions within a specific domain. Those systems can be found in almost every situation where decisions are made. Some examples include: •
ABSolute: An Intelligent Decision Making Framework for E-Sourcing. - The procurement process for large organizations is complex. When a request for quotation is sent out, it often results in a large number of bids. ABSolute aids managers in the efficient selection of bids and products within the procurement process. It includes a visual interface, coupled with an MAUT engine, and a specially designed weighting methodology to facilitate bid scoring and selection. [1] 305
Proceedings of the Seventh International Conference on Information Quality (ICIQ-02)
•
Laser eye surgery decision aid – Individuals thinking about laser eye surgery (Lasik) must consider a list of attributes before deciding if the surgery is right for them. Those attributes include quality of vision, cost, risk, comfort, attractiveness, hassle associated with the surgery, day-to-day inconvenience and anxiety of procedure. This decision aid offers prospective patients with a multi-attribute tool to assist them in deciding between Lasik, glasses, and contacts. [2]
The DIQ model proposed in this paper relies on MAUT, which is the most widely used form of decision analysis support [1]. The model relies on experts’ assessment of the real utility value of different attributes for a particular choice (expected utility assessments). These expected utility assessments could be summed to give an overall expected utility for a given choice. However, when those expected utility assessments are combined with managerial importance weightings, we get an overall weighted utility function which allows for discrimination between choices weighted by managerial preference. Like other frameworks that use MAUT the proposed model is meant to aid managerial decision making. The proposed framework is specifically geared to the question: When presented with a list of data and information driven alternatives, which is the best choice when considering DIQ?
DATA AND INFORMATION QUALITY Data and information quality (DIQ) can be best defined as fitness for use, which implies that the concept is relative. Thus, data or information with quality considered appropriate for one use may not possess sufficient quality for another use [3]. This relative nature of DIQ means that there is a subjective component to it. MAUT was selected to operationalize the DIQ model since MAUT calculations take into account the relative nature of attributes that effect decision-making. DIQ for improved decision making can be viewed from several aspects [4], including a data lifecycle approach [5], a value chain approach [6], an electronic data processing (EDP) audit approach [7], a data manufacturing approach [4], and an approach based on database integrity [8, 9]. The data manufacturing approach is used by the researchers in the proposed framework for studying DIQ for improved decision-making. This approach is used since data tends to be created at the lower levels of an organization but organized into information and used by managers at higher levels. It is necessary that the information used in decision-making be of the appropriate quality since poor quality can have an impact on organizational effectiveness and strategy. The DIQ framework employed in our model includes 4 categories for classifying 15 data quality attributes [10] (Table 1 - DIQ Framework). This framework was chosen since it seems to capture a generic set of attributes that gives a reasonable description of DIQ from the manager’s perspective. The framework is generic in the sense that it is not industry specific.
DECISION ANALYSIS AND MULTI-ATTRIBUTE UTILITY THEORY A foundational premise of decision analysis is to divide complex decisions into individual attributes that are easier to comprehend, and to then recombine them in some logical fashion. A clear distinction is also made between the alternatives (choices) which best allows the decision maker to reach their goal, the characteristics of the alternatives (attributes), the importance of the attributes to the goal, and the desirability of the attributes (utility). One of the most readily understandable forms of decision analysis is MAUT [11]. In part, this ease of use and acceptance of MAUT motivated our selection of this method. Our model employs MAUT and uses DIQ dimensions [10] as attributes. It places decision-making in a DIQ context by eliciting importance DIQ attribute ratings from managers faced with a complex decision and utility values from experts familiar with the decision domain. MAUT has the benefit of being easy to understand and implement, and it provides a good framework for making complex decisions, but it inherently has some drawbacks. The relative importance weight of attributes, the interaction between them, and the individual attitudes toward risk are inherently subjective. Reasonable people can disagree on these issues. Methods are being explored to attenuate the effect of this subjectivity. 306
Proceedings of the Seventh International Conference on Information Quality (ICIQ-02)
MAUT uses two inputs to compute relative utility for a set of choices: 1) attribute importance (preference) weights, and 2) attribute expected utility. Relative utility allows choices to be ranked in order of importance (preference). In the proposed implementation of MAUT using the DIQ framework, importance weights are obtained from managers who will be consumers of the information resulting from the selected choice, and expected utility weights are obtained from experts that specialize in the domains represented by the choices (Figure 1 - The Data and Information Driven Choice MAUT Paradigm). Category
Attribute Believability (AY)
Intrinsic DIQ (MZ)
Accuracy (AY) Objectivity (AY) Reputation (AY) Value-added (AY)
Contextual DIQ (MZ)
Relevancy (AY) Timeliness (AY) Completeness (AY) Appropriate amount of data (AY) Interpretability (AY) Ease of Understanding (AY)
Representational DIQ (Mz)
Accessibility DIQ (Mz)
Definition Believable Data are certified error-free, accurate, correct, flawless, reliable, errors can be easily identified, the integrity of the data, precise Unbiased, objective The reputation of the data source, the reputation of the data Data give you competitive advantage, data add value to your operations Applicable, relevant, interesting, usable Age of data The breadth, depth and scope of information contained in the data The amount of data is appropriate to the task at hand Interpretable Easily understood, clear, readable
Data are continuously represented in the same format, consistently represented, consistently formatted, data are compatible with previous data Well-presented, concise, compactly represented, wellConcise organized, aesthetically pleasing, form of Representation (AY) presentation, well formatted, format of the data Access Accessible, retrievable, speed of access, available, upto-date Convenience (AY) Data cannot be accessed by competitors, data are of a Access Security (AY) proprietary nature, access to data can be restricted, secure Table 1 - DIQ Framework Representational Consistency (AY)
Adapted from Wang and Strong [10] (Mz) = Main Category of DIQ; (AY) = Attribute of DIQ Managers rate 15 DIQ attributes as they relate to the decision to be made (not to the individual choices). Decision Choices: Managers (Average Importance (I) of Each Attribute to the Task need to make a data or IAy) information driven decision and Experts estimate the expected utility of each DIQ attribute have a number of choices (DX) choice pair. (Expected Utility (U) for Each Attribute (AY) for Each Choice (DX) - UDxAy) Figure 1 - The Data and Information Driven Choice MAUT Paradigm
307
Proceedings of the Seventh International Conference on Information Quality (ICIQ-02)
A premise in MAUT is that various stakeholders potentially desire to consider different attributes for any given set of choices, or the same attribute but they have different levels of importance. Attributes within the DIQ framework provide a set for decisions where DIQ is of paramount importance. The generic set of DIQ attributes solves the problem of differing objectives from different stakeholders, and allows the researchers to be concerned with the differing levels of importance given to those attributes. The method outlined below allows managers to individually rate the DIQ attributes so researchers can understand the importance of the 15 DIQ attributes relative to the decision to be made. An additional discriminatory factor among choices is expert’s assessment of the expected utility of each choice. It is necessary that data about the expected utility of each decision-choice pair be obtained from knowledgeable experts in the particular domain. A benefit of the model being proposed (and a major benefit of MAUT) is that relative importance weightings are used in the calculations to express managerial preference of attributes. Thus, individuals with strong preferences are given the opportunity to express their opinion but will less dramatically influence the final result. This type of analysis is much closer to the normal interaction that occurs in a discussion of experts where the stronger voices tend to have stronger influence on the final outcome than weaker ones, but they do not determine the final outcome. An approach where all utility values are treated equal cannot accomplish this.
The DIQ Utility Value Tree In economic and MAUT terms utility is defined as the amount of satisfaction that something brings to a situation
[12]. In order to simplify description and understanding of importance and utility we can describe those variables using a utility value tree. A utility value tree provides a convenient way to describe a concept like DIQ using a tiered approach. Under the primary attribute (DIQ in our case), you identify sub-attributes, each of which can be further divided into lower-level sub-attributes. Sub-attributes are components of the higher attributes in a leaves, twigs, and branches arrangement. While it is often impractical to go too deep on the tree, you can continue as many levels down as needed to describe your primary attribute. Representing DIQ as a utility value tree (
Figure 4 -DIQ Utility Value Tree Error! Reference source not found.) allows us to understand how the concept of DIQ is built by underlying sub-attributes. The value tree allows the researchers to accomplish several goals: 1) display their understanding of DIQ, 2) simplify the collection of stakeholders' relative importance ratings and expected utility, and 3) (we hypothesize) control for certain undesirable artifacts (i.e. social-response bias) normally elicited when respondents are asked about the importance of DIQ attributes [13]. Arranging DIQ categories and attributes into a utility value tree allows us to easily capture the relative importance values and expected utility values of each final node of the tree. These values can then be used in further calculations to compute relative utility, which we call the Q Value. The Q Value (Q) represents the relative expected utility of each decision choice within a decision matrix; therefore, if there are 6 decision choices (DX) within the matrix there would be 6 Q Values (QDx) which would be ranked highest to lowest, with the highest Q Value having the highest expected relative utility. This concept is explained below when we discuss the pilot testing of our instruments.
DIQ AND MAUT The DIQ framework, MAUT and the DIQ Utility Value Tree discussed above provide a basis for presenting the underlying methods for calculating Q Values. A simulated decision scenario is used to present the calculation of Q but first we will discuss issues about the collection of relative importance and expected utility ratings.
308
Proceedings of the Seventh International Conference on Information Quality (ICIQ-02)
Relative Importance Collection To facilitate the collection of importance ratings, five ratio-weighting scales are used to aid in the respondent’s assessment of the importance of DIQ attributes as they relate to the desired outcome, not to the choices for attaining that outcome. Four of the five scales elicit weights within the leaves of the utility value tree (
Figure 4 -DIQ Utility Value Tree Error! Reference source not found.) grouped by branches. Each of the four categories is used as separate scales, with the attributes within the branches being used as items (Table 1 - DIQ Framework). The fifth scale is composed of the categories as items. Respondents are asked to complete the four attribute scales then to complete the fifth category scale. Each scale is presented as a list. Since the format is identical for the importance scales, we only show an example (e.g., Figure 6 - Sample Ratio-weighting Scale of Contextual DIQ). Respondents are asked to place a 10 next to the item they believe least important to the decision to be made, then to work through the remainder of the list and assign a value to the other items that indicates their importance relative to the item they consider least important.
Importance of Ratio Weighting Scales and DIQ Previous studies found dramatic skewing when managers were asked to rate the importance of DIQ attributes [14]. The researchers believe this skewing represents substantial response bias since managers were uniformly reluctant to rate DIQ attributes as unimportant. However, since is it the relative preference for attributes that are needed in the MAUT calculations the researchers propose ratio-rating scales [15] as an alternative way to gather the managers’ relative importance ratings. When collecting importance-rating data to be used in Q Value calculations, the researchers desire to eliminate as much of the response bias as possible. To this end, several methods were reviewed for the collection of importance data. To date, pilot tests of instrumentation using a ratio-rating scale are most promising. Ratio weighting (i.e. Figure 2 - Sample DIQ Ratio Weighting Scale) does not use fixed anchors like a Likert scale (e.g., Figure 3 - Sample DIQ Likert Scale) but rather allows for the collection of relative weights. Since it is the relative weights and the ability to compare those relationships that are appropriate to this paradigm, ratio-rating scales are used. Ratio weighting also fits well with the use of a utility value tree.
309
Proceedings of the Seventh International Conference on Information Quality (ICIQ-02)
Please place a 10 next to the item that you consider least important. Then for then dimensions which you consider the next highest in order of importance assign a value that you indicates how much more important it is than the least important dimension.
Importance Weight Accuracy
Believability, Accuracy, Objectivity, Reputation
Relevancy
Completeness, Value-Added, Relevancy, Timeliness, Appropriate-Amount
Representation
Ease-of-use , Interpretability, Representational-Consistency ,ConciseRepresentation
Accessibility
Accessibility, Access-Security Figure 2 - Sample DIQ Ratio Weighting Scale
Dimension of Data Quality (definition) Access Security (data cannot be accessed by competitors, data are of a proprietary nature, access to data can be restricted, secure)
Extremely Important
Very Important
Important
Not Very Important
Not Important At All
1
2
3
4
5
1
2
3
4
5
Figure 3 - Sample DIQ Likert Scale
Expected Utility Collection Expected utility represents the maximum satisfaction that experts believe is possible for each choice-attribute pair (e.g., UDxAy could represent the utility (U) rating of the attribute access security (AY) for the choice web statistical (DX) shown in the simulated scenario below). Experts are asked for a general assessment that they are qualified to give. Once the expert rates this attribute, an expected utility value is available for use in further calculations. It is possible to use different experts to rate the expected utility of each choice-attribute pair (Udxay). Assuming that they are the same experts, the experts would be presented with a survey that asks for the expected utility (U) of each decision choice (DX) for each attribute (AY) (e.g., Figure 5 - Sample Utility Scales). If different experts were used for particular attribute-choice pairs, the Utility Scale would then be modified to present only the pairs that a given expert was being asked to rate. The goal is to collect utility ratings for all attribute-choice pairs for the 15 attributes for each choice in the decision matrix (4 choices and 15 DIQ attributes in our scenario given below would yield a total of 60 utility values (UDxAy)). These utility values are then used in the Q Value calculations (Equation 1 - Q Value Function). 310
U
DATA AND INFORMATION QUALITY (DIQ)
U
U
INTRINSIC DIQ (1)
CONTEXTUAL DIQ (2)
U
U
COMPLETENESS (2A)
ACCESS DIQ (4)
U
ACCESSCONVENIENCE(4A)
EASE-OF-UNDERSTNDING (3A)
311 U
U
REPRESENTATIONAL DIQ (3)
VALUE-ADDED (2B) U U
U
U
BELIEVABILITY(1A)
U
RELEVANCY (2C)
U
OBJECTIVITY (1C)
TIMELINESS (2D) U U
U
ACCURACY (1B)
U
ACCESS-SECURITY (4B)
INTERPRETABILITY (3B)
CONCISE-REPRESENTATION (3D)
APPROPRIATE-AMOUNT (2E)
REPUTATION (1D)
MZ indicates the main categories and AY the attributes The parenthetical number/letter nomenclature following the node names indicates the grouping of main categories and attributes.
(AY) Figure 4 -DIQ Utility Value Tree
U
REPRESENTATIONAL-CONSISTENCY (3C)
Proceedings of the Seventh International Conference on Information Quality (ICIQ-02)
(MZ)
Proceedings of the Seventh International Conference on Information Quality (ICIQ-02)
AY WEIGHTING Value-added IAy Data give you competitive advantage, data add value to your operations Relevancy IAy Applicable, relevant, interesting, usable Timeliness IAy Age of data Completeness IAy The breadth, depth and scope of information contained in the data Appropriate amount of data IAy The amount of data is appropriate to the task at hand IAy Indicates the relative importance weight for an individual attribute
AY indicates the attribute Figure 5 - Sample Utility Scales
Scale: 0=None or not at all; 100=the maximum possible These questions should be answered in relationship to the data collection project being considered Question WEB WEB Email Email Definition Ad Hoc Stat Ad Hoc Stat What level of access security can you expect for data collected using each type of data collection method: Access Security - data cannot be UDxAy UDxAy UDxAy UDxAy accessed by competitors, data are of a proprietary nature, access to data can be restricted, secure
UDxAy indicates the utility for a decision choice-attribute pair Figure 6 - Sample Ratio-weighting Scale of Contextual DIQ
15
(
QD X = ∑ I AY • U D X A Y =1
Y
)
Equation 1 - Q Value Function
Where: DX = Decision Choices (1, 2, 3, 4, 5…) AY = Attributes (AA, AB, AC, AD, BA…) I = Relative Importance of AY
U = Expected Utility of DX AY Pair Q = Relative Quality of DX AY Pair Y = Counter
THE SIMULATION The Scenario Pilot testing of our instrumentation was done using a simulation with 21 graduate students at the researchers' university to assess the use of the proposed paradigm for improving decision-making.
312
Proceedings of the Seventh International Conference on Information Quality (ICIQ-02)
A company has recently completed a customer relationship management (CRM) installation. They desire to collect data about the impact of the new system on customers so they can decide if the implementation was a success. The managers want to survey their customers regarding their satisfaction with the new system. Based on available technology and staff expertise, the managers have several choices regarding survey data collection: 1) whether to use a random sample or an ad hoc sample, and 2) whether to collect the data via their website or by email. The company arranged the two options into four choices (Table 2 - Decision Matrix).
AD HOC DATA COLLECTION STATISTICAL SAMPLING
WEB SURVEY
EMAIL SURVEY
WEB AD HOC (D1)
EMAIL AD HOC (D3)
WEB STAT (D2) Table 2 - Decision Matrix (DX)
EMAIL STAT (D4)
The definitions the company used for the decision table were: Creation of sampling frame: (2 options – Ad Hoc or Statistical) 1. Ad Hoc data collection refers to data collected without the rigor associated with statistical data sampling; and while it is less expensive than statistical data sampling there are many issues to consider for this type of data collection. An example of this type of data collection would be creating a web site and allowing all visitors that access the web site to complete a survey. 2. Statistical sampling refers to the application of statistical methods to select subjects to complete a survey. This method ensures that the data collected is more generalizable than ad hoc data sampling. An example of this would be the pre-selection of subjects based on accepted statistical techniques and the assignment of pass codes that allow subjects to complete a web-based survey. Technology: (2 options – Web or Email) 1. Web surveys were administered through a website that subjects visited. 2. Email Surveys were sent to the subject by email and returned by email. The goal of the company is to select the choice with the highest relative utility (Q) taking into account the quality importance ratings by managers and the expected utility ratings by internal company experts. To calculate the choice with the highest relative utility, relative importance ratings by managers and expected utility ratings by internal company experts need to be obtained.
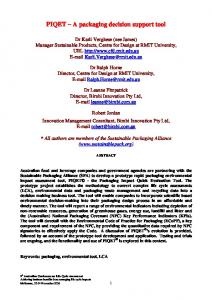
Results from Simulation During the first part of the simulation, subjects acted as managers completing importance ratings for the task of collecting survey data from customers (i.e., subjects were asked to rate the importance of the DIQ attributes for the survey data to be collected from customers). During the second part of the simulation subjects acted as experts giving expected utility for the 15 DIQ attributes for each of the four alternatives. Analysis of the choice one dataset indicates a substantial effect of managerial weighting of expected utility (Figure 7 - Effect of Managerial Importance Weightings on Expected Utility for Choice One). This figure shows the relative utility (expected utility weighted by importance) and the expected (un-weighted) utility for one choice in our simulation; note: values have been rescaled to a mean of zero.
313
Proceedings of the Seventh International Conference on Information Quality (ICIQ-02)
Weighted expected utility (Q) for all four choices in the simulation are shown in Table 3 - Q Value Decision Matrix for Simulated Scenario. These values seem to indicate that an email survey using statistical sampling will maximize the utility of those attributes that are important to managers.
4B 4A 3D 3C 3B 3A 2E 2D Weighted Utility Expected Utility
2C 2B 2A 1D 1C 1B 1A -2
-1
0
1
2
3
AVERAGE UTILITY 1A, 1B, 1C… ARE LEAVES (DIQ ATTRIBUTES) ON THE UTILITY VALUE TREE
Figure 7 - Effect of Managerial Importance Weightings on Expected Utility for Choice One
AD HOC DATA COLLECTION STATISTICAL SAMPLING
WEB SURVEY
EMAIL SURVEY
48.373 78.712
27.845 81.485
Table 3 - Q Value Decision Matrix for Simulated Scenario
CONCLUSION Use of Expert Knowledge Our pilot simulation used the same subjects as managers and experts. This obviously presents some issues with the validity of the pilot test. Our current thinking is that we should elicit expert knowledge 314
Proceedings of the Seventh International Conference on Information Quality (ICIQ-02)
about the expected utility of the choices in our simulation. Then, those utility values can be combined with real managerial importance ratings. This will minimize the confounding caused by having subjects act as both managers and experts.
Mediating Factors Clearly, DIQ attributes are not the only factors to be considered when making DIQ driven decisions. Industry specific attributes, cost, and organizational procedures are but a few of the other factors that are part of the decision making process. The researchers' model employs DIQ attributes and MAUT to present a tool that moves at least part of the decision to a semi-structured [16] state.
Sensitivity Analysis Once sufficient samples are collected the researchers will be able to perform sensitivity analysis on Q Values. That analysis will allow us to determine the differences in Q Values that should be considered significant and at what threshold choices should be eliminated. However, at this point early indications are that that Q Values are situation specific, and that comparing sensitivity analysis across samples or scenarios may not be very meaningful.
Further Testing This paper presents a decision support paradigm that uses multi-attribute utility theory and DIQ attributes to help managers make better decisions for data and information driven decisions. The following is planned for completion in future testing: 1. Continue pilot testing instrumentation with graduate students; 2. Collect data from managers as they make decisions and thus test the efficacy of this paradigm for improving decision-making; 3. Collect data from experts. 4. Determine the extent to which DIQ is domain specific.
REFERENCES 1. 2. 3. 4. 5. 6. 7. 8. 9.
Bichler, M., et al., ABSloute: An Intelligent Decision-Making Framework for E-Sourcing, in IBM T.J. Watson Research Center Publications. 2002: Yorktown Heights, NY. Baron, J. (2002) Laser Eye Surgery Decision Aid, Retrieved 8/30/2002. from http://www.psych.upenn.edu/~baron/lasik.htm, University of Pennsylvania Tayi, G.K. and D.P. Ballou, Examining data quality. Communications of the ACM, 1998. 41(2): p. 54-57. Wang, R., V. Storey, and C. Firth, A framework for analysis of data quality research. IEEE Transactions on Knowledge and Data Engineering, 1995. 7(4): p. 623-640. Redman, T.C., Quoted in Wang: A framework for analysis of data quality research. 1992. Porter, M. and V.E. Millar, How information gives you competitive advantages. Harvard Business Review, 1985. 63(4): p. 149-160. Wand, Y. and R. Weber, A model for control and audit procedure change evolving data processing systems. The Accounting Review, 1989. 64(1): p. 87-107. Codd, E.F., A relational model of data for large shared data banks. Communications of the ACM, 1970. 13(6): p. 377-387. Codd, E.F., Improving data quality. Journal of Systems Management, 1988. 39(5): p. 31-35.
315
Proceedings of the Seventh International Conference on Information Quality (ICIQ-02)
10. 11. 12. 13. 14. 15. 16.
Wang, R.Y. and D.M. Strong, Beyond accuracy: what data quality means to data consumers. Journal of Management Information Systems, 1996. 12(4): p. 5-34. Posavac, E.J. and R.G. Carey, Program Evaluation: Methods and Case Studies. 1989, Englewood Cliffs: Prentice Hall. Baumol, W.J., Economics: Principles and Policy. Sixth ed. 1994, Orlando: Harcourt Brace and Company. 999. Gendron, M.S. and M.J. D'Onofrio, Data Quality in the Healthcare Industry. Data Quality, 2001. 7(1). Gendron, M.S. and M.J. D'Onofrio. Data Quality in the Healthcare Industry: An Exploratory Study. in Systemics Cybernetics and Informatics. 2000. Orlando, FL. Edwards, W. and J.R. Newman, Multi-attribute Evaluation. 1982, Thousand Oaks, London, New Dheli: Sage Publications. 95. Simon, H., The New Science of Management Decision. 1977, Engle Cliffs, New Jersey: Prentice-Hall.
316