Quality of Data Model For Supporting Mobile Decision Making Julie Hodgkin* Jocelyn San Pedro** Frada Burstein*** *Department of Computing Science and Mathematics University of Stirling FK9 4LA Email:
[email protected] School of Information Management and Systems Monash University Melbourne, Australia Email:
[email protected] Email:
[email protected]
Abstract This paper describes research investigating ways in which a mobile decision support system might be implemented. Our view is that the mobile decision maker will be better supported if he/she is aware of the Quality of the Data (QoD) used in deriving the decision, and how QoD improves or deteriorates while he/she is on the move. We propose a QoD model that takes into account static and dynamic properties of the mobile decision making environment, use multicriteria decision analysis to represent the user’s decision model and to derive a single QoD parameter, and investigate use of powerful graphics to relay information to the user.
Keywords Mobile decision support, multicriteria decision analysis, quality of data
1. INTRODUCTION The last decade has seen huge advances in the way humans interact with technology. Users of computers are no longer restricted to the office desktop, but can now access technology anywhere, anytime. The spread of eservices and wireless devices has facilitated a new way of using computers, increased accessibility to data, and in turn, influenced the way in which users make decisions while on the move. Consider for example a tourist who is looking for the nearest parking space in a city. If he has a mobile device that can locate available parking spaces nearby, then he doesn’t need to waste time driving around in search for a spot. In this situation, the mobile device provides decision support to the tourist by giving him instant access to data (i.e., available parking spaces). However, if the tourist is not quick enough, someone else might take such parking spot. Wouldn’t he be better supported if the mobile device could also advise him that the parking spot he found is expected to be taken within the next 5 minutes? In this case, we are raising the level of decision support by providing the tourist with added information indicating the validity of data relative to time. The scenario discussed above is an example of mobile decision making in which the decision maker is faced with the task of choosing the best option from a set of available options while he is on the move. In mobile decision making, the alternatives will be compared on the basis of their evaluations (or scores) against multiple criteria and such evaluations may vary due to context changes. For example, as the tourist moves from one city to another, the availability of parking spots, security at parking spaces, or waiting time until a space becomes available will vary accordingly. In this paper, we propose a quality of data (QoD) model that takes into account static and dynamic properties of the mobile decision making situation. We also propose a visual display of the decision model as well as a QoD indicator, both of which are suitable for implementation in a mobile device. Our view is that the mobile decision maker will be better supported in his choice making if he is aware of QoD used in deriving the decision, and how QoD improves or deteriorates while he is on the move.
372
Decision Support in an Uncertain and Complex World: The IFIP TC8/WG8.3 International Conference 2004
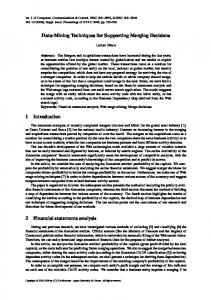
2. QoD FRAMEWORK FOR MOBILE DECISION SUPPORT Our idea of informing the mobile user of QoD to support the decision-making task is not new. Most mobile devices use icons and alerts to indicate different measures of QoD. The available battery energy, for example, is usually represented in mobile phones by a battery icon with four bars, where 4 bars indicate full energy while 1 bar indicates low energy (See Figure 1a). When there is not enough energy, the user receives an alert indicating a low battery. The user then becomes aware that he should not finalise a business transaction over the phone, as the business call might be cut off anytime. Network connection is usually represented by an antenna (Figure 1b). When the network connection is weak, the mobile user is aware that it will take long to download a website from the device. Network security, on the other hand, is usually indicated by a padlock as shown in Figure 1c. When the network is safe, the padlock is locked, when not safe, the padlock is unlocked. When the mobile user wishes to access confidential data from his mobile device he will ensure that the padlock is locked, reflecting a secure environment.
D
D a. Energy
b. Network connectivity
c. Network security
d. Overall QoD
t (mins) 0
5
10
20
e. Overall QoD over time
Figure 1: Some QoD indicators in mobile device Figures 1a-1c relate only to technical aspects of the mobile environment. Each technical parameter is represented individually, and addresses specific technical support (energy, connectivity, security). We propose the notion of overall QoD as an aggregate measure of technical parameters as well as other factors depending on the user and on the context of decision making. We visually represent the overall QoD using a single icon as shown in Figure 1d and depict how it improves or deteriorates over time while connected or disconnected from the network (Figure 1e). As shown in Figure 1e, the overall QoD may deteriorate 5, 10, or 20 minutes from when the mobile is disconnected from the network; or 5, 10, 20 minutes away from the current location of the user; or 5, 10, 20 minutes from when data was last updated. If such visual representation is adopted in a mobile device, the user is made aware of the parameters that have been considered in the calculation of QoD. Thus, specific to the user, the decision-making context, and the mobile device used, the overall QoD will vary from user to user, from one decision context to another, from one location to another, or from one mobile device to another. Recent work on mobile decision support focuses on implementation of knowledge-based services on hand-held computers. Work on mobile clinical support systems, for example, addresses different intelligent decision support such as knowledge delivery on demand, medication consultant, therapy reminder (Spreckelsen et al, 2000), preliminary clinical assessment for classifying treatment categories (San Pedro et al, 2003; Michalowski et al, 2003), and providing alerts of potential drugs interactions and active linking to relevant medical conditions (Chan, 2000). These systems also address mobility by providing intelligent assistance on demand, at the patient’s bedside or on-site. Research on location-based mobile support systems uses search, matching and retrieval algorithms to identify resources that are in proximity to the location of the mobile users and that satisfy multi-attribute preferences of the users and the e-service providers. Examples of such location-based systems are those that recommend best dining options to mobile users (Tewari et al, 2000), locate automatic teller machines nearby (Roto, 2003), and locate nearest speed cameras and intersections from GPS-enabled mobile devices. Most of these mobile support systems use intelligent technologies and soft computing methodologies (e.g., rule-based reasoning, rough sets theory, fuzzy sets theory, multi-attribute utility theory) as background frameworks for intelligent decision support. However, none of these systems address the issue of quality of data or quality of decision support while connected or disconnected from the network. In the sense that no aggregate measure of QoD has yet been proposed to support mobile decision-making, our QoD framework can be regarded as novel and unique. In Figure 2 we show how QoD can be represented as an aggregate measure of technology-related parameters (e.g., energy, security, connectivity), user-related parameters (e.g., stability of scores or weights in user’s decision model), and data quality parameters that are related to historical context (e.g., completeness, currency, accuracy of historical data). For example, when buying foreign currencies, the user can be better supported if he
373
Quality of Data Model For Supporting Mobile Decision Making knows the current foreign exchange rates. In this case, currency of data may be considered as QoD parameter. In our search for parking example, validity of the data is another QoD parameter. We can also include the accuracy of predicted data, if such prediction can support the decision making task at hand.
Energy Technology-related context
Security Connectivity Stability of scores
D
User-related context
User’s Decision Model Stability of weights Completeness
Historical context
Currency Accuracy
Figure 2: A sample multi-context representation of QoD This view on overall QoD being influenced by different context changes on the mobile environment was first investigated by the authors in [references removed for the anonymity purposes]. In these papers, we identified that user-related and technology-related contexts, as well as historical context should be addressed when representing the QoD when using data to support mobile decision making. In the following section, we focus on user-related contexts influencing the overall QoD. We consider a choice problem while the user is on the move. We represent the user’s choice problem as a multicriteria decision analysis model, and then consider stability of data as one QoD parameter. We discuss how stability of data may be measured and incorporated in the overall QoD.
3. MULTICRITERIA DECISION ANALYSIS In day-to-day life, we are often faced with the task of selecting an action to be performed from a set of feasible alternatives. The practical difficulty is that such decision problems generally involve multiple objectives, thus making them not so easy to resolve. Within the field of Multicriteria Decision Making (MCDM) or Multicriteria Decision Analysis (MCDA), formal approaches have been developed with the aim of ensuring a structured approach is adopted for such decision making. These formal approaches include multi-attribute value function approaches, inverse preference methods, outranking approaches, and multi-objective mathematical programming methods (Stewart, 1992). Some of these formal approaches have been implemented in stand-alone, non-mobile multicriteria decision support systems (MDSS) to support decision-makers in structuring the choice problems, selecting the best course of actions, and interpreting the outcomes of the selection process. These MDSS include V•I•S•A (Belton and Hodgkin, 1999; Hodgkin and Belton, 2003; www.simul8.com/products/visa.htm), LOGICAL DECISIONS (www.logicaldecisions.com), PROMCALC (Brans and Mareschal, 1994), EXPERT CHOICE (Saaty, 1995; www.expertchoice.com), QUALIFEX (Linden and Stijnen, 1995), and many others listed in Pomerol and Romero (2000). Except for the MARI (Multi-attribute Resource Intermediary) architecture that uses multi-attribute utility theory to provide e-negotiation support between buyer and e-service providers (Tewari et al, 2000), there are so far no MDSS successfully implemented on mobile devices to support the mobile decision-maker. In our current research, we are investigating new ways to raise the level of decision support that the mobile decision-maker receives from his mobile device. We are looking to provide visual displays of the user’s decision model and an associated QoD model following our QoD framework for mobile decision support. From hereon, we shall represent the user’s choice problem as a multicriteria decision model. Our chosen approach is that based on the
374
Decision Support in an Uncertain and Complex World: The IFIP TC8/WG8.3 International Conference 2004 Multi-Attribute Value Function (MAVT). The two major components of a value function are the evaluation scores of alternatives with respect to criteria, and the relative importance or weight of each criterion. The approach is appropriate if preference independence exists between criteria. MAVT is the approach that the authors have the most familiarity, in addition, it is empirically well validated (Belton, 1990; French, 1998). 3.1 Static Decision Making To date, much of our work has adopted MCDA to aid in static decision making. In static decision making, we can assume that the evaluation of alternatives with respect to criteria is constant (over a given period of time), and evaluations will not fluctuate according to some external factor. For example, in assessing a suitable location to conduct a conference, criteria such as size of rooms, facilities available, and accommodation costs will have scores that are unlikely to change from one minute, or even one day, to the next. In such a situation we can represent this decision using a value tree. This is depicted in Figure 3. The value tree represents the breakdown of criteria relevant to the problem in hand, with the most general, higher level criteria towards the left, and more specific lower level criteria towards the right. Criteria on separate branches should be conceptually independent: a concept should only be represented under one heading and not be “doublecounted”.
Figure 3: Model of choosing where to hold a conference (Hodgkin et al, 1998) 3.2 Dynamic Decision Making Not all decisions we make are static. Often, external factors can cause the scores we would give to an alternative for a particular criterion to fluctuate. For example, if travel time is important to us, listening to travel reports on the radio prior to setting off for work in a morning, may cause us to re-rank which mode of transport will get us to work in the shortest time. This scenario is still not static, as 5 minutes into our journey the travel situation may change again, such that perhaps a different mode of transport would have been preferable. In such situations, it is important to have some indication of how static or dynamic our decision is, and some estimation of the time period over which the stability of the data is likely to be maintained. It is here we see the need to not only provide decision support in the more traditional sense as seen with static decisions, but also to give some indication of the quality of the decision or QoD being received.
375
Quality of Data Model For Supporting Mobile Decision Making Figure 4 depicts an example value tree used in assessing the best mode of transport to take to work. In this decision model, the scores of alternatives against the given criteria can be static or dynamic. By static score, we mean the score doesn’t change despite changes in the time, weather, network connection, or other context changes. For example, the cost factors (direct cost, environmental cost, indirect cost) can be static scores. Although cost scores may fluctuate once or twice in a 12-month period, over a smaller period of time (for example minutes), the cost of a transport method from one minute to the next is fairly constant. Obviously it is important to determine the likely time frame in which the decision will be made in order to categorise the score as being static or dynamic. A Dynamic score relates to an evaluation score that varies with changes in the mobile environment. Thus, a score that is not static is described as either unstable or dynamic. In our example, the travel time associated with a given transport method is highly dependent on current traffic conditions, and therefore can change from one minute to the next. Other factors that can be regarded as dynamic that are not depicted in our model include suitability of transport given weather conditions. If it is dry and sunny, we may not mind walking 10 minutes to the bus stop to catch our bus, but if it starts to rain, this may cause us to consider taking the car as a better alternative to choose.
Alternatives: Bus Train Car Bike
Figure 4: Model used in deciding on mode of transport to take to work 3.3 Stability of scores When using a multicriteria model to represent a choice problem in mobile decision-making environment, it is important to indicate whether the scores of alternatives are static or dynamic. This is where a measure of stability of evaluation scores will be useful. We shall refer to this measure as the stability of scores. One way to measure the stability of a score is to use a simple scale from 0 to 100, where 0 represents a dynamic value, 100 denotes a static value. For example, as shown in Figure 5, the shaded bars on the left correspond to the evaluation scores of the alternatives against travel time criterion. Associated with each score, is a measure of stability of the score for the given time frame (e.g., 60 mins). In Figure 5, the stability of each score is represented by the bar on the right of the evaluation score. Thus, the travel time for car can be interpreted as being more dynamic than travel time for bus within the 60-minute time frame. The travel time for train is a bit less stable than travel time for bike, which is fairly static during the hour. An overall stability of scores can be taken as a weighted sum of all stability scores after considering all criteria. The overall stability can reflect the stability or sensitivity of the decision outcome to fluctuations in the evaluation scores.
376
Decision Support in an Uncertain and Complex World: The IFIP TC8/WG8.3 International Conference 2004
Travel Time (mins)
Stability of Score
60
100
0
0 Bus
Train
Car
Bike
Figure 5: Modelling stability of scores of alternatives with respect to “travel time” criteria 3.4 Stability of weights Stability of weights associated to criteria may also be considered when using a multicriteria decision model to represent a real-time choice problem. A mobile decision maker may change his weight preferences as a result of context changes. In our “mode of transport” example, the user might put more weight on travel time in the morning peak-hours before work, but more weight on enjoyment during after-work hours. The stability of individual weights, as well as the overall stability of weights, may be measured in the same way as the stability of scores and overall stability of scores. The overall stability of weights can reflect the stability or sensitivity of the decision outcome to fluctuations in criteria weights. 3.5 Overall QoD Using our multi-context representation of QoD, we can use the overall stability of scores and overall stability of weights as user-related QoD parameters. Depending on the context of decision-making, some of the technical parameters may not be considered in the overall calculation of QoD, but can remain as separate considerations. Decision-making tasks requiring secured network connection, for example, can put upmost importance to security. The mobile user in this case might prefer checking the status of padlock icon before the decisionmaking task is initiated. 3.6 Predicted Overall QoD By using some simple forecasting techniques, or more complex data-mining techniques, we can calculate a measure of how the QoD will fluctuate over time. For example, we can use simple moving average forecasting model to automatically calculate the validity of the data relating to parking space at the city, or predict the stability of travel time for bus or train using average travel times for the past year.
4. VISUAL INTERFACE In our ongoing research, we are investigating ways in which an MCDA model could be adequately represented on a mobile device. Recent work (Hodgkin and Belton, 2003) on static decision-making has addressed the issue of visual interactive displays and proposed the use of a triangle-plot. This approach, although not new to MCDA (Hodgkin et al, forthcoming), is novel in terms of development of the interface to support the MAVT approach, and evaluation through use of case studies. Results from such studies have suggested that the plot is useful in investigating model robustness, and providing holistic data concerning the decision model. Although further research is required, one possible way in which we see the decision model, associated QoD, and forecasting feature being represented is shown in Figure 6. The triangle-plot depicted in Figure 6 shows the robustness of the decision. The model focuses on the top 3-criteria of our ‘mode of transport’ model as shown in Figure 4. Depending on the importance placed on each of the three criteria, the shaded triangle in Figure 6 indicates which alternative is the “best” one to go with. So for example, a high weight placed on Travel Time indicates that the car is the best option, while a high weight on cost (where we are trying to minimise cost) 377
Quality of Data Model For Supporting Mobile Decision Making indicates the bus is the best option. However, for all other combinations of weights, it would seem that the train is the best option to go with. In this example, the train would seem to be a robust option unless either of the first two weighting scenarios was to be adopted.
Figure 6: Visual interface for the “mode of transport” choice problem The QoD bar on the upper left of Figure 6 indicates the current QoD. As 4 out of 5 bars are showing, this indicates that the current QoD is fairly high. Obviously the decision maker would have to decide whether QoD is sufficiently high to follow the recommendation made. The QoD graph to the right of the figure is providing a forecast of how the QoD will fluctuate over time t. On a mobile phone, it is possible that this display could be selected by the user clicking the right scroll arrow on their phone. From the graph we can see that in 5 minutes, should network connectivity be lost or no further updates be received, the QoD will decrease. In future case studies, we will be exploring how such visual representations may provide real-time assistance to the mobile decision-maker, following our view on mobile decision support as discussed in Section 2.
5. CONCLUSIONS Our recent work on mobile decision support is based on our view that the mobile decision maker will be better supported if he/she is aware of the QoD used in deriving the decision and how it improves or deteriorates over time. In this paper, we represented the user’s decision problem as a multicriteria decision analysis model with dynamic as well as static attributes. Static attributes are those attributes that do not vary with context changes (e.g., changes in time, weather, network connectivity, network security, location, etc.), while dynamic attributes are those that are prone to change over a given time period. We considered the overall stability of evaluation scores and overall stability of criteria weights to capture these static and dynamic attributes of the decision model, and considered them as user-related QoD parameters. We also suggested providing a predicted measure of overall QoD over time to further inform the user of likely changes in QoD and their impact on the decision outcome. We briefly touched on the area of sensitivity of decision outcome to changes in evaluation scores or changes in criteria weights. When presented simultaneously to the mobile decision maker, a triangle-plot that displays the user’s decision model and a QoD indicator (such as QoD bar or QoD graph) can inform the user of the sensitivity of the decision to changes in evaluation scores or criteria weights, and may indicate robustness of the decision. In our ongoing research we plan to investigate further the potential benefits in providing QoD models for supporting mobile decision-making. QoD models for specific decision-making scenarios will be considered. We are currently exploring how our QoD framework may be implemented to support triage in emergency departments following a recent work in (San Pedro et al, 2003). Case studies will also be conducted to determine if our visual displays of the user’s decision model and QoD model have an impact on the user’s decision-making capability, and how they may be best implemented to achieve the desired level of decision support.
378
Decision Support in an Uncertain and Complex World: The IFIP TC8/WG8.3 International Conference 2004
REFERENCES Belton, V. (1990) “Multiple Criteria Decision Analysis, practically the only way to choose” in Hendry, L. and Eglese, R. (Eds.) Operational Research Tutorial Papers, 53-101. Belton, V., and Hodgkin, J. (1999) Facilitators, decision makers, D.I.Y users: Is intelligent multicriteria decision support for all feasible or desirable? European Journal of Operational Research, 113 (2), 247260. Brans, J. P. and Mareschal, B. (1994) The PROMETHEE-GAIA decision support system for multicriteria investigations, Investigation Operativa, 4(2), 102-117. Chan, A. (2000) WWW+ smart card: Towards a Mobile Health Care Management System, International Journal of Medical Informatics, 57, 127-137. French, S. (1988) Decision Theory: An Introduction to the Mathematics of Rationality, Ellis Horwood, Chichester. Hodgkin, J., Belton, V. (2003) Development and Evaluation of Two Decision Support Systems to Provide Intelligent User Support for Multicriteria Decision Making, in T. Bui, H. Sroka, S. Stanek, J. Goluchowski, (Eds.), Proceedings of the 7th International Conference of the International Society for Decision Support Systems: DSS in the Uncertainty of the Internet Age (pp 201-204), Ustron, Poland. Hodgkin, J., Belton, V. Koulouri, K. Supporting the Intelligent MCDA user: A Case Study in Multi-person Multicriteria Decision Support (forthcoming) Hodgkin, J., Malyon, B., Morton, A. (1998) An Introduction to Two Group Decision Support Systems, Keynote/Tutorial paper of 10th Young Operational Research Conference, University of Surrey, Guildford. Linden, J. van der and Stijnen, H. (1995) QUALIFEX version 2.3, A Software Package for Multicriteria Decision Analysis, Kluwer. Michalowski, W., Rubin, S., Slowinski, R. and Wilk, S. (2003) Mobile Clinical Support System for Pediatric Emergencies, Decision Support Systems, 36, 161-176. Pomerol, J. –C., and Barba-Romero, S. (2000) Multicriterion Decision in Management: Principles and Practice, Kluwer Academic Publishers, Boston, USA. Roto, V. (2003) Search on Mobile Phones, URL http://home.earthlink.net/~searchworkshop/docs/RotoSearchPositionPaper.pdf, Accessed 11 Nov 2003. Saaty, T. L. (1995) Decision Making for Leaders: The Analytic Hierarchy Process for Decision sin a Complex World, RWS Publications, 3rd edition, Pittsburgh, USA. San Pedro, J., Burstein, F., Zaslavsky, A. (2003a) An approach to sensitivity analysis for data quality assessment in mobile decision-making, in T. Bui, H. Sroka, S. Stanek, J. Goluchowski, (Eds.), Proceedings of the 7th International Conference of the International Society for Decision Support Systems: DSS in the Uncertainty of the Internet Age (pp 323-332), Ustron, Poland. San Pedro, J., Burstein, F., Zaslavsky, A. (2003b) Support for Real-Time Decision-Making in Mobile Business Applications, in the Proceedings of the Second International Conference on Mobile Business (pp. 383-392), Vienna, Austria, June 23-24. San Pedro, J., Burstein, F., Churilov, L., Wassertheil, J. and Cao, P. (2003) Intelligent Multiattribute Decision Support Model For Triage, submitted to International Conference in Information Processing and Management of Uncertainty in Knowledge-Bases Systems, to be held in July 4-9, 2004, Perugia, Italy. Spreckelsen, C. Lethen, C., Heeskens, I., Pfeil, K., and Spitzer, K. (2000) The Roles Of An Intelligent Mobile Decision Support System In The Clinical Workflow, URL citeseer.nj.nec.com/spreckelsen00roles.html, Accessed 11 Nov 2003. Stewart, T.J. (1992) A Critical Survey on the Status of Multiple Criteria Decision Making-Theory and Practice. OMEGA, 20, 5/6, 569-586. Tewari, G., Youll, J. and Maes, P. (2000) Personalized Location-Based Brokering Using an Agent-Based Intermediary Architecture, in Proceedings of the International Conference on E-Commerce, Seoul, Korea.
379
Quality of Data Model For Supporting Mobile Decision Making
COPYRIGHT Hodgkin, J., San Pedro, J., Burstein, F. © 2004. The authors grant a non-exclusive licence to publish this document in full in the DSS2004 Conference Proceedings. This document may be published on the World Wide Web, CD-ROM, in printed form, and on mirror sites on the World Wide Web. The authors assign to educational institutions a non-exclusive licence to use this document for personal use and in courses of instruction provided that the article is used in full and this copyright statement is reproduced. Any other usage is prohibited without the express permission of the authors.
380