IEEE TRANSACTIONS ON BIOMEDICAL ENGINEERING, VOL. 55, NO. 3, MARCH 2008
949
Fractional Delay Estimation for Blind Source Separation and Localization of Temporomandibular Joint Sounds Clive Cheong Took*, Member, IEEE, Saeid Sanei, Senior Member, IEEE, Scott Rickard, Senior Member, IEEE, Jonathon Chambers, Senior Member, IEEE, and Stephen Dunne
Abstract—Temporomandibular joint (TMJ) sound sources are generated from the two joints connecting the lower jaw to the temporal bone. Such sounds are important diagnostic signs in patients suffering from temporomandibular disorder (TMD). In this study, we address the problem of source separation of the TMJ sounds. In particular, we examine patients with only one TMJ generating “clicks.” Thereafter, we consider the TMJ sounds recorded from the two auditory canals as mixtures of clicks from the TMD joint and the noise produced by the other healthy/normal TMJ. We next exploit the statistical nonstationary nature of the TMJ signals by employing the degenerate unmixing estimation technique (DUET) algorithm, a time–frequency (T–F) approach to separate the sources. As the DUET algorithm requires the sensors to be closely spaced, which is not satisfied by our recording setup, we have to estimate the delay between the recorded TMJ sounds to perform an alignment of the mixtures. Thus, the proposed extension of DUET enables an essentially arbitrary separation of the sensors. It is also shown that DUET outperforms the convolutive Infomax algorithm in this particular TMJ source separation scenario. The spectra of both separated TMJ sources with our method are comparable to those available in existing literature. Examination of both spectra suggests that the click source has a better audible prominence than the healthy TMJ source. Furthermore, we address the problem of source localization. This can be achieved automatically by detecting the sign of our proposed mutual information estimator which exhibits a maximum at the delay between the two mixtures. As a result, the localized separated TMJ sources can be of great clinical value to dental specialists. Index Terms—Blind source separation (BSS), click, fractional delay estimation, temporomandibular joint (TMJ) sounds.
I. INTRODUCTION
T
EMPOROMANDIBULAR DISORDER (TMD) refers to most medical problems related to the region of the mandible (lower jaw) and the temporal bone. TMD is traditionally diagnosed by stethoscope auscultation. Hence, temporomandibular joint (TMJ) sounds have long been associated with TMD [2]–[5]. In our study, we consider the case where there is only one defective TMD joint, with the other joint as a healthy/normal one.1 This particular scenario has already been addressed by Widmalm et al. [6], [7]. However, these researchers regarded the “echo” recorded on the contra (opposite) side of the TMD joint as the lagged version of the TMD source. In this work, we consider the possibility that this echo can in fact be a mixture of the TMD source and the noise produced by the normal TMJ. Mathematically, our model of the observed sound measurements is represented as (1)
is the th TMJ mixture signal and represents where additive zero mean white Gaussian noise at discrete time for . The parameters are the attenuation coefficients and are generally the noninteger time delays associated with the path from the th source to the th sensor (stethoscope). The from the mixtures can be formuproblem of recovering lated as that of blind source separation (BSS). Likewise, the mixing matrix can be defined as follows: (2)
Manuscript received May 20, 2007; revised August 9, 2007. Asterisk indicates corresponding author. *C. Cheong Took is with the School of Engineering, Electronic Engineering Research Office, Cardiff University, The Parade, Cardiff, CF24 3AA, U.K. (e-mail:
[email protected]). S. Sanei is with the School of Engineering, Cardiff University, Cardiff, CF24 3AA, U.K. (e-mail:
[email protected]). S. Rickard is with the Complex and Adaptive Systems Laboratory, University College Dublin, Belfield, Dublin 4, Ireland (e-mail:
[email protected]). J. Chambers is with the Advanced Signal Processing Group, Department of Electronic and Electrical Engineering, Loughborough University, Loughborough, Leics LE11 3TU, U.K. (e-mail:
[email protected]). S. Dunne is with the GKT Dental Institute, Denmark Hill Campus, London SE5 9RW, U.K. (e-mail:
[email protected]). Digital Object Identifier 10.1109/TBME.2007.909534
denotes the unit delay. These delays are in terms of where samples. Also, it is noted that the best audio information from the TMJ sources can be achieved by placing microphone sensors in the auditory canals [8]. For accuracy in modeling, we have to be fractional because we do not know the exact considered head size and speed of sound in the tissue. In this work, the main assumptions made are as follows: 1) all the source signals are statistically nonstationary and sparse in the time–frequency (T–F) domain and 2) the mixing model (1) holds with mixing matrix (2). 1This work has been inspired by [1]. In contrast to [1], however, we separate real TMJ mixture sounds, and do not consider synthetically mixed TMJ sources. Furthermore, we address the problem of source localization.
0018-9294/$25.00 © 2008 IEEE
950
IEEE TRANSACTIONS ON BIOMEDICAL ENGINEERING, VOL. 55, NO. 3, MARCH 2008
The aim of this paper is to address the problem of source separation of real TMJ sources. In [1], we solve this TMJ separation problem by considering an anechoic model of the head, while in [9], the mixing model was an instantaneous and underdetermined one. These studies were, however, carried out based on synthetic mixing of the TMJ sources. Guo et al. separated the biologically mixed TMJ sources by modeling the acoustic mixing system of the head as a convolutive one [10]. However, there exists one fundamental issue which has been not addressed by all these three studies, i.e., the statistical dependence of the TMJ sources. Whenever a person performs the following movement—opening–closing of the mouth—both joints operate in a synchronous fashion. Therefore, the statistical independence assumption of the TMJ sources is questionable. In contrast to these approaches, we will employ a T–F masking approach to perform source separation on the biologically mixed TMJ sounds. We believe that this approach is more suitable for this particular source separation, as we do not assume the statistical independence of the sources. The extensive literature on the T–F analysis of the TMJ signals also supports our approach and it will be discussed later [11]–[15]. The organization of this paper is as follows; in the next section, we review briefly the background on the TMD and provide justifications of an anechoic model of the head. In addition, we overview the degenerate unmixing estimation technique (DUET) algorithm and explain how we can circumvent one of its nontrivial constraints to solve TMJ BSS. This is followed by a review on fractional delay. We close this section with a summary of our proposed source separation procedure. Thereafter, we present some experimental results to verify the effectiveness of our source separation technique. Subsequently, we provide some discussions on the estimated TMJ sources in Section IV. Last, we conclude in Section V. II. BACKGROUND A. Temporomandibular Disorder The TMD encompasses most medical problems related to the region of the mandible (lower jaw) and the temporal bone. TMD is the most common nondental related chronic source of oral–facial pain [16]–[18]. Some 75% of the United States population will at some time have some of the signs and symptoms of TMD [19], with a similar figure in the United Kingdom [16]. There are two well-known TMJ sounds: click and crepitus. Generally, the click is related to the displacement of the disc which holds the mandible and the temporal bone, and hence conveys the dysfunction of the TMJ. Likewise, the crepitus hints at the presence of a degenerative joint disease (e.g., osteoarthrosis). Therefore, poor detection of these sounds can lead to misdiagnosis of TMDs. A dental specialist has to differentiate between the TMJ sounds such as click, crepitus and noise produced by a “normal” joint. Besides, the inherently subjective classification of these TMJ sounds makes it hard for the clinicians to determine the correct pathology. This has led to controversy as in [16], [20], and [21]. It was also highlighted in [22] that patients, who did not exhibit symptoms of TMD, suffered from this disorder, hence illustrating that the diagnosis of TMD can be quite challenging.
The focus of this work is to examine TMJ audio signals recorded from patients with one TMD joint generating clicks. For this particular case, Widmalm et al. demonstrated that false localization of the TMD joint is an important source of error [6], [7]. In their work, the possibility that the “echo” recorded on the contra side of the TMD joint is a mixture of the click produced by the TMD joint and the noise generated by the “normal” TMJ was not considered. Therefore, the main contribution of this study is to separate the TMJ sources from the TMJ mixture sounds recorded at the auditory canals. Hence, we can see that a 2 2 (two sources, two mixtures) BSS scenario portrays itself in the source separation of TMJ sounds. We take the same approach as Widmalm et al., who showed that the best audio information from the TMJ joints can be achieved by placing a pair of microphones in the auditory canals [8]. Even with the successful separation of the TMJ sources, we have to determine to which source, the left or the right TMJ, the sounds come to facilitate the task of the clinician. This gives rise to a localization problem, which will be discussed later. Next, we provide justifications for our assumption on the anechoic model of the human head. B. Anechoic Model of the Human Head Modeling the acoustic properties of the human head remains an open problem. The geometrical structure of the skull, coupled with the fact that the human head comprises soft tissue, layered bone, and brain tissue, has made it impossible to date to achieve an analytical solution of the acoustic properties of the brain and due to ethical reasons, direct measurements in a living human being is hardly possible [23]. Guo et al. made the assumption that the acoustic propagation model of the head was convolutive [10], in the context of TMJ source separation. This intuitive assumption did not consider any physiological aspects of the human head and no existing literature review supports this convolutive model, to our best knowledge. The existence of acoustic multipaths within the human head is plausible, yet the acoustic attenuation within the brain reported in the literature suggests that these multipaths from one side of the head to the opposite side are negligible. Hence, we deem that an anechoic model of the head is reasonable due to the following arguments. • Widmalm et al. demonstrated in their study that a contra (opposite side of the TMD joint) TMJ sound was a delayed version of its ipsi (the same side of the TMD joint) TMJ sound by only one lag [7]. This supports the fact that there is at most one “effective” acoustic path across the skull. • Furthermore, the higher frequencies (i.e., greater than 1200 Hz) of the ipsi TMJ sound were found to be severely attenuated in [8] when it propagated to the contra side which corroborates with the findings in [23]. Moreover, the spectrum of TMJ sounds has a bandwidth of 20–3200 Hz [8], [24]. Hence, most of the energy content of the propagated TMJ sound is severely attenuated. This is clear by comparing the spectrum of the contra and the ipsi TMJ sounds in [8, Fig. 6]. This remark, regarding the significant loss across the human head, is also in agreement with the study of O’Brien et al., which indicated an acoustic loss of approximately 33 dB [25]. On this basis, the assumption of multipaths of the ipsi TMJ source to the contra side is
CHEONG TOOK et al.: FRACTIONAL DELAY ESTIMATION FOR BSS AND LOCALIZATION OF TMJ SOUNDS
951
questionable due to the significant energy loss of the ipsi TMJ source. • In the illustrations of [10], there is no evidence of reverberations. In fact, in [10, Figs. 1, 6, 7], it is suggested that there is only one lag. Furthermore, Guo et al. stated that “When two channels show similar waveforms, with one lagging and attenuated to some degree, it can be concluded that the lagging signal is in fact the propagated version of the other signal” [10, Sec. 1.3]. This statement suggests that Guo et al. believed that the TMJ sound recorded from the contra side constitutes one lagged version of the ipsi TMJ source. In the sequel, we make the reasonable assumption that there is ultimately one “effective” acoustic path from one side of the head to the other side, considering the other possible paths to be negligible. Furthermore, simulation studies verify the validity of our anechoic model. Next, we review some major works that have been undertaken on TMJ signals from a T–F signal processing perspective.
(4)
is a given source signal and is another where source signal. In our work, there are two sources: click, generated from a TMD joint, and a “normal” TMJ sound from that of the free-TMD joint. Gay et al. and Gallo et al. found that most of the energy of a “normal” TMJ sound was centered below 800 Hz [28], [29], while TMD joint sounds exhibited peaks greater than 800 Hz; see, for instance, [28, Fig. 5]. Furthermore, the time for each source to reach its contra side enforces our sparsity assumption. On this basis, we make the reasonable assumption that the TMD source does not overlap the “TMD-free” source in the T–F domain. Furthermore, Yilmaz and Rickard [27] demonstrated the robustness of their DUET technique even when the speech sources satisfy a weakened version of -disjoint orthogonality condition. Due to this sparsity assumption of only interval, we can see a single active/dominant source in a the estimate of the th source is
where the binary mask is defined as C. Time–Frequency Analysis of TMJ Sounds Several T–F analysis methods have already been performed (with TMJ sounds) mainly for classification purposes [11]–[15]. The success of these T-F approaches for the classification of TMJ signals stems mainly from the statistical nonstationary nature of TMJ sounds. Hence, as many researchers argue, T-F approaches enable us to pick up features that are not seen in the waveforms or in conventional power spectra [12], [15], [26]. Many of these approaches have their pros and cons. For example, the reduced interference distribution (RID) of Cohen’s T-F family does not guarantee a nonnegative distribution, while suppressing interference and cross terms [12]. On the other hand, the main appeal of the short-time Fourier transform (STFT) is its simplicity to use, but it does not yield a high T–F resolution. However, the T–F resolution of the STFT can be improved via the evolutionary spectrum proposed by Akan et al. [12]. Throughout this study, the STFT is utilized to perform the T–F analysis of the TMJ sounds due to its simplicity. Nevertheless, we remind the reader that the focus of this manuscript is not to discuss the optimum T-F approach, but to demonstrate that we can exploit the statistical nonstationarity property of the TMJ sources to solve BSS. Hence, DUET which achieves source separation via T-F binary masking, is employed in this study. In the following section, we overview the DUET algorithm and demonstrate how we can accommodate this algorithm in the context of TMJ BSS. D. DUET Algorithm in the Context of TMJ BSS It is noted that this section is based on the materials provided in [7] and [27]. The main assumption used in the DUET approach is that the source signals are -disjoint orthogonal [27]. This concept can be viewed as a form of sparsity, and refers to the situation where at most a single source is active/dominant interval. -disjoint orthogonality over any particular T–F can be described as [27] (3)
if otherwise
(5)
To establish which source is active/dominant within a particular interval or equivalently determination of the binary mask, the following can be performed. In the T–F domain, our mixing model can be expressed as (6) Due to the sparsity assumption, we know that in a particular interval, there is only one active/dominant source. Consider all intervals where only the th source prevails as . If we compute the following ratio: (7) regarding all the ratio is
intervals within
, we can see that this (8)
and . We can utilize this ratio where and , to determine and denote, respectively, the magnitude and the where phase angle. These two features, i.e., and computed over the entire T–F domain can then be used to compute two cluster centers corresponding to two sources. The clustering procedure can be performed by the -means algorithm [30]. Thus, a interval pertaining to a particular active/dominant source is equivalent to its membership to the corresponding cluster center. On this basis, we can determine the binary mask. We now examine a nontrivial constraint imposed by this technique. DUET requires the sensor spacing to be less than the distance , where the TMJ sound travels within one sample, if and denote, respectively, the sampling frequency and the maximum frequency of the source signal. In our work, this
952
IEEE TRANSACTIONS ON BIOMEDICAL ENGINEERING, VOL. 55, NO. 3, MARCH 2008
situation is impossible to implement, as the sensors are placed in the auditory canals. Mathematically, this constraint can be expressed as (9) and is the maximum time lag where determined by the microphone spacing [27]. We can also express (9) as (10) of With reference to the work of Widmalm et al. in [7], the TMJ sounds within the brain was found to be in the range 0.16 ms, asof 0.2–1.2 ms, while 3200 Hz. As 12 kHz, corresponds suming to 2.4–14.4 samples and 1.9 samples. Likewise, the fact that our signal is oversampled by a factor of approximately also explains why the delay between 2, i.e., the microphones should be less than two samples. Therefore, we can see that the constraint of DUET is not fulfilled in our particular TMJ BSS scenario. Because we do not have access to , which depends on the maximum frequency present in the sources, we cannot alter its value. However, we do have which is governed by the “spacing” becontrol over tween the two sensors. Equivalently, the delay introduced by this “spacing” is simply the delay between the two mixtures. This delay can be canceled, if we delay one of the mixtures by . As Widmalm showed in [7], the TMD joint sound propand he considered this contra agates to the contra side in laterally recorded “echo” as the delayed version of the TMD joint sound. Subsequently, only the mixture recorded in the auditory canal of the TMD side will be delayed. The determination of which side of the face corresponds to the TMD joint can be which will achieved by examining the sign of the delay be discussed later. In the following section, we review our fractional delay estimator first proposed in [1] to estimate the delay between the pair of TMJ sound mixtures. E. Fractional Delay Estimator Based on Mutual Information For discrete time signals, whenever we delay a signal by a noninteger delay , we require the computation of the subsample between and , where denotes the floor operation. To approximate this noninteger as [31] delay, we can formulate (11) is the well-known Lagrange interpolation finitewhere impulse response (FIR) filter defined as (12) where either and
when is even, or when is odd, and round
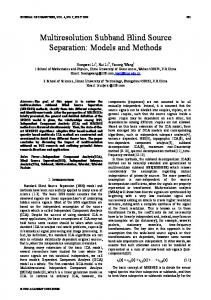
Fig. 1. Performance of the cross-correlation maximization algorithm and that of the mutual information maximization in terms of their absolute error as a function of SNR when D = 0:83.
is the order of the filter, where round denotes rounding to the nearest integer. The maximum-likelihood delay estimator (MLE) derived in [32] leads to a delay estimation of the form (13) corresponds to maximizing where the cross correlation between and . In [1], we proposed to substitute with and maximize the mutual information (MI) between and instead of the cross correlation, i.e., MI (14) We compare the correlation delay estimator method with that of MI in Fig. 1 on the basis of artificially constructed second-order autoregressive-filtered white noise signals (to approximate the TMJ signals) with known intersignal delay. For a fair comparison, the correlation delay estimator was also modified to enwith able estimation of fractional delay by substituting in (13). The absolute error between the delay estimates and the true value was obtained for each signal-to-noise ratio (SNR) value by averaging over 20 independent Monte Carlo simulation runs. Fig. 1 shows that the maximization of the MI algorithm yields a consistently better estimate of the fractional delay. Furthermore, the localization problem of TMJ sources is next addressed. Localization of the Sources: We have to inform the clinician which source corresponds to which TMJ (i.e., left or right). We employ the MI as a measure of similarity between one estimated source and a mixture. For example, is considered to be on the same side as if source MI , otherwise is located MI on the adjacent side. Therefore, this solves our localization problem, because we know in which auditory canal we have or . Now, we are placed our sensor for recording in a position to conclude our overall algorithm given in the following section.
CHEONG TOOK et al.: FRACTIONAL DELAY ESTIMATION FOR BSS AND LOCALIZATION OF TMJ SOUNDS
953
F. Summary of Our Delay Strategy corresponds to 1) First, consider for the moment that the TMD joint side. relative to by utilizing 2) Compute the delay of (14). , then corresponds in fact to the TMD side 3) If , otherwise corresponds to and denote it as . the contra side of the TMD and label it as 4) Delay by . This can be achieved via (11). and to the DUET al5) Input (8) over the entire T–F dogorithm to compute and . From main and cluster these into two classes of this clustering procedure, we can build the binary mask pertaining to the th source. As a result, and will be estimated via (4). and and 6) Estimate the MI between and . MI , then 7) If MI is the estimate of the TMD source and is the estimate of the non-TMD source, and vice versa. III. SIMULATIONS A. Electronic Acquisition of TMJ Sounds One condenser microphone,2 with a frequency band of 40–20 000 Hz, was placed in each auditory canal of a patient with one TMD joint with unilateral clicking. Ear plugs were utilized to hold in place the microphones in the auditory canal as well as to ensure a high SNR [33]. The microphones were connected to an audio console3 whose sampling rate was set to 96 kHz, with a resolution of 24 bits. After the acquisition of the TMJ sounds, these TMJ signals were downsampled to 12 kHz, similar to the sampling frequency used by Sano et al. [22] before our source separation procedure was adopted. The patient considered in this study has clicks on closure of the mandible on the left TMJ. For comparison purposes, the source estimates of Infomax are also included in the simulation studies [10]. In this section, EDUET is used to denote the proposed method, while DUET refers to the original DUET approach. IV. DISCUSSION Fig. 2 shows that our time delay estimator exhibits a maxsamples which corresponds to the delay beimum at tween the two TMJ sounds. This delay is equivalent to 0.86 ms and within the range of 0.2–1.2 ms found by Widmalm et al. [7]. From the topmost plot of Fig. 3, we can see the synchronicity of two TMJ sounds. If we zoom in on the prominent peaks of the TMJ sounds in the lower two plots, it is clear that the right TMJ sound lags the left TMJ sound. This confirms that it is the left TMJ that generates clicks, as expected. On the other hand, the upper two plots of Fig. 4 illustrate the estimated EDUET is evidently the click sources by our approach. The signal sugsource, while the absence of those prominent peaks in gests that it is in fact the sound produced by the healthy/normal 2Sony
ECM 77B, Sony Corporation, Minato, Tokyo, Japan.
3MOTU
Traveler Firewire Audio Interface, MOTU, Cambridge, MA.
Fig. 2. Mutual information between the two mixture signals as a function of the delay D . It has a peak at D = 10:3 which corresponds to the lag between the prominent peaks of the two mixtures. These peaks are highlighted with the aid of arrows in Fig. 2.
joint. In the same figure, both estimates of convolutive Infomax contain components of click as pointed out by the arrows in the lower two plots. The measured MI between the two TMJ mixtures, the Infomax estimates, the DUET estimates, and the EDUET estimates were 0.594, 0.445, 0.0257, and 0.540, respectively. The lower values of mutual information between the pair of Infomax estimates and between the DUET estimates show that Infomax and DUET achieve a better degree of statistical independence between their respective estimates than the EDUET approach. Nevertheless, both Infomax and DUET estimates still contain components of click as shown in Figs. 4 and 5. Now, let us examine the spectrum of the TMJ sound mixtures in the left-hand plot of Fig. 6. Since it is the right TMJ which is “normal,” we expected its spectrum to have a similar shape to that of a “normal” TMJ illustrated in [28, Fig. 5 ] and in the only figure of [29], which is indeed the case. However, note the closeness of the right TMJ spectrum with that of the left TMJ spectrum from the range of about 800 to 1500 Hz. This indicates that our right TMJ spectrum is in fact contaminated with the clicks from the left TMJ. This was evident in the study of Widmalm et al. [6], [7]. Likewise, we compare the spectrum of the estimated sources in the right-hand plot of Fig. 6. As expected, the spectrum of (considered as the healthy TMJ sound) is severely attenuated above 800 Hz which can also be observed in [28, Fig. 5] and in the only figure of [29] for the case of a “normal” TMJ sound. in the proximity of 1 kHz is Similarly, the spectrum of , indicating that corresponds to much higher than the sound generated by the TMD side. The human ear is most sensitive to the frequency range of 1000–3200 Hz. Therefore, considered as the click source, has a Fig. 6 indicates that generated by better audible prominence as compared to the “normal” joint. V. CONCLUSION The delay found in this study is in agreement with the work of Widmalm et al. [7]. We have made the reasonable assumption of an acoustic anechoic model of the human head, based on the arguments in Section II-B. As a second outcome of this
954
IEEE TRANSACTIONS ON BIOMEDICAL ENGINEERING, VOL. 55, NO. 3, MARCH 2008
Fig. 3. Upper plot shows the two TMJ mixtures, one underneath the other one to illustrate their synchronized mechanism. This is clear by the coincidence of the prominent peaks of both TMJ sound mixtures pointed out by the arrows. These peaks are zoomed on in the lower two plots. The time difference between the left and the right TMJ mixtures corresponds to approximately 11 samples, which is in agreement with the peak in Fig. 2.
Fig. 4. Upper two plots show the estimated sources by our proposed approach EDUET. Note the absence of those prominent peaks in s (t), which suggests that it corresponds to noise generated by the healthy joint. The lower two plots illustrate the estimates of convolutive Infomax [10]. The arrows point to the components present in both estimates of Infomax, indicating the presence of clicks in both estimates.
Fig. 5. Estimated sources using DUET algorithm without alignment of the mixtures; the clicks, pointed out by arrows, can be viewed in the estimated s (t) as the normal TMJ sound.
work, we have utilized the estimated delay between the TMJ sounds to overcome the nontrivial constraint of DUET regarding
the microphone separation. This novel extension to DUET allows for an essentially arbitrary spacing of the sensors, which might have other potential applications such as in speech source separation. Furthermore, Yilmaz and Rickard demonstrated that DUET had a reasonable performance in a convolutive scenario where the reverberation was 500 ms and five sources (underdetermined source separation) [27]. In contrast to this scenario, first, it is unlikely that the reverberation within the head is as long as 500 ms; second, we know a priori that there are only two sources (determined source separation). Hence, our scenario is “simpler,” and justifies the use of the DUET in the separation of the TMJ sources. Also, convolutive Infomax achieves a better degree of statistical independence between its estimates than the EDUET approach due to its lower value of mutual information. Nonetheless, Fig. 4 demonstrates that both Infomax estimates share common click components. The similarity between the spectra of “normal” TMJ sound and clicks presented in [28] and [29] and those of the EDUET estimates confirms the successful separation of the TMJ sources. By performing a manual
CHEONG TOOK et al.: FRACTIONAL DELAY ESTIMATION FOR BSS AND LOCALIZATION OF TMJ SOUNDS
Fig. 6. Spectra via the Welch power spectral density method of the TMJ mixtures in the left-hand plot and of the estimated EDUET sources in the right-hand plot. Take notice of the closeness of the two TMJ mixtures spectra for the interval from 800 to 1500 Hz, indicating that the click is present in both TMJ sounds. Also, it is noteworthy to say that the spectrum of s (t) is severely attenuated for frequencies greater than 800 Hz compared with that of s (t), suggesting the successful extraction of the clicks from the right TMJ sound. Note the strong similarity between the spectra of the estimated sources and [28, Fig. 5] where the authors compared the spectrum of a “normal” TMJ sound with that of click sounds.
examination of the TMJ sources and the TMJ sound mixtures, we can localize which TMJ source corresponds to which side. However, if there is a need for a computerized localization, we can employ the mutual information as explained in Section II-F. These separated localized TMJ sounds can be of great clinical value to dental specialists and clinical scientists. Future work will entail application of the proposed method on a much wider database of recordings, but this will be a lengthy process due to clinical and ethical protocols.
REFERENCES [1] C. C. Took, K. Nazarpour, S. Sanei, and J. Chambers, “Blind separation of TMJ sounds by incorporating fractional delay estimation,” in Proc. IMA Int. Conf. Math. Signal Process., Cirencester, Dec. 2006, pp. 18–20. [2] D. M. Watt, “TMJ sounds,” J. Dentistry, vol. 8, pp. 119–127, 1980. [3] W. B. Farrar, “Diagnosis and treatment of painful temporomandibular joints,” J. Prosthet. Dentistry, vol. 20, pp. 345–351, 1968. [4] A. M. Isberg-Holm, “Movement of disc and condyle in temporomandibular joints with and without clicking. A high-speed cinematographic and dissection study on autopsy specimens,” Acta Odontologica Scandinavica, vol. 40, pp. 167–179, 1982. [5] A. Isberg-Holm, S. E. Widmalm, and R. Ivarsson, “Clinical, radiographic, and electromyographic study of patients with internal derangements of the temporomandibular joint,” Amer. J. Orthodont., vol. 88, pp. 453–460, 1985. [6] S. E. Widmalm, W. J. Williams, and K. P. Yang, “False Localization of TMJ sounds to side is an important source of error in TMD diagnosis,” Oral Rehabil., vol. 26, pp. 213–214, 1999. [7] S. E. Widmalm, W. J. Williams, B. K. Ang, and D. C. Mckay, “Localization of TMJ sounds to side,” Oral Rehabil., vol. 29, pp. 911–917, 2002. [8] S. E. Widmalm, W. J. Williams, D. Djurdjanovic, and D. C. McKay, “The frequency range of TMJ sounds,” Oral Rehabil., vol. 30, pp. 335–346, 2003. [9] C. C. Took, S. Sanei, J. Chambers, and S. Dunne, “Underdetermined blind source separation of temporomandibular joint sounds,” IEEE Trans. Biomed. Eng., vol. 53, no. 10, pp. 2123–2126, Oct. 2006.
955
[10] Y. Guo, F. Sattar, and C. Koh, “Blind separation of temporomandibular joint sound signals,” in Proc. IEEE Int. Conf. Acoust. Speech Signal Process., 1999, vol. 2, pp. 1069–1072. [11] D. Djurdjanovic, S. E. Widmalm, and W. J. Williams, “Computerized classification of the temporomandibular joint sounds,” IEEE Trans. Biomed. Eng., vol. 47, no. 8, pp. 977–984, Aug. 2000. [12] A. Akan and R. B. Ünsal, “Time frequency analysis and classification of temporomandibular joint sounds,” J. Franklin Inst., vol. 337, pp. 437–451, Jul. 2000. [13] A. Akan, A. Ergin, M. Yildirim, and E. Öztas, “Analysis of temporomandibular joint sounds in orthodontic,” Comput. Electr. Eng., vol. 32, pp. 312–321, Jul. 2006. [14] K. P. Yang, D. Djurdjanovic, K. H. Koh, W. J. Williams, and S. E. Widmalm, “Automatic classification of the temporomandibular joint sounds using scale and time-shift invariant representation of their timefrequency distributions,” in Proc. IEEE Signal Process. Int. Symp., Jun. 1998, pp. 249–252. [15] Y. Sungyub, J. R. Boston, T. E. Rudy, C. M. Greco, and J. K. Leader, “Time-frequency analysis of temporomandibular joint (TMJ) sounds,” in Proc. IEEE Signal Process. Int. Symp. Time-Frequency Time-Scale Anal., Oct. 1998, pp. 289–292. [16] R. J. M. Gray, S. J. Davies, and A. A. Quayle, Temporomandibular Disorders: A Clinical Approach, 1st ed. London, U.K.: British Dental Association, 1995. [17] H. Koh and P. G. Robinson, “Occlusal adjustment for treating and preventing temporomandibular joint disorders,” Cochrane Database Systematic Rev., vol. 1, 2003, DOI: 10.1002/14651858.CD003812. [18] C. L. Pankhurst, “Controversies in the aetiology of temporomandibular disorders—Part 1: Temporomandibular disorders all in the mind,” Primary Dental Care, vol. 3, pp. 1–6, 1997. [19] S. A. Berman, A. Chaudhary, and J. Appelbaum, “Temporomandibular disorders,” Emedicine Jun. 2006 [Online]. Available: http://www.emedicine.com/neuro/topic366.htm [20] C. S. Greene, N. D. McNeill, C. Clark, and G. T. Truelove, “Temporomandibular disorders and science: A response to the critics,” J. Prosthetic Dentistry, vol. 80, p. 214, 1998. [21] G. A. Toolson and C. Sadowsky, “An evaluation of the relationship between temporomandibular joint sounds and mandibular movements,” J. Craniomandibul. Disorders: Facial Oral Pain, vol. 5, p. 187, 1991. [22] T. Sano, S. E. Widmalm, P. L. Westesson, K. Takahashi, and H. Yoshida, “Amplitude and frequency spectrum of temporomandibular joint sounds from subjects with and without other signs/symptoms of temporomandibualar disorders,” Oral Rehabil., vol. 26, pp. 145–150, 1999. [23] S. Stenfelt and B. Hakansson, “Vibration characteristics of bone conducted sound in vitro,” Acoust. Soc. Amer., vol. 107, pp. 422–431, Jan. 2000. [24] J. K. Leader, J. R. Boston, T. E. Rudy, and C. Greco, “Quantitative description of temporomandibular joint sounds: Defining clicking, popping, egg shell crackling and footsteps on gravel,” J. Rehabil., vol. 28, pp. 466–478, 2001. [25] W. D. O’Brien and Y. Liu, “Evaluation of acoustic propagation paths into the human head,” NATO Res. Technol. Organization: New Directions for Improving Audio Effectiveness, Apr. 2005, pp. 15-1–15-24. [26] C. Zheng, S. E. Widmalm, and W. J. Williams, “New time-frequency analyses of EMG and TMJ sound signals,” in Proc. Annu. Int. Conf. IEEE Engineering in Eng. Med. Biol. Soc., 1989, vol. 2, pp. 741–742. [27] O. Yilmaz and S. Rickard, “Blind separation of speech mixtures via time-frequency masking,” IEEE Trans. Signal Process., vol. 52, no. 7, pp. 1830–1847, Jul. 2004. [28] T. Gay and C. N. Bertolami, “The acoustical characteristics of the normal temporomandibular joint,” J. Dental Res., vol. 67, pp. 56–60, 1988. [29] L. M. Gallo, R. Airoldi, B. Ernst, and S. Palla, “Power spectral analysis of temporomandibular joint sounds in asymptomatic subjects,” J. Dental Res., vol. 72, pp. 871–875, 1993. [30] R. O. Duda, P. E. Hart, and D. G. Stork, Pattern Classification, 2nd ed. New York: Wiley-Interscience, 2000. [31] Z. Cheng and T. T. Tjhung, “A new time delay estimator based on ETDE,” IEEE Trans. Signal Process., vol. 51, no. 7, pp. 1859–1869, Jul. 2003. [32] S. M. Kay, Fundamentals of Statistical Signal Processing- Estimation Theory, ser. Signal Processing Series. Englewood Cliffs, NJ: Prentice-Hall, 1993. [33] S. E. Widmalm, D. Djurdjanovic, and D. C. Mckay, “The dynamic range of TMJ sounds,” Oral Rehabil., vol. 30, pp. 495–500, May 2003.
956
IEEE TRANSACTIONS ON BIOMEDICAL ENGINEERING, VOL. 55, NO. 3, MARCH 2008
Clive Cheong Took (S’06–M’07) was born in the Island of Mauritius in 1982. He received the B.S. degree in telecommunication engineering from King’s College London University, London, U.K., where he was the top departmental graduate in 2004, and the Ph.D. degree in blind signal processing from Cardiff University, Cardiff, U.K. (to which he is still affiliated), in 2007. Currently, he is a Research Associate at the Imperial College London, London, U.K. His research interests include source separation, adaptive and blind signal processing. Dr. Took has served as a Reviewer for journals and conferences such as the IEEE TRANSACTION ON BIOMEDICAL ENGINEERING, and Computational Intelligence and Neuroscience.
Saeid Sanei (M’97–SM’05) received the Ph.D. degree in biomedical signal and image processing from Imperial College of Science, Technology, and Medicine, London, U.K., in 1991. Currently, he is the member of staff at the Centre of Digital Signal Processing, School of Engineering, Cardiff University, Cardiff, U.K. He has been a member of academic staff in Iran, Singapore, and United Kingdom. He is involved in many collaborative researches with medical centers in various aspects of biomedical engineering projects. He has published a book EEG Signal Processing (New York, NY: Wiley, 2007) and over 155 papers in refereed journals and conference proceedings. His major interest is in biomedical signal and image processing, adaptive and nonlinear signal processing, and pattern recognition and classification. Dr. Sanei has been an editor, member of technical committee, and a reviewer for a number of journals and conference proceedings.
Scott Rickard (S’99–M’03–SM’06) received the B.Sc. degree in mathematics in 1992, the B.Sc. degree in computer science and engineering in 1993, and the M. Sc. degree in electrical engineering and computer science, also in 1993, all from the Massachusetts Institute of Technology (MIT), Cambridge, and the M.A. and Ph.D. degrees in applied and computational mathematics from Princeton University, Princeton, NJ, in 2000 and 2003, respectively. From 1991 to 1993, he was a Research Assistant at the Charles Stark Draper Laboratory, MIT. From 1993 to 2003, he was a member of technical staff at Siemens Corporate Research, Princeton, NJ. Currently, he is the Director of the Complex & Adaptive Systems Laboratory and a Senior Lecturer at the School of Electrical, Electronic, and Mechanical Engineering, University College Dublin, Ireland. His research for the past several years has focused on the application of time–frequency methods and sparse signal processing for the blind separation of more sources than sensors. His research interests include time–frequency/scale anal-
ysis applied to signal processing, blind source separation, sparse representations, and Costas arrays. His research is funded in part by Science Foundation Ireland’s President of Ireland Young Researcher Award.
Jonathon Chambers (S’83–M’90–SM’98) was born in Peterborough, U.K., in 1960. He received the B.Sc. (honors) degree from the Polytechnic of Central London, London, U.K., in 1985, and the Ph.D. degree from the University of London, London, U.K., in 1990, after study at Peterhouse, Cambridge University, Cambridge, U.K., and Imperial College London, U.K. From 1979 to 1982, he served in the Royal Navy as an Artificer Apprentice in Action, Data, and Control. He has since held academic and industrial positions at Bath University, Imperial College London, King’s College London, Schlumberger Cambridge Research, Cambridge, and Cardiff University, U.K. In July 2007, he joined the Electrical and Electronic Department, Loughborough University, Leics, U.K., as a Professor of Communications and Signal Processing. He leads a team of researchers involved in the analysis, design, and evaluation of novel algorithms for digital signal processing with application in acoustics, biomedicine, and wireless communications. His research contributions have been in adaptive and blind signal processing. He has authored/coauthored close to 300 conference and journal publications and supervised 20 Ph.D. graduates. Dr. Chambers is a past Chairman of the Institute for Electrical Engineers (IEE) Professional Group E5, Signal Processing. He has served as an Associate Editor for the IEEE SIGNAL PROCESSING LETTERS and the IEEE TRANSACTIONS ON CIRCUITS AND SYSTEMS, and he is currently serving as an Associate Editor for the IEEE TRANSACTIONS ON SIGNAL PROCESSING and is a member of IEEE Technical Committee on Signal Processing and Methods. He received the Robert Mitchell Medal as the top graduate from Polytechnic of Central London.
Stephen Dunne received the Ph.D. degree in restorative dentistry from University of London, London, U.K., in 1989. He holds a fellowship in dental surgery from the Royal College of Surgeons, since 1983. Currently, he is the Head of the Dental Practice and Policy Group, the GKT Dental Institute, Head of Department of Primary Dental Care, GKT Dental Institute, Professor of Primary Dental Care, and the Deputy Director of Master in Clinical Dentistry Degree Course at the GKT and is a Specialist in Restorative Dentistry. He has also been the peer reviewer of papers submitted to national and international scientific journals. His clinical and research interests include adhesive dentistry, occlusion, and clinical aspects of dental materials. Dr. Dunne is a founder member of the Editorial Board of the Journal of Primary Dental Care and a member of the International Association for Dental Research, British Society for Dental Research, Association of Teachers of Conservative Dentistry, Consultants in Restorative Dentistry, and British Society for Restorative Dentistry.