Oct 19, 1979 - band and transform coding are interpreted within this framework. ... design of the coder (particularly the adaptive transform coder) to con-.
512
IEEE TRANSACTIONS ON ACOUSTICS, SPEECH, AND SIGNAL PROCESSING, VOL. ASSP-27, NO. 5, OCTOBER 1979
Frequency Domain Coding of Speech JOSE M.TRIBOLET, MEMBER, IEEE, AND RONALD E. CROCHIERE, SENIOR MEMBER, IEEE
Abstract-Frequencydomaintechniquesfor speechcoding have recentlyreceivedconsiderable attention. The basic concept of these methods is to divide the speech into frequency components by a filter bank (sub-band coding), or by a suitable transform (transform coding), and thenencodethem using adaptive PCM. Three basicfactorsare involved in the design of these coders: 1) the type of the filter bank or transform, 2) the choice of bit allocation and noise shaping properties 3) the control of the step-size of the involved in bit allocation, and encoders. Thispaper reviews the basicaspects of the design of thesethree factorsforsub-band and transformcoders.Concepts of short-time analysis/synthesis are first discussed and used to establish a basic theoretical framework. It is then shown how practical realizations of subband and transform codingare interpretedwithinthisframework. Principles of spectral estimation and models of speech production and perceptionarethen discussedand used to illustratehowthe “side information” can be most efficiently represented and utilized in the design of the coder (particularly the adaptive transform coder) to controlthedynamicbitallocationandquantizer step-sizes. Recentdevelopments and examples of the ‘Vocoder-driven” adaptive transform coder forlow bit-rate applications are then presented.
I. INTRODUCTION EW developments in digital speech communications are evolving at a time when major advances inelectronic device technology promise to make implementation practical. This increased capability and decreased cost of digital hardware is prompting an increased interest in more complex and sophisticated coder algorithms which offer better coding quality at lower bit rates. In order to achieve this improved performance, coding techniquesmustexploit, to a greater degree, information about the mechanisms of speech production and speech perception [44]. Historically, speech coders have been divided into twobroad categories, namely, wavefomz coders and vocoders. Waveform coders generally attemptto reproducethe original speech waveform according to some fidelity criteria whereas vocoders modeltheinput speech according to a speech production model and then resynthesize the speech from the model. Generally, waveform coders have been more successful at producing good quality, robust speech, whereas vocoders are more fragile and are more dependent on the validity of the speech production model. Vocoders, however, are capable of operating at much lower bit rates (2-5 kbits/s).
N
In order to reduce the bit rate of waveform coders, recent efforts have focused on taking greater advantageof speech productionand speech perception models without making the algorithm totallydependenton thesemodels as in vocoders. A general category of coder algorithms which have been relatively successful in achieving this goal is the class of frequency domain coders. In this class of coders the speech signalisdivided into a set of frequencycomponents which are separately encoded. In this way different frequency bands can be preferentially encoded according to perceptual criteria for each band, and quantizing noise can be contained withm bands and prevented from creating harmonic distortions outside of the band. Two basic types of frequency domain coders are considered in this paper, namely, sub-band coders and transform coders. In the first case the speech spectrum is partitioned into a set of, typically, 4-8 contiguous sub-bands by means of a filter bank analysis. In the second case a block by block transform analysis is used to decompose the signal into, typically, 64512 frequencycomponents.Bothtechniques,ineffect,attempt to perform some type of short-timespectral analysis of the input signal although, clearly, the spectral resolution in thetwomethods is different. Since both techniques are closely linked to concepts of short-time analysis, these concepts will first be reviewed inSection 11. Section I11 then focuses on a review of concepts of sub-band coding and discusses how they relate to theshort-time analysis/synthesis model. Section 1V presents a detailed discussionof recent developments and new concepts in “vocoder-driven’’ adaptive transform coding. Finally, Section V briefly points out other coding techniques whichare associated withthe classof frequency domain coders.
11. SHORT-TIME SPECTRAL ANALYSISAND SYNTHESIS FRAMEWORK The basic concept in frequency domain coding is to divide the speech spectrum into frequencybandsorcomponents using either a filter bank or a block transform analysis. After encoding and decoding, these frequency components are used to resynthesize a replica of the inputwaveform by either filter bank summation or inverse transform means. In this section the basic principles behind these analysis and synthesis methods are discussed. The general framework for this study Manuscript received January 8, 1979;revised May 14, 1979. J. M. Tribolet was withthe Acoustics Research Department, Bell is provided by the theory of short-time spectral analysis and Laboratories, Murray Hill, NJ 07974. He is now with Instituto Superior synthesis. Although practical frequency domain coding TLcnico, Lisbon, Portugal. schemes, in an effort to tailor themselves to the peculiarities R. E. Crochiere is with the AcousticsResearch Department, Bell of speech signals, may deviate in one way or another from Laboratories, Murray Hill,NJ 07974. 0096-3518/79/1000-0512$00.75 0 1979 IEEE
TRIBOLET AND CROCHIERE: FREQUENCY CODING DOMAIN
OF SPEECH
suchaframework, it will nonethelessprovideimportant insights into the basic constraints and relationships involved in thesecodingschemes.This general framework isalso invaluable in guiding furtherresearchon new methods of frequency domain coding.
A. The Short-TimeFourier Transform A primary assumption in frequency domain coding is that the signal to be coded is a quasi-stationary (slowly timevarying) signal that can be locally modeled with a short-time spectrum. The objective offrequencydomaincoding is to isolate the perceptually important components of this shorttimespectrumforencoding. Also, for mostapplications involving real-time constraints, onlylimitedtimedelays are allowed in the coder and therefore, only a short-time segment of input signal is available at a given time instant. Within this context a useful definition of a time-dependent short-time Fourier transformis
513
where the sequence f (n) is referred to as the synthesis filter or the synthesis window. By combining ( 1 ) and (4), it can be shown that to synthesizeandreconstruct x ( n ) (i.e., x^@) = x ( n ) for all n ) an additional relationship must be imposed on the choice of theanalysis and synthesis windows, namelythat
5
"=-m
I"
f(-n) h(n) = 2n
F(eiW)H(eiW)dw = 1 .
(5)
-71
As in the analysis, two particularly convenientinterpretations of the short-time Fourier synthesis equation have often been discussed in the literature [ 3 ] . The first interpretation occurs when the synthesis window f ( n ) is chosen to have the form
f ( n > = 6 (n)/h(O), N O ) f 0.
(6)
In this case the synthesis equation (4) becomes
m
Xn(eiw) h
h(n - m ) x ( m ) e - j w m m =-
m
where x ( m ) represents samplesof the input signal and h(n - m ) represents a real "window" which reflects the portion of x ( m ) to be analyzed. This timedependenttransform,known as the short-time Fourier transform [l]-[7],is a function of two variables: the discrete timeindex n , andthecontinuous frequency w. It canbe interpreted in two convenient ways, either in a filter bank analysissense or in ablockFourier transform sense. In the filter bank interpretation w is fixed at w = w o , and Xn(ejwo) is viewed as the output of a linear time-invariantfilterwithimpulse response h(n) excitedby the modulated signal x(n)e-'"o n . That is,
X,(ei"o) = h(n) * [x(n)e-j"o"] where * denotestheconvolutionoperator. Within this context, h(n) determines the bandwidth of the analysis around the center frequency w o of the signal x(n) and it is referred to as the analysis filter, IntheblockFouriertransforminterpretation the time index n is fixed at n = no and xn0 (e'") is viewed as the normal Fourier transform of the windowed sequence h(no - m ) x(m). That is,
X,,, (el") = F{h(no - m ) x ( m ) }
(3)
where F { } denotestheFouriertransform. In thiscontext h(no - m ) determines the time width of the analysis around thetimeinstant n = n o and it is referred to as the anaZysis window. Thesignal x ( n ) canberecovered from its short-time spectrumby means of ageneralsynthesisequationor inverse short-time Fourier transform. The following results are based on the general theoryofshort-time analysis/synthesis developed by Portnoff [ l ]. The general synthesis equation has the form
which can be interpreted as the integral (or incremental sum) of short-time spectral components Xn(ejwo") modulated back to their center frequencies w o . This equation corresponds to a filter bank interpretation of the short-time synthesis. The second interpretation occurs when the synthesis window is chosen to have the form
f ( n ) = l / H ( e j O ) for all n .
(8)
In this case the general synthesis equation (4) becomes
and it canbe interpreted as summing inverse Fouriertransformed blocks correspondingto the time signals h(r - n ) x @ ) . As can be seen, there is a direct correspondence between the first interpretations (the filter bank) of the analysis and synthesis methods. Similarly, there is adirectcorrespondence between the second interpretations (the block-transformation) of the analysis andsynthesismethods.Itshouldbe noted, however, that these are not the only possible interpretations of short-time spectral analysis andsynthesis El]. Ingeneral the synthesis window f ( n ) is instrumental in exploiting, to a greater or lesser degree, the local correlation of the values of X,(ei") in time n . The two casesdiscussedabove simply correspond to the two extremes of either not exploiting this time correlation at all or exploiting it by giving equal weight to each time instant. B. The Discrete Short-Time Fourier Transform An important consideration in the implementation of systems for short-timespectral analysis and synthesis is the choice of sampling rates at which X,(ei") is sampled in both the timeandfrequencydomains. Of special interest t o our discussion of frequency domain waveform coding is the problem offormulating this short-time spectral representationwith littleornoredundancy, where no redundancyimplies that
IEEE TRANSACTIONS ON ACOUSTICS, SPEECH,
5 14
AND SIGNAL PROCESSING, VOL. ASSP-27, NO.
thereis, on the average, onlyone sample of the transform representation for eachsample of the original signal. This problem can be formulatedinterms of the discrete short-time Fouriertransform. If Xn(eiw) is uniformly sampled every R samples intime and every 2nfM radiansin frequency thenthe discrete short-timeFouriertransform, sampled every R samples in time, is defined as
X , ( k ) & X,= m =-
0
(ei(2 n k / M ) ) h(sR - m) x(m) e-j(2nkm/M).
=
0
5, OCTOBER 1979
(1 0)
m
Similarly, the general synthesis formula has the form ZT/M (C)
As in the case of the short-time Fourier transform, two particularly convenient interpretations can be given to the above analysis/synthesis equations, namely, the filter bank and the block transform interpretations. These interpretations will be explored in greater detail in the next sections. Also, as in the short-timeFouriertransform, the exactreconstructionof x(n) [i.e., ?(n) = x(n)] implies that the relationship
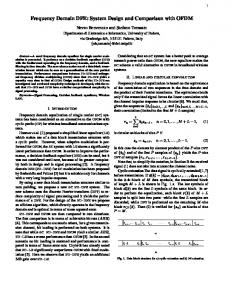
Fig. 1. Filter bank interpretation of short-time analysis/synthesis.
(pitch striations) in the voiced speech spectrum, and the subband coder can be classified as a wide-band analysis/synthesis system. The analysis and synthesis filters h(n) and f ( n ) in sub-band coders aregenerallydesigned to be sharpcutoff low-pass filters with cutoff frequencies of +2n/2M. In this way subbands are isolated as much as possible, avoiding “leakage” of f ( n - s R ) h ( p M - ( n - s R ) ) = a ( p ) , forall n , signal energy fromoneband to another (some amount of s=- m (12) “leakage” may be allowed in quadrature mirror filter bands as willbeseen later). As a consequence, X,(eiWk) is a lowmustexistbetweenthe analysis and synthesis filters. This pass representationof x(n) inthe sub-band { o k - 2n/2M, canalso beinterpretedinterms of frequencydomain con- wk + 2n/2M}and it contains relatively littlefrequency straints [ l ] . domain aliasing from adjacent sub-bands. The representation of x ( n ) ,without redundancy, in termsof its sampled short-timetransform X,(k) occurs when the D. Narrow-BandAnalysisjSynthesis: decimation period in time R is equal to the number of fre- The Transform Coding Framework quency samplesM. A framework for studying transform coding systems can be conveniently represented bythe block-transforminterpretaC. Wide-Band AnalysisfSynthesis: tion of short-time Fourier analysis/synthesis. This framework The Sub-Band Coding Framework is depictedin Fig. 2. The input signalisdivided into time A framework for studying sub-band coding systems can be segments which are windowed by the analysis window h(n). most conveniently represented by the filter bank interpreta- Each windowed time segment is transformed to thefrequency tion of short-time analysis/synthesis. This interpretation, domain by means of an M point discrete Fourier transform depicted in Fig. 1, isseen to be that of an M channel filter to producethe sampled short-timespectrum X,@). Synbank. Analysis consists of modulatingthecenterfrequency thesis isachieved by inverse discrete Fourier transforming of each frequencyband to dc, low-pass filtering with h(n), each sampled short-timespectrum to obtain its (short-time) and compressing by a factor of R : 1 [as defined in Fig. l(a)] . timedomainrepresentation $,(YE). The synthesis window Synthesis consists of expanding [seeFig. l(b)] the sub-band f ( n ) then interpolates across the overlapping short-time signals signal (by filling in with zeros) by a factor of 1 : R , filtering x^a(n) to reconstructthetime signal $(n) according to the (interpolating) with f (n), andmodulating the band center relation frequency back to its original location. The sub-band signals are then summed to give the output. Although the sub-band x^(n)= f(n - sR) $,(n) (1 3) coder is rarely implementedinthisparticularmanner, this s=- m framework serves as a useful conceptualmodelfor relating various methods of practical implementation, as will be seen where x^ ( n ) = x(n) if the condition in equation (12) is satisfied. Note that, in general, there is no constraint on thewidth later. of the synthesis window, i.e., the duration of f ( n ) can in fact Typically, sub-band coders have about 4 to 8 “real” subbe greater than the transform size M . In this case the inverse bands or, equivalently, 8 to 16 “complex” bands (M = 8 or transformed short-time signals jZsR(n) must be interpreted as 16 according to the frameworkin Fig. 1) [8] -[ 101 . The being periodic in time n with periodM. bandwidths, therefore, are wide relative to the fine structure
5
Ca
TRIBOLET AND CROCHIERE: FREQUENCY DOMAIN CODING OF SPEECH
Fig. 2. Block transform interpretation of short-time analysis/synthesis.
In practice, transforms otherthantheDFT may be employed in transformcoding [l 11 . Of particular interest in this paper, however,are those transforms whichhave a specific interpretation in termsofthefrequencydomain.Forthis class of transforms, this short-time Fourier analysis/synthesis framework will be useful as a conceptual model,as will be seen later. Typically, the number of frequency channels used in transform coding is much higher than in sub-band coding in order to capitalize on the spectral details (pitch structure) of the speech signal,aswellas the general spectral shape (formant structure). Transform sizes on the order of M = 64 to 512 have been found to be useful. Thus, transform coding can be classifiedas anarrow-band analysis/synthesis system. The tradeoff,ofcourse, is thatthe frequencychannels are no longer associated with nonoverlapping frequency bands. Generally,there is a larger amountof“leakage”of signal energy from one bandto another. E. Time and Frequency Aliasing inAnalysislSynthesis The presence of leakage between frequency bands can affect the performance of a frequency domain coder in two ways. First, if a particular frequency band is low in energy compared to otherbands,theenergy‘leaked”fromthe other bands can represent a significant portion of the energy in that band. This leakage can interfere with the ability of the coder to take full advantage of the true spectrum of the signal in that band. Secondly, after encoding of the bands, the leakage, oraliasing, from one band to another is not entirely canceled in the synthesis. Therefore, interband leakage in the analysis stage of a frequencydomaincoder can lead to undesirable effects of frequency domain aliasing in the synthesis stage. The effects of leakage in frequency bands can be reduced by using analysis and synthesis filters which have lower stopband sidelobes andsharper transition bandsthan that obtainable with M point filters. This impliesthat their impulse responses,
515
i.e., the analysis andsynthesiswindows,must be longer in time. However, if they are longer than the transform size M then the analysis and synthesis time slots overlap in time and aliasing can potentially occur in the time domain as discussed earlier in the block transform interpretation of analysis/synthesis. This time domain aliasing, if it is excessive, can lead to an undesirablereverberantquality inthecoder.Thus, in practice, tradeoffs canbe madebetween aliasing effects in time and frequency by changing the size of the analysis and synthesis windows. As noted earlier, sub-band coding can be characterized as a wideband analysislsynthesis system with sharp cutoff filters to avoid frequency domain aliasing. Therefore, the length of the analysis w i n b w in sub-band coding is much longer than its effective transform size. As aresult,sub-bandcoding represents an example where the predominant form of aliasing, due to quantizationofthe spectral samples X,(k), is that of time domain aliasing (no aliasing occurs if X,@) is not quantized). Alternatively, transform coding represents the opposite extreme. That is, it is based on a narrow-band analysis with considerableoverlapofthe analysis filters in thefrequency domain. Therefore, the predominant form of aliasing in transformcoding,due to quantizationofthe spectral samples X,@), is that offrequencydomain aliasing. Again,this aliasing does not occur if the spectral samples X,@) are not quantized. The effects of frequency domain aliasing generally become more pronounced as the dynamic range of the spectrum of the signal being analyzed becomes large. As noted above, one way of controlling this aliasingis byincreasingthe size ofthe analysis window(andtrading it for timedomain aliasing). Anothermeans for controlling frequencydomain aliasingis by reducingthe dynamic range of the spectrum by preemphasis or spectral flattening prior to the analysis/synthesis. In this way the leakage from large energy bands to low energy bands is reduced.Bothfixedanddynamicformsofpreemphasis have been widelyusedin various types of analysislsynthesis speech processing systems for this reason [ 121 , [13] . Fixed preemphasis isgenerally implemented as a first-order difference filter with an impulse response W ( z ) = 1 - c11z-l where CY is on the order of 0.9 for an 8 kHz sampling rate. Dynamic preemphasis is generally accomplished by performing a linear predictive coding analysis on the input signal and then filtering the input signal with the adaptive inverse filter to obtain a spectrally flattened output [ 121 .
F.Discussion In this section wehave briefly reviewed the analysis and synthesis operations involved in sub-band and transform coding and have shown how they can be explained in terms of the unifying framework of short-time spectral analysis/synthesis. These two systems basically differ in the sense that sub-band coders are generallyimplemented in termsof filter banks whereas transform coders are generally implemented in terms of block transforms. We wish to point out, however, that when equally spaced frequencybands are considered,eachsystemorinterpreta-
516 IEEE TRANSACTIONS
ON ACOUSTICS, SPEECH, AND
SIGNAL PROCESSING, VOL. ASSP-21, NO. 5, OCTOBER 1919
tion is potentially capable of duplicating the other. In this case, either interpretation can be used in describing sub-band and transform coders. Some difficulties arise, however, when unequally spaced bands are used as, for example, in the subband coder. 111. SUB-BANDCODING Sub-band coding has been shown to be an efficient way to exploit the short-time correlations due to the formant structure in speech [8] -[lo], [14]. By encoding in sub-bands and allowing the quantizer step sizes in each band to vary independently, the equivalent of ashort-timeprediction can be achieved. Although thisprediction is onlyobtainedin a coarse, piece-wise manner in frequency, it can match the performance of adaptive time domain coding methods with fully adaptive short-timepredictors [14].In very recent work Crochiere and Barabell [42], [43] have demonstrated that pitch structure can also be exploited in sub-band coding. In this section we examine in greater detail the basic principles of the sub-band coder and show how they relate to the filter bank model of wide-band analysis/synthesis. We then review how these techniques can beused for efficient encoding of speech.
A. Filter Bank Implementations Although the analysislsynthesis filter bank model of Fig. 1 is generally not applied directly in the implementation of subband coding, it is closely linked to the interpretation of practical implementations. In practice, sub-bands are generally implemented as a low-pass translation of a frequency band to dc in a manner similar to that of single-side-bandmodulation. In this way the sub-band signals are real signals as opposed to complex signals as in Fig. 1. Fig. 3illustrates the basic frequency domain relationship between these sub-band signals and those in Fig. 1 [8] . The sub-bands with center frequencies at -wk and wk and bandwidths B are illustrated in Fig. 3(a). According to Fig. 1, these bands are modulated by the respective signals e j w k n and e - i w k n and low-pass filtered with h(n) to give the resulting complex sub-band signals
xn(e ' j W k ) = flk(n) =
{x@) cos wkn} * h(n) (14)
where the "t" sign (on the right side of the equation) is associated with the band centered at -wk and the "-" sign is associated withthe band centeredat +wk. The spectra of these subband signals are illustrated in Fig. 3(b) and are representative of the sub-band signals in Fig. 1. Fig. 3(c) illustrates a second stage of modulation with the respective signals and eiBnl2 which effectively aligns the upper edgeof theband associated with -wk with dc and the lower edge of the band associated with +wk withdc. Summing these two signals then gives the red signal yk(n) as illustrated in Fig. 3(d). This signal can be expressed in the form
yk(n) = 2fZk(n)COS (Bn/2)t 2bk(n) Sin (Bn/2)
Yk(e'w)
I*[
-B
B
0
Fig. 3. Frequency domainrelationship between sub-band signals aAd complex filter bank signals.
COS,wkn
1
/ rcos*s/2
COS#TS/2
sin hkn
sinwkn
-I-'FILTER BANK ANALYSIS
sin wkn
cos,wkn
I
I
SUB-BANDCODER
I
FILTER BANK
I
Fig. 4. (a) Block diagram of signal processing operations for sub-band signals. (b) A simplified interpretation showing relationship between Y k ( n )and filter bank outputs.
'jbk(n)
k j{x(n) sin wkn} * h(n)
(4
B
0
-6
(15)
and it is representative of the actual sub-band signal which is generally encoded in sub-band coding. Fig. 4(a) illustrates this relationship of yk(n) to x,(eiwk) in terms of a block diagram of signal processing operations. If thebandwidth of X,(eiwk) is B / 2 radians as illustrated in Fig. 3(b), then the maximum decimation rate of X,(eiwk) is R' where R'
= 2 n/B.
(1 6 )
However, since y ( n ) has a bandwidth of B , as seen in Fig. 3(d), the maximum decimation period of yk(n) is R" = R ' / 2
(1 7)
and therefore, this decimation period also is used for X,(eiwk). At this sampling interval, sR", it can be noted that
TRIBOLET AND CROCHIERE: FREQUENCY DOMAIN CODING OF SPEECH
and
517
K=O
K=t
Thus, every other sample of the sequences ak(sR"/2) and bk(sRt'/2)is multiplied by zero and the remaining samples are only changed in their sign. This suggests the interpretation in Fig. 5. (a) Integer band sampling. (b) A spectral interpretation. Fig. 4(b) in which the output of the filter bank analysis is decimated by a factor of R = R' and modulated by (- 1)'. The sub-band signal y k ( n ) then corresponds tothe sequence of interleaved samples of the real and imaginary terms of X,(eiwk), i.e., the outputs of the filter bank model of Fig. 1, with appropriate sign modifications. Although the block diagram of Fig. 4(b) illustrates a convenient interpretation of how the real output of a sub-band filter for sub-band coding relates to the complex output of an analysis/synthesis filter as in Fig. 1 , it does not necessarily suggest the most convenient implementation. In practice, two other methods of implementation are often used. They are the integer-band sampling method (some times referred to as bandpass sampling) [8], [9] and the quadrature mirror filter method [ l o ], [43] . The integer-band sampling method is illustrated in Fig. 5(a). The speech band is filtered by a bandpass filter and the output of the filter is directly decimated by the factor R". The subbands in thisimplementation are constrained to have lower Fig. 6. (a) Quadrature mirror fiiter bank. (b) A spectral intepretation. and upper cutoff frequencies of Krr/R' and (K t l)rr/R' where K is an integer associated with the band of interest [see Fig. a high-pass analysis filter &(n) for band 2 can be defined as 5(b)]. The process of decimation by R" then aliases this band K2 (n)= (- l)"h(n) to dc. Similarly, the process of interpolation selects the appropriate Kth "harmonic" of the base band (K = 0), thus, n=0,1,2,..effectively bandpass translating it back to its initial frequency. This process of bandpass decimation and interpolation is and a high-pass synthesis filter T2(n) = -L2(n), n = 0, 1,2, . * illustrated inFig. 5(b) for the caseof K = 2. An attractive can be defined which is the negative of the analysis filter. This advantage of the integer-band sampling approach is that it interpretation has a form similar to the integer-band sampling eliminates the use of modulators and replaces them with band- implementation. In order to avoidgaps between thebands, the additional requirement that pass filters. Therefore, it is efficient in terms of hardware. The quadrature mirror approach can be developed from a 1 = Iiil(e'")12 t lii2(ei")12 two-bandfilterbank as shown in Fig.6(a). This circuit can = I ~ ( ~ i12 u + 1 )H(ei(w+n)) I 2 (22) have twointerpretations. The first interpretation is related to that of a two-band version of the analysis/synthesis filter mustbe made in the design of the quadraturemirrorfilter bank in Fig. 1 with the exception that the synthesis filters are bank [lo]. not identical from band to band. That is, the synthesis filter A careful analysis of the quadrature filter bank reveals that, for the second band f 2 ( n ) is the negative of that in the first as in the short-time analysis/synthesis formulation of Fig. 1 , band, i.e., the frequency domain aliasing terms,i.e., the leakage [illustrated by the shaded region in Fig. 6(b)] , cancels down to the level of the quantizing noise in the APCM coders [ 101 . Therefore, the quadrature mirror filter can be used to trade time where h(n) is assumed to be an evenorder filter [lo] . In domain and frequency domain aliasing effects by adjusting contrast, the analysis/synthesis formulation in Fig. 1 is based the size of the filter h(n) in a manner similar to the analysis/ on odd order filters. synthesis structure of Fig. 1. The second interpretation of the quadrature mirror filter The quadrature mirror filter bank can be extended to more bank can be obtained by combining the (- 1)" modulators with bands by further subdividing each of the two sub-band outthe analysis and synthesis filters in the second band. Thus, puts with quadrature mirror filters giving a four-band design.
518
IEEE TRANSACTIONS ON ACOUSTICS, SPEECH, AND SIGNAL PROCESSING, VOL. ASSP-27, NO. 5, OCTOBER 19’79 BAND 2
BAND1 I
ld4J,
s:~!&~~s!
1
I
BPINb2, BAND
, ,
BAND 3
3 ’ ‘I
1
I
BAND
BAND 4
I
’
BAND
LOW BIT RATES
1
‘HIGHER BIT
RATES
I 4 BIT
\i/
16 KB/S
f
7.2 K
01
I
203
I
I
430
330
B
I
560
C
I
I
I
(r
z
1
2 BIT
I
14/2 BIT 1 1/3 BIT 1 1/4 BIT
u)
n 0
.
A
3 BIT
I
I
I
*
I
700 1 1000 I 1310 I 1660 I 2020 I 2503 13200 840 1150 i480 1830 2240 2820
FREQUENCY (HZ)(CONSTANT A I SCALE)
Fig. 7. Choice of sub-bands andbit allocations for sub-bandcoders with fixed bit allocation.
T h s “tree structure” canbe extended as often as desired to give any number of sub-bands [lo].
B. Choice of Sub-Bands in Sub-Band Coding By dividing the speech band into sub-bands and adaptively encoding each band, sub-band coding is able to take advantage of the “nonflatness” of the speech spectrum due to the formant structure. Since thebandwidth of theformants in speech are typically much narrower (higher (2) at low frequencies than at high frequencies it can be expected that for best performance the sub-bands should have narrower bandwidths at low frequencies and broaderbandwidths at high frequencies. An approximate rule of thumb is to choose the bandwidths such that they correspond to significant contributions tothe so-called articulationindex [ 8 ] . Two possible choices for sub-bands are illustrated above Fig. 7 where the frequency scale is nonlinearly warped according to a constant articulation index scale.
C. Bit Allocation and Noise Shaping The shape of the quantizing noise in frequency can be controlled by the choice of the number of bits/sample used to encodeeachsub-band. This choice canbe made ona fixed basis according to static (long time)perceptual criteria for each sub-band. Alternatively, it can bevaried dynamically according to the statistics of the short-time speech spectrum. Although either fixed or dynamic bit allocation can be used in sub-band coding, we will defer the discussion of dynamic bit allocation until the next section on adaptive transform coding. Typical values of fixed bit allocations for sub-band coders are illustrated in Fig. 7. As seen fromthis figure, about 12 dB (2 bits) more accuracy is reserved for the lower frequency bands where pitch and formant structure must be more accurately preserved. In upper bands where fricatives and noiselike sounds occur in speech, fewer bits/sample can beused since quantizing noise can be more effectively masked by these sounds.
D. Step-Size Adaptation The step-sizes of the AF’CM (adaptive PCM) quantizers are dynamically adjusted to adapt to thespeech amplitude in each sub-band. Since thisadaptation is performed independently in each band, bands with lower signal energy will have smaller step-sizes and contribute less quantizing noise. Sub-bands with larger signal energy will have larger step-sizes and, therefore, more quantizing noise. This noise, however, will be masked by the larger signal in that band. The step-size adaptation can be controlled either by a self adapting APCM quantizer or by estimating and transmitting the step-size as additional “side information.” The first technique is useful when a fixed bit allocation is used in the coder whereas the second method may be required when a dynamic bit allocation is used. The second method will be described in more detail in the next section on transform coding. The self adapting step-size for the APCM coders canbe based on the one-word memory approach proposed by Jayant, Flanagan, and Cummiskey [ 151 , [ 161 . The quantizer stepsize A(n) is computed according to the relation A ( n ) = A ( n- l).M(L,-l)
(23)
where A(n - 1) is the step-size at time n - 1. M(L, - 1) is a multiplication factor whose valueis greater than 1 if an upper quantizer magnitude level L n - l was used at time n - 1 and less than 1 if a lower quantizer magnitude level was used. In this way the quantizer continuously adapts its step-size in an attemptto tracktheshort-time amplitude levelof the speech signal. Other modifications to this algorithm permit improved idle channel performance [17] and robustness to channel errors [ 181 . E. Discussion In this section we have attempted to review the basic concepts of sub-band coding and to show how it can be used to take advantage of the formant structure in speech, as well as controlling the shape of the quantizing noise infrequency.
TRIBOLET AND CROCHIERE: FREQUENCY DOMAIN CODING OF SPEECH
The relationship of the sub-band partitioning and wide-band analysis/synthesis has also been discussed. Since sub-bandcodingtechniques have beenexamined in considerable detail in recent literature, specific examplesof sub-band coderdesigns willnot be presented here. IV. ADAPTIVETRANSFORM CODING In Section 11-D it was pointed out that adaptive transform coding can be analyzed in terms of the block transform interpretation of short-time analysislsynthesis. In this section we will examine the principles of transform coding in more detail and show how they relate to this interpretation, We will then report on recent advances in adaptivetransformcoding,includingthe new vocoder-drivenadaptation strategy [ 191 . Finally we will present examples of transform coder designs for low bit rate speech communications.
519
COMPUTE
a
INFORMATION
INFORMATION xSR[k)-
IBITASSIGNMNTI
-. .
A . Basic Description of Transfom Coding a Fig. 8 illustrates a basic block diagram of an adaptive transSIM form coder algorithm as proposed by Zelinski and No11 [ 111 , INFORMATION [40] . The input speech is buffered into short-time blocks of Fig. 8. Block diagram of adaptive transform coder. data x a ( n ) (as defined in Section 11) and transformed. The transformed coefficients, or frequency components, are then adaptivelyquantizedandtransmitted to the receiver(as in and this nonstationarity must be properly dealt with. In fact, it has been demonstrated by Zelinski and No11 that transform sub-bandcoding).Atthe receiver they are decodedandinverse transformed into blocks 2sR(n). These blocks are then coding based on long-term characteristics of speech leads to unsatisfactory performance at low bit rates [ 1I ] . used to synthesizethe output speech signal i?(n) by a conTo copewith thenonstationarityof speech the step-size catenation of the blocks A,(k) in block SR and the number of bits b,(k) for encodm ing each transform coefficient k are adaptively changed from 2(n) = 2,(n). block to block. The choice of A,@) and bsR ( k ) is made on the basis of knowledge of the spectral shape of the speech for Fromthe discussion ofshort-time analysis/synthesis in that block. In sub-band coding it has been seen, in Section Section 11, it canbeseen thatthe above procedure canbe 111-D, that this knowledge can be acquired by means of a selfinterpreted as that of a short-time analysis/synthesis in which adapting step-size algorithmwhichcontinuallyupdatesits the analysis filter h(n) is chosen to be a rectangular window step-size fromsample to sample.Intransformcoding,howof size M (the transform size) and the decimation period R is ever, the sampling interval of the coefficients (every R samalso chosen to be R = M . The synthesis filter f (n) isf(n) = 1 ples) occurs on the order of only once every 16-32 ms which for all n [in accordancewith(12)] where the block signals is not sufficient for the self-adapting algorithm. Consequently, 2sR(n) are interpreted as being of finite durationM (samples). theshapeandamplitude of thespeechspectrumforeach In the absence of quantization,theoutput signal 2 ( n ) is block is parameterized,encoded,andtransmitted as side identical to the inputx(n). information, asseen in Fig. 8. This side information isused Although the above analysis/synthesis procedurehasbeen in both the transmitter and receiver for step-size adaptation widelyusedin transformcoding [ l l ] , [20] , [21] it is not As&) and bit allocation bsR(k). clear that it is the most satisfactory for low bit-rate speech Four major signalprocessing operations must therefore be coding. More generally, other analysis and synthesis windows considered in adaptive transform coding, Theyare the analysis/ may be used which lead to better subjective performance at synthesisoperationsandthechoiceofthetransform,the low bit rates. In Section IV-B we consider this issue and issues spectral parameterization operations, the step-size adaptation concerning the choiceof transforms in more detail. andbit allocation (noise shaping)and thequantizationand The quantization of the transformed coefficients is assumed multiplexing of the,signals. In the next sections we will conto be made with uniform quantizers. The choice of the step- sider each of these operationsin greater detail. size and the number of bits used for encoding each coefficient is of fundamental importance in transform coding. In the case B. Frequency Domain Transformsand AnalysisfSynthesis of stationary inputs, given the input statistics, it is possible to In principle, any type of transform can be used in the design these quantizers, a priori, to meet prescribed specifica- configuration of Fig. 8. For speech coding,however,there tions for the distribution andminimization of noise in the are a number of reasons for restricting this transform to the frequency domain. Speech, however, is a nonstationary signal classof “frequencydomain”transforms.First,withinthe
IEEE TRANSACTIONS ON ACOUSTICS, SPEECH, AND SIGNAL PROCESSING, VOL. ASSP-27,
520
speech coding context the goal is to generate the least audible noise possible. Since it is known that the ear makes a shorttime frequency analysis of signals [41] ,it is natural to control the audibility of the quantization by controlling its characteristics in the frequency domain. Secondly, the speech production mechanism can be approximatelymodeled, on a shorttime basis, in terms oflinear time-invariant filtering operations. These operations are fairly well understoodand provide enormous insight into frequency domain dynamics of speech, thus facilitating the task of adapting the transform coder to the time-varying properties of the speech signal. Finally, from a purely mathematical point of view, on the basis of a mean-square error criterion, it can be shown that the class of frequency domain transforms asymptotically approach the theoreticallyoptimumperformance of theKarhunenLoeve transforms, in terms of their orthogonalizing properties, for largesize transforms [l 11 , [20] -[24] . This theoretical performance can be shown to be related to the ratio of the arithmetic to geometric means of the varianceof the shorttime speech spectrum [l 13 , [20] , [23] . Although the meansquare error criterion is not necessarily the most appropriate criterion in terms of speech perception, it is satisfying to note that these results are in general agreement with the above physical arguments for using frequency domain transforms. Zelinski and No11 have examined, in great detail, the properties of a number of transforms for speech coding purposes, including two frequencydomaintransforms,the discrete Fouriertransform (DFT) andthe discrete cosine transform (DCT) [4] . Their results experimentally verify the asymptotic optimality of the frequency domain transforms. Furthermore, they have demonstrated that for speech signals the DCTis nearly optimal in terms of itsperformancecomparedwith the Karhunen-Loeve transform (a result also found in image coding [24]). In comparison to the DFT, they found that the DCT has about 4-5 dBbetter S/N performance,formany speech sounds,withtransform sizesof M = 128 (although both transforms are asymptoticallyoptimal as M becomes verylarge). Since the Karhunen-Loeve transform is a datadependent transform and the DCT isa fixed transform, the DCT is generally preferable in terms of a practical implementation. Formally, the DCT of a real M point sequence u(n) can be defined as M-1
Vc(k)= n=O
k=0,1,2;..,M-
1
(25)
where
Similarly, the inverse DCT can be defined as 1
M-I
u(n) = -
Vc(k)c ( k ) cos [(2n
+ l)nk/2M] (27)
It can be seen from (25) that the DCT coefficients Vc(k)are
-
/
Fig. 9. (a) One block of data u(n). (b) Illustration of end effects for DFT analysis/synthesis. (c) Equivalent 2Mpoint data blocky(n) for DCT analysis. (d)Illustration of end effects for DCT analysis/ synthesis.
real numbers for real u(n) and they correspond, respectively, to the M frequencies cdk = 27-rk/2M, k = 0 , 1 , . * . , M - 1, which are equally spaced around the upper half of the unit circle. The near optimal performance of the DCT has been attributed in recent literature to the fact that the basis vectors of the DCTclosely approximate the eigenvectors of a class of Toeplitz matrices [24]. In this paper, however, in an effort to relate the DCT to concepts of short-time analysis/synthesis, wewill presentanadditionalreason, based on digitalsignal processing concepts, as to why the DCT is preferable. Consider first a short-time analysis/synthesis based onthe DFT. Let v(n) n = 0, 1, . . . , A 4 - 1 be one block of data of length M as depicted in Fig. 9(a) and V ( k )k = 0,1, * * ,M - 1 be its transform. If V ( k ) is quantized with a relativelylarge number of bits for each coefficient, then the quantizing noise c,an be modeled as an additive noise and the quantized version V ( k )can be represented as ?(k) = V ( k )+ E,(k)
(28)
inverse where E,(k) representsthe noise component.The transformation, in the synthesis, leads to the signal u(n) + e,(n), which is simply the originalsignal plus an additive noise in time. If, however, the total number of bits used to encode V ( k ) isvery low, as in low bit-rate coding, then the quantizing noise is a combination of both multiplicative and additive effects, i.e., (29)
[where E,@) is no longer the same as in (28)] . In fact, some values of V ( k ) may not be encoded at all in which case V ( k )= 0 for those coefficients. For example, if the high-frequency DFT components havevery low energy, as in typical voiced regions, the entire upper frequency range may not be encoded, leading to a low-pass effect.The synthesis procedurethen leads to theresult = u(n) 63gLJ(n>+ e,(n>
k=O
n = O 7 1 , 2 ; . * , M - 1.
-IC-
f ( k ) = G,(k) V ( k )+ E,(k)
u(n) c ( k ) cos [(2n + l).rrk/2M]
NO. 5, OCTOBER 1979
(30 )
where g,(n) is the inverse transform of G,(k) and 63 denotes the circular convolutionof u(n) with gu(n). This circular convolution results in an exchange of energy between the left and right boundaries of u(n) (Le., aliasing in time), asillustrated by the arrows in Fig. 9(b). These end effects can lead
FREQUENCY CROCHIERE: AND TRIBOLET
DOMAIN CODING OF SPEECH
to very undesirable “click” and “burbling” noises at the block rate in transform coding. A well-known solution to the abovealiasing problem is to pad u(n) with zeros (equal to the number of samples ofg,(n) minus 1) and use a larger transform. Unfortunately, for transformcoding, g,(n) and e,@) are not well-definedtimelimitedquantities,and increasing thetransform size to be larger than the block size only reduces the average number of bits/sampleacrosstheblockwhichfurthercompoundsthe problem. TheDCT(and anumberof closely related transforms) reduces the above end-effect problems between the left and right boundaries while still keepingaminimum spectral redundancy (i.e., M transform coefficients for M data points). As pointed out by Chen and Fralick [25], the DCT is closely related to the 2M point DFT of a sequence y ( n ) , which is formed from theM point sequence u(n),by defining
y ( n )=
{3
u(n)
3u(2M- 1 - n )
n=O,l;**,M-1 n=M,M+1;*.,2M- 1
The sequence y ( n ) is depicted by the shaded 9(c). The 2M point DFT ofy (n) leads to
region in Fig.
n=o
521 OVERLAP
OVERW
M /----
/
--
BLOCK
-‘ ’--\ /
M -1
0
L-----zow
-4
”-
Fig. 10. Trapezoidal windowfor DCT analysis/synthesis.
u(n). Thus,the DCT produces less noticeableboundary effects than the DFT in transform coding applications, a result which is ingood agreementwithobservationsfound in the literature [ 1I ] , [24] , [26] . This isan additional advantage of the DCT besides the fact that it is “close” in performance to the Karhumen-Loeve transform. The choiceofan analysis window h(n) in the analysis/ synthesis involving the DCTcan beinstrumental in further reducingtheboundaryeffects. Fig. 10 illustrates a class of trapezoidal windows that have been found to be very useful forlowbit-ratecoding. By allowing a small (10 percentor less) overlapbetween the successive blocks being coded,a significant reduction of end-effect noise can be achieved without significantly loweringthenumber of bits available for encodingeachblock. Clearly, if the number of bits is sufficiently reduced,the overall increase in quantization noise can offset whatever noise reduction isachieved by the overlapping process.
C. A Spectral Interpretation of the DCT An alternate way of expressing an M point DCT in terms of n=o a 2M point DFT was initially proposed by Ahmed and Rao [24]. Using this interpretation and the concepts of short-time By comparison of (33) with (25), it can then be seen that the analysis/synthesis an interesting spectral interpretation of the DCTof u(n) canbe obtainedfrom Y ( k ) according to the DCT can be derived. In this section this interpretation will be discussed and the results will be utilized in later sections. relation Let u(n) denote an M point sequence such that u(n) = u(n) Vc(k)= c ( k ) e-jnk/2M Y ( k ) k = 0 , 1 , 2 , * * , M - 1. for 0 < n =gy(f,o@Y(n)+ e y ( 4 .
(36)
k=0,1,2;..,2M-
1.
(37c)
From ( 2 5 ) it thenbecomes clear that theM point DCT of u(n), denoted Vc(k),can be expressed in terms of U ( k )according to
vC(k)= R, {c(/c) e-i(nk’2M) u(k)} Fig. 9(d) depicts theend effects betweentheleftand right boundaries of $(n) due to the circular convolution of y ( n ) k = 0 , 1 , 2 ; * * M - 1. (38) withthe multiplicative component of quantization g,(n). In terms of the sequence u(n), however, it is seen that these where Re denotes the real part. Denoting I U ( k )I and t3k as interactions are now localized, andthere is no longeran the magnitude and phase of U ( k ) , (38) canbe expressed in exchange of energy between the left and right boundaries of the form
522 IEEE
TRANSACTIONS ON ACOUSTICS, SPEECH, AND SIGNAL PROCESSING, VOL. ASSP-27, NO. 5, OCTOBER 1979 FORMANTENVELOPE
)I
lU(k (PITCH 8. FORMANT STRUCTURE)
.m..
9 W
n 3
t
a I
a
0
I c i k ) s i n( w k / 2 1
f5/2
I
FREQUENCY DFT FILTER- BANK ANALYSIS ( 2 M CHANNELS)
Fig. 11. Illustrative interpretation of DCT spectrum.
-
(39)
D. Quantization of the Tkansform Coefficients
rk/2M) k = 0 , 1 , 2 , * . . M - 1. (40)
Thus, it is seen that the DCT has a spectral envelope which is identical tothat of theDFTand amodulating term, cos (0, - nk/2M), which adds a rapidly varying component to its spectrum. Fig. 11 givesan illustrative example of this DCT spectrum (this is an illustration only, it is not obtained from real speech). Since the DCT is bounded by the spectral envelope of the DFT, it is also apparent that it exhibits all of the properties of formant structure and pitch striations that are present in the DFT spectrum. These speech characteristics can therefore be exploited directly with the short-timeanalysis/ synthesis based on the DCT. By appropriately defining the analysis window h(n) in shorttime analysis/synthesis, an equivalent filter bank model for the DCT, based on a 2M channel filter bank (with M redundant channels), can be described. Let k = 0 , 1 ; . * , 2(41 M-
Ok=Tk/M
1
1
denote the center frequencies of the 2M channels of the filter bank. Then, from (IO) and (38), an appropriatedefinition of the short-time DCT, sampled at times n = sR, can be given as
xC,(k) I
~
= R, =
I
c~ ( k ) e-jWk/’ ~
2 h(n
m =-
1
. x(m) e-jwkm
- m)
m
(42a)
= R e (c(k) e-iwk’z [(x(n)e-jWkn) * h(n)] } = c ( k ) cos (wk/2)[(x(n)
DCT MODIFICATION
Fig. 12. Filter bank analysis model for DCT.
~ , ( k=)R, {c(k)I ~ ( kI ei(ek-(nk/2M))) )
Vc(k)= c(k) I U ( k )I cos (0,
‘’
cos ( w k n ) )* h(n)]
The quantization of the transform coefficients is usually made by means of uniform quantizers which are characterized by a step-size As,@) and by a number of levels 2 bsR(k). The choice of the step-size and the number of bits bsR(k) for a given transform coefficient is of fundamental importance in adaptive transform coding. In t h s section we assume that the bit allocation has already been determined and that an estimate of the spectral variance @&(IC) of the transform coefficients is known. The bit allocation and estimation of spectral variance will be discussed in greater detail in Sections IV-E and IV-F. As observed by Zelinski and No11 [ l l ] , the probability density functions of the (gain normalized) transform coefficients are approximately Gaussian distributed. Therefore, the choice of the optimum (uniform) step-size A,,(k), considering a mean-square error criterion, can be determined from the variance estimate according to the theory of Max [28] . For a given number of bits b s ~ ( k )the , optimum step-size is therefore AsR ( k ) = Cy (bsR
@sR ( k )
(43)
where a ( b s ~ ( k )is) a constant of proportionality, which is a function of the number of bits, and can be found in the tables of Max. From the point of view of subjective quality, however, it is not clear that a mean-square error criterion is the most appropriate choice for determining the step-size. Therefore, in practice, we foundthatit is desirable to include an additional factor Q , denoted as the quantizer loading factor, in the equation of (43). Thus,
As, 6)= (bsR( k ) ) @sR ( k ) (44) (42b) where Q = 1 implies a loading that is optimum in the mean- c ( k ) sin ( w k / 2 ) [ ( x ( nsin ) (wkn))* h(n)]. square (uniform step-size) sense. By adjusting Q, a trade can be made between effects of overload and granular types of dis(42c) tortion in the transform coder. The effect of Q on the subThe above equations represent the filter-bank interpretation of jective quality of the coder will be discussed in greater detail the DCT as shown in Fig. 12 (for one analysis channel). The in Section IV-G. model can be divided into two parts, the first part which consists of a 2M channel DFT filter bank as in Fig. 1 and the E. Bit Allocation and Noise Shaping The choice of the bit allocation bsR(k) determines the acsecond part which consists of the modification due to the DCT. The close association of the DCT analysis to the short- curacy in which the transform coefficients are encoded. Thus time Fourier analysis is therefore readily apparent from this it controls the distribution of the quantizing noise in the frequency domain. An extensively studied case is that of a stamodel and Fig. 11.
TRIBOLET AND CROCHIERE: DOMAIN.CODING FREQUENCY
OF SPEECH
523
tionary Gaussian correlated random process [20], [23]. If the transform coefficients havevariances a&@), and if aminimum mean-square error criterion is desired, then the optimum bit assignment bsR(k)can be shown to be bsR(k)= 6 + - log, 2
D*
k = 0 , 1 , 2 , * . - , M - 1 (45)
where 6 is a correction term that takes into account the performance of practical quantizers. D* denotes the variance of the quantization noise and is defined as
U
M-1
k--
Fig. 13. Interpretation of bit assignment rule.
where a: ( k ) denotes the variance of the quantization noise incurred in quantizing the kth transform coefficient. The value of D* is chosensuch thatthe sum of the bit assignments bsR(k)satisfies the constraint M-1
B=
bs~(k)
(47)
k =O
where B is the number of bits/block available for transmission over the binary channel. It can be shown also that the above bit assignment rule, based on a minimum mean-square error over the block, leads to a flat noise distribution in frequency [ll] , [20], [23] , [40] ,i.e., a:(k) = D" for all k . An interpretation of this bit assignment rule can be seen in Fig. 13. The dashed horizontal lines represent decision thresholds, Xi, for choosing the bit allocation b s ~ ( k )For . example, if the kth log spectral coefficient log2 &(k) lies between h3 and X4, the bit allocation for that coefficient is bSR(k)= 4. The thresholds are spaced 6 dB apart. Thus, for every 6 dB that &(k) is increased, one more bit, or 6 dB of signal-tonoise-ratio, is added to thequantizer.Therefore,the noise remains flat acrossthefrequencyband. Two exceptions to this rule occur. Allvaluesoflog, &(k) below X. areassigned zero bits (negative bits are not allowed) and all values of log2 above, say h 5 ,are assigned 5 bits (i.e., there is a maximum limit). If the resulting total number of bits assigned in this way is less than the number of bits available for transmission B then the level of the thresholds Xi (proportional to 0")are uniformly reduced (keeping a 6 dB spacing). If the total number of bits is greater than B, the threshold level is increased. This process continues until (47) is satisfied. In practice, this bit allocation can be achieved by a three-step process [39] instead of an iterative process as implied above. As observed,the above bit allocation scheme results in a quantization noise log, az(k) that is flat across the spectrum and is proportional to the threshold level Xo. In terms of a mean-square error criterion it can be shown that this algorithm minimizes thenoise variance &k) = D*.' Fromperceptual criteria, however, it is known that a flat noise distribution is not the most desirable. To take into account the shape of the quantization noise in frequency, the bit assignment rule of (45) can be modified by allowing a (positive) weighting factor w ( k ) that weights the importance of the noise in different frequency bands. Thus, (45) becomes
0
k-
M-1
Fig. 14. Interpretation of frequency-weighted bit assignment.
(48) Thisbit assignment minimizes the followingfrequency weighted distortion measure: (49) The resulting noise spectrum is then given by
~$(k)=L.(w(k))-'*D* k=0,1,2;..,M-
1
(50)
where L is a constant. One interpretation of this frequency weighted bit assignment is depicted in Fig. 14 where it is seen that the thresholds Xi are modified by w(k). Alternatively, it can be viewed as a preemphasized U ~ R( k ) , i.e., w ( k ) a& ( k ) , and flat thresholds in a manner similar to that in Fig. 13. The question remains as to what the most appropriate form of weighting w(k) is for optimum subjective performance of the transform coder. In general, it can be observed that this weighting should be a dynamic one, e.g., the most appropriate weighting for voiced speech will be different than that for unvoiced speech. More specifically, theweightingshouldbe chosen in a manner such that the quantization noise is most effectively masked by the speech signal [29] - [3 13 , [44] . One class of weighting functions that provides a wide range of control over the shape of the quantizing noise relative to
524
IEEE TRANSACTIONS ON ACOUSTICS, SPEECH, AND SIGNAL PROCESSING, VOL. ASSP-27, NO.
n
the shape of the speech spectrum isgiven by the functional form wsR ( k ) = 0:; ( kk)= 0 , 1 , 2 , * * * , M -
5, OCTOBER 1979
SPEECH SFECTWM
1 (51)
where y is a parameter that can be experimentally varied. The case where y = 0 (uniform weighting) has been discussed previously. The noise spectrum in this case is flat and the bit assignment is such that the signal-to-noise-ratio has the shape of the spectrum. The case where y = - 1 (inverse spectral weighting) leads to a constant bit assignment. Here the noise spectrum will follow the input spectrum, and the signal-to-noiseratio is constant as a function of frequency. As the value of y is slowly varied between these two extremes (- 1 < y < 0), the noise spectrum will likewise evolve from a flat distribution to one that precisely follows that of the speech spectrum. This variation is depicted in Fig. 15. Note that the spectral estimate in this illustration does not include details about the fine structure (pitch harmonics) in the spectrum. When the pitch structure is considered, the form of the weighting in (51) should be modified such that it follows only the smooth (formant) component of the spectral model. This willbe discussed in more detail in Section IV-F. The choice of appropriate values for y will be discussed in more detail in Section IV-F.
F. Spectral Parameterization andAdaptation of the Transform Coder The application of the above bit assignment and step-size adaptation algorithms are strongly dependent on the estimate of the spectral variance c&(k). The more accurate this estimate is of the true variance the better the performance and the more reliable the above algorithms will be. Since speech is a nonstationary process these spectral variances are not known a priori and must therefore be estimated, encoded, and transmitted to the receiver. This information, whch represents in some form the dynamical properties of speech in the transform domain, is commonly referred to as “side information.” Two basic adaptation techniquesfortransform coding of speech have been proposed in recent literature. The first technique, proposed by Zelinski and No11 [ l l ] , [40] is illustrated in Fig. 16. The DCT spectrum is represented by a reduced set of (typically 16 to 24) equally spaced samples of the spectral estimate. These samples are computed by a local averaging of the DCT magnitude coefficients around the sample frequencies. The sample values are quantized and encoded for transmission to the receiver as side information (as seen in Fig. 8). They are also decoded and used in the transmitter so that the step-size and bit allocation computations are exactly duplicated in the transmitter and the receiver. The encoding of the side information requires approximately 2 kbitsls. Further details on a modification of this encoding procedure are given in Section IV-G. To obtain spectral estimates of gssR(k)at all frequencies (i.e., all values of k ) , the above sample estimates are geometrically interpolated (i.e., linearly interpolated in the log domain), as illustrated in Fig. 16. The result is a piecewise approximation of the spectral levels in the frequency domain; These values of a S ~ ( kare ) then used by the bit assignment and step-size adaptation algorithms.
I
I
-k
0
M-1
Fig. 15. Control of noise shaping by parameter y.
SPECTRUM DCT
r”l.\.r.,
EXPECTED SPECTRAL LEVELS
I
I
0
C
4KHZ
FREQUENCY
Fig. 16. Representation of side information as equal spaced samples of the spectral estimate.
I
I
I
I
kHz
Fig. 17. Illustrationof
theoperation of theadaptation Fig. 16.
scheme of
Fig. 17 illustrates the operation of the above adaptation scheme for transform coding at 8 kbits/s. Fig. 17(a) shows the DCT spectrum and the estimated spectral levels aSR(k)as seen by the dotted line. Fig. 17(b) shows the resulting bit assign-
525
TRIBOLET AND CROCHIERE: FREQUENCY DOMAIN CODING OF SPEECH
-
SPECTRAL COEFFICIENTS
-
Srw~~~~~ DISCRETE
COSINE TRANSFORM
I-
f. ~‘3
SPECTRAL QUANTIZERS AND ENCODERS
_1
%
CHANN L
4)
ADAPTATION
II F F T I I PSEUDO .! A C F
45 FIND PITCH AND
-NORMAL - - - -EOUATIONS ----
‘ITCH
LEVINSONRECURSION WITH
e,
IQUANTlZATION AREA COEFFS OF LOG
IPITCH PGAlN
STEPSIZE
I
“SIDE I N F O R M.TION ”
’SIDE INFORMATION’ ENCODER
GENERATION OF PlTC
L=o
I’ (A) TRANSMITTER
SIDE INFORMATION
OUANTIZED LOG AREAS I
BIT ASSIGNMENT
4) [PITCHPGAIN I
(B)
RECEIVER
Fig. 18. Block diagram of “spech specific” or “vocoder-driven” adaptation algorithm for ATC.
ment obtained with this spectral estimate and Fig. 17(c) shows thedecoded DCT spectrumatthe receiver. Becauseof the low bit rate (8 kbits/s), large regions of the spectrum receive essentially no bits for encoding. Also, inregionswhere only one bit is used for encoding, this bit must be used for the sign, andthereforethequantizedmagnitude is proportional to A usR(k). In these regions, as for example, the region near 2 kHz inFig. 17(c), it isseen that all informationconcerningthe spectral detail is lost. We refer to the above adaption algorithm as a “nonspeech specific” algorithm in the sense that it does not directly take into account the known properties of speech, such as the allpole vocal-tract model and the pitch model. The technique, however, is quiteappropriate for speechtransmissionator above 16 kbits/s, since at such rates there are sufficient bits to allowan accurate representation of the fine structure (pitch harmonics) in the DCT spectrum. As the bit rate is reduced below 16 kbits/s, however, it becomesincreasingly more difficult to accuratelyencodethe fine structure.Infact,at 8 kbits/s, for example,thepitchinformation is no longer sufficiently preserved and, as a consequence, the received signal appears degradedby a very perceptible“burbling”or “click” distortion. Oneway ofmaking the abovealgorithm slightly more tailored to speech is to use an unequal spacing for the sampled
estimates [40]. One criterion is to use an articulation based scale such that sampled estimates are more closely spaced at lower frequencies and more widely spaced at higher frequencies.Thereasoningissimilar to that for choosing unequally spaced bands for the sub-band coder. At low frequencies the Q s of the formant resonances are generally much higher than at high frequencies. Thus, the spectrum typically varies more at low frequencies than at high frequencies. While this modificationimprovestheperformance ofATC slightly, it is not sufficient to overcome the difficulties mentioned above at low bit rates (below 16 kbits/s). A more appropriate algorithm for bit rates below 16 kbits/s is amorecomplex “speech specific” adaptationalgorithm which takes full advantage of the known models and dynamics of the speech production mechanism in order to predict the DCT spectral levels [19] . This algorithm is based on an allpolemodel of the formant structure of speech and a pitch model to represent the fine structure (pitch striations) in the speech spectrum [12] , [ 131 . The resulting algorithm is referred to as a “vocoder-driven’’ adaptation strategy due to the close relationship of this spectral estimate to a vocoder model. Fig. 18 illustrates ablock diagram forone possible implementationof this technique. First the DCT spectrum is squaredand inverse transformedwithan inverse DFT.This yields an autocorrelation-like function which we shall refer to
IEEE TRANSACTIONS ON ACOUSTICS, SPEECH,
526
AND SIGNAL PROCESSING, VOL. ASSP-27,
1
kl4
NO. 5, OCTOBER 1979
I
n
-
M- 1
Fig. 20. (a) Infinite duration pitch model. (b) Windowed pitch model. COMBINED SPECTRAL
> k-
0
M-1
these techniques are well established [32], [33], they will not be discussed in this paper. Anumber of alternatives are available for generating the pitch pattern in the frequency domain. We have investigated two different models. The first model is of the form
Fig. 19. Spectral components of speech spectrum model. (a) Formant structure. (b) Pitch structure. (c) Combined model.
as the pseudo-ACF (autocorrelation function). Since the DCT spectrum is bounded in shape by the Fourier spectrum as seen in Section IV-C, this pseudo-ACF e h b i t s very similar properties to that of a normal ACF. The first P t 1 valuesof this function are used to define a correlation matrix in the usual normal equationsformulation sense [ 121 . The solution of these equations yields anLPC filter of order P. The inverse spectrum, illustrated inFig. 19(a), yields an estimate of the formant structure of the DCT spectrum denoted as uf(k). The fine structure of the DCT spectrum is obtained from a pitch model. To obtain the pitch period E the pseudo-ACF is searched for a maximum above the range P t 1. The corresponding pitch gain G is the ratio of the pseudo-ACF at E over its value atthe origin. With these two parameters, a pitch pattern u,(k) is generated in the frequency domain as illustrated in Fig. 19(b). The two spectral components u f ( k ) and and u,(k) are multiplied and normalized to yield the final spectral estimate for aSR (k),
is,,(k)= Uf(k)
and is associated in time with a one-sided, infinitely long, periodic impulse train withexponentially decaying amplitudes, i.e., (54)
The model of (54) is depicted inFig. 20(a). Becauseof the infinite duration of the assumed impulse train, this model leads to a veryhigh Q model of the pitch harmonics in the frequency domain. As a consequence most of the bits are allocated to the pitch harmonics (at low bit rates), with essentially no transmission of DCT coefficients between these harmonics. This leads to a sensitivity of the algorithm to high-pitch speakers and tooccasional pitch errors. A slightly more realistic pitch model takes into account the fact that we are attempting to predict the spectral levels of a finite block of speech. In this model the infinitely long impulse train is windowed by the analysis filter h(n), i.e., m
O p (k)
k = 0 , 1 , 2 , . * . , M - 1. (52)
p(n) = h(n) .
G”6 (n - d ) m
=0
(5 5)
This estimate, illustrated by Fig. 19(c), is then used for the bit assignment and step-size adaptation algorithms asseenin as depicted inFig. 20(b). In the frequency domain this Fig. 18. amounts to the convolution of the frequency response of the More generally, one may use other vocoder schemes, such as impulse train, (53), with the frequency response of the winhomomorphic vocoding to obtain a similar spectral fit. AI- dow.Thus, the high Q pitch harmonics are effectively though these schemes have not been tried, there are a number smoothed by the frequency response of the window which of factors that appear to lean in favor of the LPC model. leads to a more realistic model. From a theoretical point of view, the LPC model is closer to Fig. 21 illustrates the operation ofthe “vocoder-driven” the physical mechanism of speech production thanother adaptation algorithm. Fig. 21(a) shows the DCT spectrum and models. In particular,the LPC model allows better spectral the spectralestimate @,R(k) (seen as thedotted line). The fits in the high Q formant regions where the signal must be en- speech block is the same as that ofFig. 17. Fig. 21(b)and coded most accurately. From a practical point of view the use 21(c) show the resulting bit allocation and decoded DCT of the parcor parameters in the LPC model allows for a highly spectrum in the receiver. The main effect of this algorithm is efficient means forquantizingthe LPC coefficients. Since that it forces the assignment of bits to many pitch harmonics
TRIBOLET AND CROCHIERE: FREQUENCY DOMAIN CODING OF SPEECH
3
TABLE I TYPICAL DESIGN PARAMETERS FOR THE “NONSPEECH SPECIFIC” ATC ALGORITHM AT 16 KBITS/S
100
a
kz mz t; n
80 60 40 20 0 -20
‘
I
I
I
I
kHz
Fig. 21. Illustration of “speech specific” ATC algorithm.
which otherwise would not be transmitted at all, as seen by the comparison of Figs. 17 and 21. In addition, the algorithm helps to preserve the information in the pitch structure of the spectrum, evenin frequency regionswhere one bit/sample is used (e.g., the region around 2 kHz in Figs. 17 and 21). As seen by (40), the DCT coefficients can be expressed in terms of the magnitude of the Fourier transform I U(k) I times a modulating term cos (e, - nk/2M) where 0, is the phase of the kth DFT coefficient. In principle, the magnitude term is predictedalmostcompletely by the above algorithmand divided out, leaving only the cosine of the phase to be encoded. The noise shaping for the vocoder-driven adaptation scheme should be based only on the smooth (uf(k))component of the spectrum.Thus, for this algorithmthe weighting wsR(k)of (51) is replaced by wsR
521
=
k=0,1,2;.*,M-
1. (56)
Inthis way the noise shapingdoes not directly affect the allocation of bits in the pitch harmonics. With the above “speech specific” algorithmthe quality of thetransformcodercan be improved in the rangeof 16 to 8 kbits/s over that of the “nonspeech specific” algorithm. At 16 kbits/s and above both techniques have a similar quality. Below 16 kbits/s the nonspeech specific algorithm produces a low-level but highly discernible “burbling”or“click” noise which hasbeenfound to be quiteannoying.This noise appears to be due primarily to a breakdown of the pitch structure and end effects in the blocks. With the speech specific algorithm a more parsimonious allocation of bits can be made which results in a significant reduction of this type of noise. As the bit rate of the coder is pushed down below 8 kbits/s, however, the algorithm becomes further starved for bits and these types of noises again become pronounced. In fact, at 4.8 kbits/s,thespeech specific algorithm also produces significant degradations and click noise.
Basic Parameters: Transform Size (MI Sampling Rate (kHz) Block Overlap (samples) Max. No. Quantizer bits Quantizer Loading (Q) Noise Shaping Parameter ( 7 ) No. of Side Info. Frequencies Side Frequency Warping ( A ) Voiced (A ,J Unvoiced (A,,)
256 8 12 5 1.0 -0.125
20 -0.25 0.25
No. of Bits for Quantization, Voiced/Unvoiced Decision First Side Frequency Remaining 19 Side Frequencies Transform Coefficients
38 444
Total bitdblock
488
1 5
G. Examples and Practical Considerationsof Adaptive Transform Coder Designs Computer simulations were generated for both of the above ATC algorithms corresponding, respectively, to Figs. 8 and 18. In addition, a number of modifications and refinements were made on the basic algorithms to enhance their performance and robustness. In this section we will briefly discuss a number of aspects ofthese designsin more detail. We will first consider issues that are common to both designs and then discuss the specifics of each design. In both designs transform sizes of M = 256 (with a sampling rate of 8 kHz) were generally used. This size provides a sufficient spectral resolution to capturethe fine details ofthe speech spectrum while keeping the overall delay of the coder within reasonable practical limits (less than 100 ms) for many types of communications applications. Also, in both designs the bandwidth of the input speechwas limited to the telephone bandwidth of 200 to 3200 Hz by an IIR digital filter prior to encoding. A similar bandpass characteristic was multipliedwiththe spectral estimate a s ~ ( prior to the bit allocation and step-size adaptation algorithms. In this way all available bits are automatically constrained to be used within the 200 to 3200 speech band of interest and the performance of the coder is not affected by signals outside of this band. Table I provides a summary of typical parameters that were used forthe“nonspeech specific” ATC algorithm for a16 kbits/s design.Blockswere overlapped by12 samples and windowed by the trapezoidal window of Fig. 10. A maximum of 5 bits wereallowed for quantizing each transform coefficient. A quantizer loadingQ = 1 was used, and a noise shaping parameter of y = -0.125 was found to give good results. Twenty unequally spaced side frequencies were used in the coder with a different spacing used for voiced and unvoiced frequencies. The voiced/unvoiced decisionwas made according to a simple threshold decision on whether the signal energy waslarger at lowfrequencies(near 500 Hz) or at high frequencies (near 2500 Hz). The choice of the unequal spacing of the side frequencies was determined from a set of equally spaced frequencies in the range 200 to 3200 Hz according to the relation [34]
~)
IEEE TRANSACTIONS ON ACOUSTICS. SPEECH, AND SIGNAL PROCESSING, VOL. ASSP-27, NO. 5, OCTOBER 1979
528
TABLE I1 TYPICAL DESIGN PARAMETERS FOR THE “SPEECH SPECIFIC” ATC ALGORITHM AT 16, 12, AND 9.6 KBITS/S
0
-
3 --
FREQUENCIES SIDE FOR UNVOICED SEGMENTS
16 kb/s Basic Parameters: 256 Transform Size (M) 8 Sampling Rate (kHz) Block Overlap (Samples) 16 8 5 Max. No. Quantizer bits 1.0 Quantizer Loading (Q) Noise Shaping Paramter ( 7 ) -0.125 Order of LPC Analysis 12
-
No. Bits for Quantization: Gain Pitch Pitch Gain Log Area Ratios: 1 2 3 4
5 6 I 8
FREQUENCY ( k H z )
9
Fig. 22. Spectral warping used for unequal spacing of side information in “nonspeech specific” ATC example.
10 11
.“ IL
Data Total BitslBlock
where wi (scaled to the range 200 to 3200Hz) denotes the set of equally spaced frequencies i = 1, 2, . . . 20 (expressed in radians) and &i denotes the locations of the unequally spaced frequencies. The parameter h is the warping parameter (not related to h in Fig. 13) which determines the degree of warping of the unequally spaced frequencies. A value of h = X, = -0.25 is used for the spacingofside frequencies when the speech energy is larger at low frequencies (voiced region). Similarly, a value of h = h, = 0.25 isused for spacing ofthe side frequencies (unvoiced regions)is morepredominant. Fig. 22 illustrates the location of these side frequencies for both the voiced and unvoiced cases. By choosing h = 0 this scheme reduces to that of the equal spaced side frequencies depicted by Fig. 16. Once the side frequencies are determined the local averages of the magnitude of the DCT values near those frequencies are computed. The logarithm of these values are then computed prior to quantization where ai willbeused to denotethe logarithmofthe ith side value. The value of ai nearest to 500 Hz (for a voiced decision), or 2500 Hz (for an unvoiced decision), is quantized first with 5 bits of accuracy. The remaining coefficients are thenquantizedwith 2 bitseach by encoding the difference minustheexpected difference from the ith to the (i t 1)th side value (where the expected difference is obtained from measurements of typical speech data). The step-size is alsoselected according to theexpected variance of thisdifference.Thus, the schemeissimilar to a DPCM coding of the ai values starting from the one nearest to 500 or 2500 Hz andthenquantizing differences in both directions from this startingvalue. The above transform coding scheme (at 16 kbits/s) provides a quality that is essentially indistinguishable from an original 200-3200 Hz speech signal(based on our informal listening observations) over a wide range of speakers. It has a segmental S/N ratio on the orderof 17 dB.
5 5 4 6 5 5 4 4 3 3 2 2 1 1 1 445 496
12 kb/s 256 8 16 4 1.3 -0.125 12
9.6 kb/s 256 8 4 1.5 -0.125 12
5 5 4
5 5 4
6 5 5
6 5 5
4
4
3 3 2 1 1 0
3 3 2 1 1
0 0 316
0 0 244
360
288
0
Table I1 provides a summary of typical parameters that were used for the “speech-specific” ATC algorithm at bit rates of 16, 12, and 9.6 kbits/s. As the bit rate was reduced the block overlap andquantizer loading parameters wereincreased to give a better subjective quality to the coder and, to some extent, to help reduce effects of “click” and “burbling” noises. Theside information was represented by a 12 pole LPC analysis. Fromthis analysis, the log area ratios [32] , 1331 were computedandquantized. Prior to quantizationthe meansof these values (obtained from a typical speech data) were subtracted. The quantization step-sizes were determined according to the expected valuesof the variancesof the log area ratios (obtained from typical speech data). Table I1 shows the number of bits used to encode each log area ratio at the different bit rates of the coder. The above “speech specific” ATCdesigncan provide a quality that is essentially indistinguishable fromthe original 200-3200 Hz speech signal(based on ourinformal observation) at a bit rate of 16 kbits/s. The segmental S/N is on the order of 18 dB. At 12 kbits/s someslight degradations and occasional low-level clicks are observed for some speakers. Segmental S/N values on the order of 14.5 dB are observed at this bit rate. At 9.6 kbits/s a greater sensitivity to speakers is apparent. Withsome“good” speakers virtually no degradations or “clicks” are observable. However, with other speakers some distortionin theform of low levelclicks or a slight hoarseness are noticeable but not overly disturbing compared to other coding schemes at this bit rate. A segmental S/N of about 12.8 dB is observed.
H. Discussion In this section we have attempted to present a fairly detailed discussion of recent developments in adaptive transform coding. In addition, we have tried to provide an analysis/synthesis point ofview of the transform coder which we believewill help in settinga framework for future research in this area.
TRIBOLET AND CROCHIERE: FREQUENCY DOMAIN CODING OF SPEECH
‘‘
1
Ad.6‘
:2
’
’
’
529
‘
16 I 20 TRANSMISSION RATE ( k
24 I
b)
‘
’
28
Fig. 23. Median opinion score ratings for comparison of coders.
V. OTHER RELATED FREQUENCY DOMAIN CODING TECHNIQUES AND MODIFICATIONS In this paper we have primarily focused on sub-band coding and transform coding as two examples of frequency domain coders. These are not the only coders that belong in this class of coders however and in t h s section we wish to briefly mention other related techniques.
sub-bandcoding. In another approach Gold [37] has combined concepts of sub-bandcodingandchannelvocodmgfora multiple-rate speech coding/vocoding system. VI. CONCLUSIONS
Except for the phase vocoder, most frequency domain coding techniques for speech have been proposed quite recently (within the past four years). In this paper we have attempted A. Phase Vocoder to drawtogethera general theoretical framework, based on Ourdiscussionof frequencydomaincoderswould not be analysis/synthesis and spectral estimation and modeling, which complete without mention of the phase vocoder by Flanagan canbeusedas afoundationforfurtherresearch in this and Golden [6]. The phase vocoder is based on a direct imple- direction. mentationofthe analysis/synthesis techniques discussed in Also, because of the recent origin of many of these techSection 11. In fact, the theory of short-time analysis/synthesis niques, little data is presently available on the comparison of has been primarily developed through research on the phase the performance of frequency domain coding techniques with other waveform codingschemes.Preliminarystudies,howvocoder. ever, show that frequency domain coders can match and exInthe phase vocodertheshort-time spectral components X,,@) are converted to magnitude and phase derivative com- ceed the quality oftheir time domain counterparts. ponents which are subsequently coded for transmission. Typi- Fig. 23 briefly summarizes the results of one such study [14] . cally, 30frequencychannels areused inthe phase vocoder In this study four different coders were compared at bit rates which gives it a frequency resolution between that of the sub- of 24, 16, and 9.6 kbits/s. The coders included a transform band coder andthe transform coder. Techniques for adaptively coder (ATC) based on the “nonspeech specific” algorithm (dequantizing the channel signals of the phase vocoder, similar to picted by Figs. 8, 16, and 17), a sub-band coder (SBC), and those of sub-band and adaptive transform coding,can be used. two ADPCM (adaptive predictive PCM) coders,onewitha fixed first-order predictor (ADPCM-F) andonewithan 8th B. Polar Plane Coding order adaptive predictor (ADPCM-V). All of the coders were nonpitchpredictingcoders (i.e., theydid not exploitpitch Another closely related technique is that ofpolarplane prediction). Sixty-five listeners ratedthecoders in terms of coding investigated by Gethoffer [35].In this schemethe quality on a 1 to 9 scale using 1 to represent the worst quality magnitude and phase of XsR(k) is computed and quantized and 9 to represent the best quality. Quality at 1 washighly with different accuracy.Good results were reportedatbit noisy and degraded, and quality at 9 was indistinguishable rates below 16 kbits/s using very large (8192) transform sizes. from the original. The median opinion scores of the listeners C. Voice-Excited and Vocoder-Excited Schemes (bracketedby their 0.95 confidence interval) are plotted in For very low bit rates (below 8 kbits/s), there are generally Fig. 23 as a function of transmission rate. As seen, the ATC an insufficient number of bits to encode all of the significant coder was clearly preferred over the other coders and theSBC frequency components. At these rates combinations of voice- coder was rated as having a quality comparable to that of the excitedvocodingandfrequencydomaincodingtechniques more complex ADPCM-V coder. A more detailed analysis of have been investigated by several researchers. Esteban et al. this data can be found in [ 141 . [36] have recently demonstrated that a combination of a subIn another experiment involving a comparison of sub-band band coder and a voice-excited vocoder produce good results coding with ADPCM-F and two forms of delta modulation, a in the9.6-4.8 kbits/s range. An interesting feature of their similar preference was foundforthesub-bandcoder [38]. design is that they employ an LPC dynamic preemphasis (see Thiswasalso substantiated in otherinformalcomparisons Section 11-E) to spectrally flatten the baseband signal prior to found in [SI and [9] .
530
IEEE TRANSACTIONS ON ACOUSTICS, SPEECH, AND SIGNAL PROCESSING, VOL. ASS?-27, NO. 5, OCTOBER 1979
With future developments of frequency domain coding techniques it is anticipatedthat even furtherimprovements are possible with frequency domain techniques. ACKNOWLEDGMENT Theauthors arevery grateful to the following persons for their comments and discussion during the course of this work: J. B. Allen, B. S. Atal, D. Falconer, J. L. Flanagan, P. Noll, and L. R. Rabiner.They wouldalsoespeciallylike to thank P. Noll, R. Zelinski, and L. R. Rabiner for supplying Fortran code for a number of subroutines that were used in the computer simulations. Their assistancewasvery helpful and it is greatly appreciated. REFERENCES [ 11 M. R. Portnoff, “Time scale modification of speech based on short-timeFourier analysis,” Ph.D. dissertation, Massachusetts Institute of Technology, Cambridge, Apr. 20,1978. [2] -, “Implementation of the digital phase vocoder using the fast Fourier transform,” IEEE Trans. Acoust., Speech, Signal Processing, vol. ASSP-24, pp. 243-248, June 1976. [3] J. B. Allen and L. R. Rabiner, “A unified approach to short-time Fourier analysis and synthesis,” Proc. IEEE, vol. 65, pp. 15581564, Nov. 1977. [4] R. W. Schafer and L. R.Rabiner, “Design and simulation of a speech analysis-synthesis system based on short-timeFourier analysis,” IEEE Trans. Audio Electroacoust., vol. AU-21, pp. 165-174, June 1973. [5] C. J . Weinstein, “Short-timeFourier analysis andits inverse,” S. M. thesis, Elect. Eng. Dept., M.I.T., Cambridge, 1966. [6] J. L. Flanagan andR. M. Golden, “Phase vocoder,” Bell Syst. Tech. J., vol. 45, pp. 1493-1509,Nov. 1966. [7] J. B. Allen, “Short-term spectral analysis, synthesis, and modification by discreteFourier transform,” IEEE Trans. Acoust., Speech, Signal Processing, vol. ASSP-25, pp. 235-238, June 1977. [8] R. E. Crochiere, S. A. Webber, and J . L. Flanagan, “Digital coding of speech in sub-bands,” Bell Syst. Tech. J . , vol. 55, pp. 1069-1085, Oct. 1976. [9] R. E. Crochiere, “On the design of sub-band coders for low bitrate speechcommunications,” Bell Syst. Tech. J., vol. 56, pp. 747-770, May-June 1977. [ l o ] D. Esteban and C. Galand, “Applicationof quadrature mirror fiiters to splitband voice coding schemes,” in Proc. 1977 Int. Con5 Acoust.,Speech, Signal Processing, Hartford, CT, May May 1977, pp. 191-195. [ l l ] R . Zelinski andP. Noll,“Adaptivetransformcoding of speech signals,” IEEE Trans. Acoust.,Speech, Signal Processing, vol. ASSP-25, pp. 299-309, A u ~ 1977. . [12] J . D. Markel and A. H. Gray, Jr., Linear Prediction of Speech. New York: Springer-Verlag, 1976. [13] L. R. Rabiner and R. W. Schafer, Digital Processing o f Speech Signals. Englewood Cliffs, NJ: Prentice-Hall, 1978. [14] J. M. Tribolet, P. Noll, B. J. McDermott, and R. E. Crochiere, “A comparison of the performance of four low bit rate speech waveform coders,” Bell Syst. Tech. J., vol. 58, pp.699-712, Mar. 1979. Also, “A study of complexity and quality of speech waveform coders,” in 1978 Proc. IEEE Int. Con5 Acoust., Speech, Signal Processing, Apr. 10-12, 1978, Tulsa, OK, pp. 1586-1590. [15] P. Cummiskey,N. S. Jayant,and J. L. Flanagan, “Adaptive quantizationin differential PCM coding of speech,” Bell Syst. Tech. J., vol. 52,pp. 1105-1118, Sept. 1973. [16] N. S. Jayant, “Digital coding of speech waveforms: PCM, DPCM, and DM quantizers,” Proc. IEEE, vol. 62,pp. 611-632, May 1974. [17] R. E. Crochiere, “A mid-rise/mid-treadquantizerswitch for improved idle-channel performance in adaptive coders,” Bell Syst. Tech. J., vol. 57, pp. 2953-2955, Oct. 1978. [18] D. J. Goodman and R. M. Wilkinson, “A robust adaptivequantizer,” IEEE Trans. Commun., pp. 1362-1365, Nov. 1975. [19] J. M. Tribolet and R. E. Crochiere, “A vocoder-driven adaptation strategy for low bit-rate adaptive transform coding of speech,”
presented at 1978 Int. Conf. Digital Signal Processing, Florence, Italy, Sept. 1978. J. Huang and I.. Schultheiss, “Block quantization of correlated gaussian random variables,” IEEE Trans. Commun. Syst., vol. CS-11, pp. 289-296, Sept. 1963. P. A. Wintz, “Transformpicture coding,” Proc. IEEE, vol. 60, pp. 809-820,1972, H. P. Kramer and M. V. Mathews, “A linear coding fortransmitting a set of correlated signals,” IRE Trans. Inform. Theory, vol. IT-2, pp. 41-46, Sept. 1956. L. D. Davisson, “Rate-distortion theory and application,” Proc. IEEE, V O ~ 60, . pp. 800-808, July 1972. N. Ahmed and K. R. Rao, Orthogonal Transforms for Digital Signal Processing. New York: Springer-Verlag, 1975. W. Chenand S. C. Fralick, “Image enhancement using cosine transform filtering,” in Proc. Symp. Current Mathematical Problems in Image Science;” Montery, CA, Nov. 1976, pp. 186-192. -, “A fast computational algorithmfor the discrete cosine transform,” IEEE Trans. Commun., vol. COM-25, pp. 10041009, Sept. 1977. M. J. Narasimha and A. M. Peterson, “On the computation of the discrete cosine transform,” IEEE Trans. Commun., vol. COM-16, pp. 934-936, June 1978. J. Max, “Quantizing for minimum distortion,” IRE Trans. Inform. Theory, vol. IT-6, pp. 7-12, Mar. 1960. R. E. Crochiere, L. R. Rabiner, N. S . Jayant, and J. M. Tribolet, “A study of objective measures for speech waveform coders,” in I978 Proc. Zurich Seminar on Digital Commun., Zurich, Switzerland,Mar. 1978, pp. Hl.1-Hl.7. B. S. Atal and M. R. Schroeder, “Predictive coding of speech signals and subjective error criteria,” in I978 Proc. IEEE Znt. Conf. Acoustics,Speech, Signal Processing, Tulsa, OK, Apr. 10-12, 1978, pp. 573-576. M. Berouti and J. Makhoul, “High quality adaptive predictive coding of speech,” in 1978 Proc. IEEE Int. Con$ Acoustics, Speech, Signal Processing, 1978, Tulsa, OK, Apr. 10-12, 1978, pp. 303-306. A. H. Gray, Jr. and J. D. Markel, “Quantization and bit allocation in speech processing,” IEEE Dam.Acoust.,Speech, Signal Processing, vol. ASSP-24, pp. 459-473, Dec. 1976. R. Viswanathanand J. Markhoul,“Quantizationproperties of transmissionparameters in linear predictive systems,” IEEE Trans. Acoust., Speech, Signal Processing, vol. ASSP-23, pp. 309-321, June 1975. A. V. Oppenheim and D. H. Johnson, “Discrete representation of signals,”Proc. IEEE, vol. 60, pp. 681-691, June 1972. H. Gethoffer, “Polar plane block quantization of speech signals using bit-pattern matching techniques,” in 1977 Proc. IEEE Int. C0n.f. Acoust., Speech, Signal Processing, Hartford, CT, May 911, i977, pp. 200-203. D.Esteban. C.Galand. D. Mauduit. and J . Menez. “9.6/7.2 kbitsis voice excited predictive coder (VEPC),” in 1978 Proc. IEEE Int. Con$ Acoust., Speech, Signal Processing, Tulsa, OK, Apr. 10-12, 1978,pp. 307-311. B. Gold, “Variable rate speech processing,” presented at the 1978 Int. Conf. Digital Signal Processing, Florence, Italy, Sept. 1978. D. J. Goodman, C. Scagliola, R. E. Crochiere, L. R. Rabiner, and J. Goodman, “Objective and subjective performance of tandem connections of waveform coders with an LPC vocoder,” Bell Syst. Tech. J . , vol. 58, Mar. 1979, pp. 601-629. R. Zelinski and P. Noll, “Adaptive block quantization of speech signals,” (in German) Heinrich-Hertz-Institute, Berlin, Germany, Tech. Rep. 181,1975. -, “Approaches to adaptive transform speech coding at low bit rates,’’ IEEE Trans. Acoust., Speech, Signal Processing, vol. ASSP-27, pp. 89-95, Feb. 1979. J. L. Flanagan, Speech Analysis Synthesis and Perception. New York: Springer-Verlag, 1972. R. E. Crochiere, “A novel approach for implementing pitch prediction in sub-band coding,” in 1979 Proc. IEEE Int.Conf. Acoust., Speech, Signal Processing, Washington, DC, Apr. 2-4, 1979, pp.526-529. A . J. Barabell and R. E. Crochiere “Sub-band coder design incorporating quadrature filters andpitch prediction,” in 1979 Roc. IEEE Int. Con6 Acoust., Speech, Signal Processing, Washington, DC, Apr. 2-4,1979, pp. 530-533. J. L. Flanagan et al., “Speech coding,” IEEE Ffans. Commun., vol. COM-27, pp. 710-737, Apr. 1979.