Mar 5, 2007 - diffraction phase microscopy ... complex fluids at the microscopic scale.2â4 By mea- ... slide as the focus of the microscope objective was ad-.
April 1, 2007 / Vol. 32, No. 7 / OPTICS LETTERS
811
Fresnel particle tracing in three dimensions using diffraction phase microscopy YongKeun Park and Gabriel Popescu G. R. Harrison Spectroscopy Laboratory, Massachusetts Institute of Technology, Cambridge, Massachusetts 02139, USA
Kamran Badizadegan Department of Pathology, Harvard Medical School and Massachusetts General Hospital, Boston, Massachusetts 02114, USA
Ramachandra R. Dasari and Michael S. Feld G. R. Harrison Spectroscopy Laboratory, Massachusetts Institute of Technology, Cambridge, Massachusetts 02139, USA Received November 2, 2006; revised January 6, 2007; accepted January 9, 2007; posted January 16, 2007 (Doc. ID 76705); published March 5, 2007 We have developed a novel experimental technique for tracking small particles in three dimensions with nanometer accuracy. The longitudinal positioning of a micrometer-sized particle is determined by using the Fresnel approximation to describe the transverse distribution of the wavefront that originated in the particle. The method utilizes the high-sensitivity quantitative phase imaging capability of diffraction phase microscopy recently developed in our laboratory. We demonstrate the principle of the technique with experiments on Brownian particles jittering in water both in bulk and in the vicinity of a boundary. The particles are localized in space within an error cube of 20 nm⫻ 20 nm⫻ 20 nm for a 33 Hz acquisition rate and 20 s recording time. © 2007 Optical Society of America OCIS codes: l80.3170, l80.6900.
Biological cells are complex structures with multiple characteristic time and length scales.1 The ability to measure locally how a cellular component responds to an applied shear stress at short-time and small displacements has a variety of applications. The mechanical properties of the cells and intracellular material determine the proper functioning of the living system. Recently a number of techniques have been developed for probing the rheological properties of complex fluids at the microscopic scale.2–4 By measuring the low-coherence light scattering from embedded microparticles, volumes of 0.1 pl can be investigated.5,6 The three-dimensional trajectories of embedded colloidal particles can be interpreted in terms of the viscoelastic properties of the surrounding medium.7 This approach has revealed new and unexpected behavior of cellular matter.8,9 However, particle tracking techniques typically rely on imaging the particle of interest in two dimensions and assuming that the material under investigation is isotropic, which is an idealization. Tracking microparticles in the full 3D space permits studying the physical properties of anisotropic media (e.g., cell mitotic spindles) and investigating surface effects at boundaries.10,11 In this Letter we present a new optical interferometry technique for imaging 3D particle trajectories with nanoscale accuracy. The method, referred to as Fresnel particle tracking (FPT), relies on quantifying the wavefront of the light scattered by the particle. To image the phase distribution of the scattered field, we employ diffraction phase microscopy12 (DPM) in an inverted microscope imaging geometry.13 DPM is the common path version of Hilbert phase microscopy,14,15 which uses a spatial Hilbert trans0146-9592/07/070811-3/$15.00
form to obtain a quantitative phase image from a single interferogram. Thus, DPM provides quantitative phase maps with a stability of less than 1 nm optical path length at arbitrary time scales.13 Using DPM, we imaged 2 m diameter polystyrene beads suspended in water undergoing Brownian motion. The goal was to infer the longitudinal position (z axis) of the bead with respect to the plane of focus from the quantitative phase image. To retrieve the z position we used the algorithm shown in Fig. 1. Modeling the bead as a phase object, the in-focus field associated with the bead is UF, where its phase, F, takes into account the spherical profile of the particle
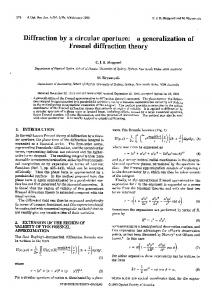
Fig. 1. Algorithm for retrieving the z position of a particle from the x–y distribution of the scattered wavefront. © 2007 Optical Society of America
812
OPTICS LETTERS / Vol. 32, No. 7 / April 1, 2007
(step 1 in Fig. 1). When the particle is out of focus by a distance z, the field at the image plane can be obtained from the Fresnel equation, which is essentially a convolution operation between the in-focus field UF and the Fresnel wavelet, UW (steps 2–4), US共x,y;z兲 ⬀
冕冕
UF共x⬘,y⬘兲UW共x − x⬘,y − y⬘ ;z兲dx⬘dy⬘ . 共1兲
We numerically simulate a set of fields US for various values of z and obtain the respective 2D phase distributions, S (step 5). Experimentally, DPM provides
Fig. 2. (Color online) a, Measured phase distribution of the light scattered from the bead. b, Simulated wavefront distributions for various values of the particle position, z. c, Result of the 2D cross correlations between the phase in a and each of the simulated phases in b. The cross correlation of highest value provides the value of z0.
the phase image associated with the particle at the unknown position z0 (steps 6 and 7). To find z0, we cross correlate the measured and simulated phase distributions (step 8) and identify the value of z for which the cross correlation attains a maximum value. This process is depicted in Fig. 2. To demonstrate this procedure, we first measured the z positions of a particle fixed on a microscope slide as the focus of the microscope objective was adjusted manually (Fig. 3a). It can be seen that our algorithm correctly retrieves the position of the bead with respect to the in-focus plane. The existing errors are largely due to the imprecision in the manual focus adjustment. Figure 3b shows the measured 3D trajectory of 660 positions for a bead undergoing Brownian motion in water. The bead positions were retrieved from the DPM images measured at the rate of 33 Hz for 20 s. In the image plane, a CCD pixel corresponds to 80 nm in the sample plane. However, using pixel interpolation, we extracted the x–y position of the particle with precision better than this value. The overall precision of the particle z-axis position is defined by the stability of the DPM phase imaging. To asses the stability of our measuring system and, therefore, the overall robustness of our algorithm, we recorded the trajectory of a bead that is fixed on a coverslip. Remarkably, as shown in Fig. 3c, the retrieved position is confined to a 20⫻ 20⫻ 20 nm3 volume (approximately 10−5 fl). Figure 3d shows the histogram of the rms z positions that have a mean value of approximately 11 nm. From the measured trajectories of beads suspended in water, we obtained the mean-squared dis-
Fig. 3. (Color online) a, Retrieved and expected z positions for a bead affixed to a microscope slide as the focus is adjusted. b, 3D trajectories of a 2 m diameter bead under Brownian motion in water (red circles) and affixed to a cover glass (blue cross). c, Retrieved trajectory for the fixed bead in b. d, Histogram of z-axis rms displacement for the fixed bead.
April 1, 2007 / Vol. 32, No. 7 / OPTICS LETTERS
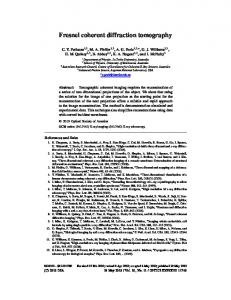
placement, defined as MSD= 关r共t + 兲 − r共t兲兴2, with r the position vector and the horizontal overbar indicating time average. Figure 4a depicts the MSD dependence on the time delay for each coordinate x, y, z and for the total displacement. The individual component MSD is defined as MSD = 关共t + 兲 − 共t兲兴2, where = x , y , z, and MSD= 兺MSD. The solid line indicates the fit to the equation MSD= D, where the diffusion coefficient D is given by the Stokes– Einstein equation,16 D = kBT/3d.
共2兲
In Eq. (2), kB is the Boltzmann constant, T is the absolute temperature (295 K throughout our experiments), is the water viscosity, and d the particle diameter. Using the viscosity as the fit parameter, we obtain = 1.051± 0.005 cP, which agrees very well with the expected value of 1.002 cP. This demonstrates the ability of FPT to measure physical properties of fluids at microscopic scales. In the proximity of physical boundaries, particles under Brownian motion experience anisotropic behavior; i.e., the displacements along different directions are statistically different. We used FPT to analyze the motion of a bead moving in the immediate vicinity of the microscope slide. Figure 4b shows the MSD associated with the y and z axes of this particle. As expected, the surface appears to limit the motion of the bead, as indicated by the bending in the z-axis MSD shown after a time delay of approximately 4 s. The MSD after = 4 s also indicates a linear trend,
813
but with smaller slope, which is an indication of a diffusion coefficient Dz lower than in bulk. Interestingly, the y-axis motion seems to be characterized by a diffusion coefficient Dy larger than in bulk. These results establish that FPT can be used to provide information about 3D particle tracking, which allows studying various phenomena that take place in anisotropic media. In summary, we developed Fresnel particle tracking as a novel technique for particle tracking in the 3D space and with nanoscale precision. We anticipate that FPT will help gain a better understanding of the viscoelastic properties of cellular matter at the microscopic scale. Probing beads can be both engulfed within cells and conjugated to cell membranes, which will enable FPT to study various phenomena at the cellular and subcellular level. However, cells are both anisotropic and scattering media, which may render the FPT measurement more difficult. We showed here that FPT correctly reports the anisotropy of bead motion in the vicinity of a surface Fig. 4b. Nevertheless, light scattered by cellular components may interfere with the light originating in the bead. We anticipate that using beads of high refractive index will make the particle scattering dominant, thus alleviating this problem. This research was carried out at the Laser Biomedical Research Center, G. R. Harrison Laboratory, Massachusetts Institute of Technology, and was partially supported by National Institutes of Health grant P41 RR 02594 and by Hamamatsu Photonics K.K. References
Fig. 4. (Color online) a, Total and individual axis MSD for Brownian particle in water, as indicated. b, The y and z axis MSD for a particle embedded in water, in the vicinity of the cover glass.
1. L. H. Deng, X. Trepat, J. P. Butler, E. Millet, K. G. Morgan, D. A. Weitz, and J. J. Fredberg, Nat. Mater. 5, 636 (2006). 2. F. C. MacKintosh and C. F. Schmidt, Curr. Opin. Colloid Interface Sci. 4, 300 (1999). 3. T. A. Waigh, Rep. Prog. Phys. 68, 685 (2005). 4. G. Popescu and A. Dogariu, Eur. Phys. J.: Appl. Phys. 32, 73 (2005). 5. G. Popescu and A. Dogariu, Opt. Lett. 26, 551 (2001). 6. G. Popescu, A. Dogariu, and R. Rajagopalan, Phys. Rev. E 65 041504 (2002). 7. T. Gisler and D. A. Weitz, Curr. Opin. Colloid Interface Sci. 3, 586 (1998). 8. Y. Tseng, T. P. Kole, and D. Wirtz, Biophys. J. 83, 3162 (2002). 9. A. Caspi, R. Granek, and M. Elbaum, Phys. Rev. E 66, 011916 (2002). 10. M. Speidel, A. Jonas, and E. L. Florin, Opt. Lett. 28, 69 (2003). 11. F. Chasles, B. Dubertret, and A. C. Boccara, Opt. Lett. 31, 1274 (2006). 12. G. Popescu, T. Ikeda, R. R. Dasari, and M. S. Feld, Opt. Lett. 31, 775 (2006). 13. Y. K. Park, G. Popescu, K. Badizadegan, R. R. Dasari, and M. S. Feld, Opt. Express 14, 8263 (2006). 14. T. Ikeda, G. Popescu, R. R. Dasari, and M. S. Feld, Opt. Lett. 30, 1165 (2005). 15. G. Popescu, T. Ikeda, C. A. Best, K. Badizadegan, R. R. Dasari, and M. S. Feld, J. Biomed. Opt. 10, 060503 (2005). 16. A. Einstein, Ann. Phys. 17, 549 (1905).