Developmental Psychology 2010, Vol. 46, No. 1, 220 –229
© 2010 American Psychological Association 0012-1649/10/$12.00 DOI: 10.1037/a0016690
Do Children Profit From Looking Beyond Looks? From Similarity-Based to Cue Abstraction Processes in Multiple-Cue Judgment Bettina von Helversen
Rui Mata
Max Planck Institute for Human Development and University of Basel
University of Lisbon
Henrik Olsson Max Planck Institute for Human Development The authors investigated the ability of 9- to 11-year-olds and of adults to use similarity-based and rule-based processes as a function of task characteristics in a task that can be considered either a categorization task or a multiple-cue judgment task, depending on the nature of the criterion (binary vs. continuous). Both children and adults relied on similarity-based processes in the categorization task. However, adults relied on cue abstraction in the multiple-cue judgment task, whereas the majority of children continued to rely on similarity-based processes. Reliance on cue abstraction resulted in better judgments for adults but not for children in the multiple-cue judgment task. This suggests that 9- to 11-year-olds may have defaulted to similarity-based processes because they were not able to employ a cue abstraction process efficiently. Keywords: categorization, multiple-cue judgment, cognitive development, similarity, cue abstraction
teristics of the objects) and the criterion that is judged, such as “dogs that bark, don’t bite,” to assess the threat posed by the animal (e.g., Ashby, Alfonso-Reese, Turken, & Waldron, 1998; Erickson & Kruschke, 1998; Nosofsky, Palmeri, & McKinley, 1994). This cue abstraction process can be described by a linear additive model such as multiple linear regression, which has been shown to capture human performance in a number of multiple-cue judgment tasks (e.g., Brehmer, 1994; Cooksey, 1996; Juslin, Olsson, & Olsson, 2003). But can children rely on both types of processes when making judgments? The ability to make accurate judgments and decisions develops with age (e.g., Bereby-Meyer, Assor, & Katz, 2004; Davidson, 1991; Krascum & Andrews, 1993; Lafon, Chasseigne, & Mullet, 2004). Although adults have been found to switch between the use of similarity-based and cue abstraction processes as a function of task characteristics (Juslin, Olsson, & Olsson, 2003; but see Karlsson, Juslin, & Olsson, 2008, for a discussion of situations in which process switching is not automatic), the ability of children to rely on cue abstraction processes may be constrained. For instance, it has been argued that young children tend to rely more heavily on similarity-based processes in both categorization and induction tasks (e.g., Fisher & Sloutsky, 2005; Sloutsky, Kloos, & Fisher, 2007), whereas complex rule use develops later in adolescence (Bunge & Zelazo, 2006; Kloos & Sloutsky, 2008). In this study, we investigated the ontogeny of similarity-based and cue abstraction processes by having 9- to 11-year-olds and adults solve a task that is either a categorization task or a multiple-cue judgment task, depending on the nature of the criterion (binary vs. continuous). We thus aimed to assess potential factors underlying judgment deficits children exhibited when relying on similarity-based and cue abstraction processes.
Humans can rely on multiple sources of information and processes when making judgments, such as the danger posed by a given dog. For one, humans can rely on similarity-based processes; that is, they can use the similarity of a particular dog to previously encountered dogs to judge the threat and, ultimately, to make the decision either to flee or to pet the dog in question. Similarity-based processes based on exemplar memory seem to underlie human judgment in a variety of categorization tasks (e.g., Juslin, Olsson, & Olsson, 2003; Kruschke, 1992; Nosofsky & Johansen, 2000). According to exemplar theories, objects are categorized on the basis of their similarity to known exemplars: An object to be categorized is compared with other objects in memory and placed in the category whose members it most resembles. The similarity between two objects is determined by the overlap of features weighted by the attention allocated to them. Alternatively, humans can use rules specifying the relationship between the cues (i.e., the charac-
Bettina von Helversen, Center for Adaptive Behavior and Cognition, Max Planck Institute for Human Development, Berlin, Germany, and Department of Psychology, University of Basel, Basel, Switzerland; Rui Mata, Department of Psychology, University of Lisbon, Lisbon, Portugal; Henrik Olsson, Center for Adaptive Behavior and Cognition, Max Planck Institute for Human Development, Berlin. This work has been supported by a doctoral fellowship of the International Max Planck Research School LIFE and by German Research Foundation Grant RI 1226/5 to Bettina von Helversen. We thank Yee lee Shing and Linnea Karlsson for their helpful comments on an earlier version of the manuscript. We are grateful to Julia Schooler for editing a draft of this article. Correspondence concerning this article should be addressed to Bettina von Helversen, University of Basel, Department of Psychology, Missionsstrasse 62a, 4055 Basel, Switzerland. E-mail:
[email protected] 220
THE DEVELOPMENT OF CUE ABSTRACTION IN JUDGMENT
From Similarity-Based to Cue Abstraction Processes Adults can make use of both similarity-based and cue abstraction processes as a function of task structure. For example, Juslin, Olsson, and Olsson (2003) found that feedback quality can play a major role in determining the type of process underlying multiplecue judgments: When learning the toxicity of insects, participants who received binary information about the toxicity of each insect (toxic vs. harmless) relied on similarity-based processes, and those who received more fine-grained information about each insect’s toxicity (i.e., level of poison) used cue abstraction processes. These results suggest that the enhanced quality of the feedback in the continuous condition allowed the abstraction of rules connecting the cues to the criterion and that the relatively poor feedback in the categorization task forced participants to rely on the similarity to the training exemplars. Can children rely on cue abstraction processes in such judgment tasks, or must they default to similarity-based processes? Piaget (1952) theorized that logical, formal operations are difficult for children younger than 11 years of age. Empirical work suggests that children rely heavily on similarity-based processes in both categorization and induction (Boswell & Green, 1982; Fisher & Sloutsky, 2005; Sloutsky et al., 2007; but see Wilburn & Feeney, 2008) and have difficulties integrating information across several cues in inference tasks (e.g., Bereby-Meyer et al., 2004; Lafon et al., 2004). Possibly, cue abstraction processes require controlled processing that puts high demands on cognitive capacities such as working memory (DeCaro, Thomas, & Beilock, 2008; Juslin, Jones, Olsson, & Winman, 2003; but see Juslin, Karlsson, & Olsson, 2008, for a discussion of the role of controlled processing in cue abstraction and similarity-based processes), which develops fully only in adolescence. This idea matches the view that complex rule use develops late in ontogenetic time due to late maturation of specific prefrontal brain structures (Bunge & Zelazo, 2006); thus, it could be difficult for preteenage children to master. The existing evidence nevertheless suggests that rule use is not completely off-limits to young children (Bunge & Zelazo, 2006; Gelman & Waxman, 2007). Two-year-olds have been found to use category labels in inductive inference (Gelman & Coley, 1990). Montanelli (1972) showed that third graders can already integrate several pieces of information in a linear additive manner—albeit less efficiently than can seventh or ninth graders. Similarly, Lafon et al. (2004) reported the use of linear additive rules by children despite wide age differences and nonstandard cue relations (i.e., negative). All in all, these results suggest that age differences in judgment tasks might be due to deficient rule use brought about by, for example, children’s difficulties in attributing correct weights to cues (Lafon et al., 2004), rather than complete reliance on similarity-based processes. In the present study, we addressed these issues in a multiple-cue judgment task.
The Present Study We adapted the multiple-cue judgment task used by Juslin, Olsson, and Olsson (2003) to explore age differences in the use of similarity-based and cue abstraction processes as a function of task structure. The specific aspect of task structure that we manipulated was the nature of the criterion, which was either binary, creating a categorization task, or continuous, creating a multiple-cue judg-
221
ment task. Through formal modeling of children and adults’ cognitive processes in these tasks, we wanted to find out whether children (9- to 11-year-olds) would rely more on similarity-based processes, even in conditions where adults typically apply cue abstraction processes (multiple-cue judgment task). We thus aimed to explore whether reliance on similarity-based versus cue abstraction processes could account for age differences in judgment performance. Furthermore, we were interested in determining whether 9- to 11-year-olds were able to go beyond similarity-based processes and efficiently rely on cue abstraction processes that supposedly develop later in ontogenetic time (e.g., Lafon et al., 2004; Sloutsky et al., 2007).
Method Participants Participants in the study were 50 children (Mage ⫽ 10.22 years, range ⫽ 8.6 –11.1 years; 52% female) and 50 adults (Mage ⫽ 24.92 years, range ⫽ 19 –33 years; 54% female). Children were third and fourth graders recruited from Berlin elementary schools in a middle-class neighborhood. Of the adults, 84% were students from one of the Berlin universities and had, on average, 2.5 years of university education; 12% had received a master’s degree and 4% had graduated from a Realschule.1 Most participants were Caucasian. Participation took an average of 40 min for adults and 1 hr for children. Participants received a performance-contingent payment (M ⫽ €15, including a €5 show-up fee).
Design and Material The design consisted of two between-subjects factors: task (binary vs. continuous criterion) and age-group (children vs. adults). The participants’ task was to find out how well fictitious characters, the Sonics, performed in a game in which each Sonic needed to catch as many Golbis as possible. In the binary task, participants needed to classify each Sonic as a successful or an unsuccessful hunter. In the continuous task they needed to estimate how many Golbis a Sonic had caught. The Sonics varied on four cues (hair, nose, ears, and belly), which could be used to predict how well they would perform in the game.2 Each cue could have two features (e.g., the belly was either green or blue, and the hair had spikes or dreadlocks). The number of Golbis a Sonic caught varied between 10 and 20 and was determined as a linear function of the cues (for a similar task, see Juslin, Olsson, & Olsson, 2003; Juslin, Jones, et al., 2003), C ⫽ 10 ⫹ 4c1 ⫹ 3c2 ⫹ 2c3 ⫹ 1c4 ,
(1)
where C is the criterion in the continuous task and c1 to c4 are the cue values, which could either be “one” or “zero” (see Table 1). In 1 The Realschule is a type of secondary school in Germany that does not prepare students for a university education. 2 In a pilot test, 66 participants (mean age ⫽ 13.5 years) rated the similarity of all possible pairs of Sonics. To see if the cues were equally salient, we calculated the mean similarity of all pairs of Sonics that differed only on the respective cue. The mean (SD) similarity for the four cues was 5.85 (0.26), 5.52 (0.27), 5.30 (0.33), and 5.33 (0.31), which indicated that the cues were perceived as approximately equally salient.
222
VON
HELVERSEN, MATA, AND OLSSON
Table 1 Structure of the Task Cue 1
Cue 2
Cue 3
Cue 4
Continuous criterion
0 0 0 0 0 0 0 0 1 1 1 1 1 1 1 1
0 0 0 0 1 1 1 1 0 0 0 0 1 1 1 1
0 0 1 1 0 0 1 1 0 0 1 1 0 0 1 1
0 1 0 1 0 1 0 1 0 1 0 1 0 1 0 1
10 11 12 13 13 14 15 16 14 15 16 17 17 18 19 20
Note.
Binary criterion 0 0 0 0 0 0 .5 1 0 .5 1 1 1 1 1 1
Training/test Test Training Test Test Training Test Test Test Training Test Training Test Test Training Training Test
Training items appeared during the training and test. The test items appeared only during the test.
the binary task, the probability with which each Sonic was categorized as successful or unsuccessful was determined on the basis of the continuous criterion; Sonics with criterion values above 15 were classified as successful, and those with criterion values below 15 were classified as unsuccessful. The assignment of cue weights to the four cues, as well as of the cue values to the features, was randomly determined.
Procedure The task consisted of a training phase and a test phase. In the training phase, a training set consisting of 6 of the 16 Sonics was repeatedly presented (see Table 1). The 6 Sonics used in the training set were selected so that the exemplar and cue abstraction models made different predictions for the new objects in the test phase, given the assumption that the two models were applied without error.3 To minimize age differences due to learning speed and to reduce the impact of training performance on test performance, we terminated training after the 8th block if an accuracy criterion was reached. The accuracy criterion was reached if the root mean square deviation (RMSD) between participants’ responses and the criterion values in one block sank below 0.5 in the binary task (corresponding to a correct classification of 5 out of 6) and below 1.5 in the continuous task (corresponding to an average error of less than 1.5 Golbis). If the accuracy criterion was not met in training blocks 8 to 13, training terminated after the 13th block.4 In the test phase, all 16 Sonics were presented twice; thus, training required a total of 32 judgments. Payment was performance dependent: In the binary task, participants received 10 points for a correct answer and 0 points for an incorrect answer; in the continuous task, participants received 10 points for a correct answer, 5 points if they deviated by 1, and 0 points if they deviated by more than 1. After the experiment, points were converted into euros, with an exchange rate of €.5 for every 100 points. Participants were paid an extra €3 if they reached the accuracy criterion within the 13 blocks. To motivate participants to try hard during the test set, where no feedback was provided, we introduced an additional bonus of €4 if they reached an accuracy
criterion in the test set. The cover story for this accuracy criterion was that from the 32 Sonics (each of the 16 Sonics was presented twice) evaluated in the test set, the 16 Sonics judged to be the most successful hunters would form a team and play against the remaining 16 Sonics. We calculated the performance of each team using Equation 1 on the basis of the characteristics of the selected Sonics, such that the team that caught more Golbis won. If their team won, participants received the additional €4. The participants were introduced to the Sonics in a familiarization task: One of the 6 training Sonics was presented, and participants were asked to memorize it. All 16 possible Sonics were then presented, and participants selected the memorized Sonic. The familiarization task was repeated until participants had correctly recognized each of the training Sonics twice. Afterward, the 6 training Sonics were presented to the participants with their criterion values. The experimental part of the study began with the extensive training phase, which consisted of 8 –13 blocks. In each block, the training Sonics were presented in random order. In each trial of the training phase participants were asked to judge the performance of a training Sonic. After giving their response they received feedback about their performance, the correct criterion value, and the points they had earned. Participants did not receive feedback during the test phase. After performing the decision task, participants completed a verbal knowledge test (Lehrl, 1999) and two measures of fluid abilities (Wechsler, 1981), the digit symbol substitution task and the digit span task (forward and backward), that we do not address in this paper.
3 The model predictions were generated by fitting the free parameters of the models to the training set to reflect an error-free learning of the training set. The estimated parameter values were then used to generate model predictions for the test set. 4 We restricted training to 13 blocks, because the pilot test showed that more training trials did not lead to better performance in children. This was probably due to attention problems, as children could not concentrate on the task any longer and their performance decreased.
THE DEVELOPMENT OF CUE ABSTRACTION IN JUDGMENT
223
children for old items, t(48) ⫽ 2.61, p ⫽ .01, d ⫽ 0.73, but the age difference in accuracy for new items only approached significance, t(48) ⫽ 1.89, p ⫽ .06, d ⫽ 0.54. However, these age differences were not significant once accuracy in training had been added as a covariate: old, F(1, 47) ⫽ 1.5, MS ⫽ 1.26, p ⫽ .23, 2p ⫽ .03; new, F(1, 47) ⫽ 2.32, MS ⫽ 1.81, p ⫽ .14, p2 ⫽ .05.
Results Participants’ Performance Training. We assessed participants’ performance by the accuracy of participants’ judgments, measured by the RMSD between judgments and the criterion values. Performance at the end of the training—the last block of training each participant experienced— differed between age-groups, despite our attempts to equate performance by allowing children more learning trials (for means and SDs, see Table 2), binary task, t(48) ⫽ 1.96, p ⫽ .05, d ⫽ 0.53; continuous task, t(48) ⫽ 2.97, p ⬍ .01, d ⫽ 0.84. Furthermore, age differences were more pronounced in the continuous task. In the binary task, all but 1 child reached the accuracy criterion. In the continuous task, 11 children and 3 adults failed to reach the criterion. An analysis of variance with age-group and task as between-subjects factors and the number of training blocks that each participant needed as the dependent variable showed a significant effect of age-group, F(1, 96) ⫽ 25.36, mean square (MS) ⫽ 59.29, p ⫽ .001, 2p ⫽ .21; a significant effect of task, F(1, 96) ⫽ 32.37, MS ⫽ 75.69, p ⫽ .001, 2p ⫽ .25; and an interaction between task and age– group, F(1, 96) ⫽ 8.66, MS ⫽ 20.25, p ⫽ .01, 2p ⫽ .08. This analysis indicated that age differences were greater in the continuous task. Because we found age differences in training and these could potentially affect our conclusions, we additionally conducted all subsequent analyses controlling for accuracy in the last block of training. However, for the sake of clarity, throughout the paper, we report results from these additional analyses only for the subset that showed that controlling for training performance had an effect on the results. Test. Performance during the test set was measured as the RMSD between participants’ judgments and the criterion values. Means and standard deviations are reported in Table 2. Because effects of differences in the choice of processes would be particularly expected for new test objects, we separated the test objects into old items (i.e., Sonics that had appeared during training) and new items (i.e., Sonics that had not appeared during training). In the binary task, adults were more accurate than children for the old items, t(48) ⫽ 5.71, p ⫽ .001, d ⫽ 1.64, but no significant age differences emerged for the new test items, t(48) ⫽ 1.60, p ⫽ .12, d ⫽ 0.50. In the continuous task, adults were more accurate than
Formal Modeling of Cognitive Processes Model fits. We adopted a formal modeling approach to determine which processes underlay participants’ judgments. In particular, we fitted an exemplar model and a cue abstraction model to the responses of each individual participant (see Appendix A for mathematical formulations of the models). For both models we conducted a leave-one-out cross-validation procedure (Stone, 1974) and relied on the RMSD between the model prediction and the participants’ responses as a goodness-of-fit criterion. Crossvalidation is a satisfactory method for dealing with the problem of overfitting, because it requires prediction. Complex models can often provide better fits to data than can simpler models, even when the latter are better descriptions of the process underlying the data generation, because complex models have enough flexibility to fit both systematic and random variance (Pitt, Myung, & Zhang, 2002; Roberts & Pashler, 2000). On the other hand, simpler models usually fare better in prediction, because they capture the underlying process rather than unsystematic variance in the data. Cross-validation works by splitting the data into a calibration set and a validation set. Model parameters are estimated by fitting the model to the calibration set; the estimated parameters are used to make predictions concerning the validation set, and these predictions are compared to participants’ actual responses to obtain a measure of prediction error. In our study, we estimated the models’ free parameters by fitting the models to 15 items of the test set and then predicted the response for the 16th object on the basis of the estimated parameter values. This process was repeated for all objects. The goodness of fit was determined as the RMSD between the 16 predicted model responses and the participants’ responses (averaged across the responses to the two presentations of each test object). We estimated four free parameters for the exemplar model (an attention weight s for each cue, constrained to add to one, and the
Table 2 Mean (SD) Participant Performance in Training and Test by Age-Group and Task Age-group Adults Performance Training Number of blocks RMSD: Last training block Test RMSD: Old RMSD: New RMSD: Total Note.
Children
Binary task (n ⫽ 25)
Continuous task (n ⫽ 25)
Binary task (n ⫽ 25)
Continuous task (n ⫽ 25)
8.04 (0.20) 0.07 (0.15)
8.88 (1.69) 0.76 (1.14)
8.68 (1.41) 0.17 (0.22)
11.32 (2.12) 1.80 (1.32)
0.14 (0.19) 0.54 (0.11) 0.45 (0.09)
1.87 (1.05) 3.04 (1.06) 2.72 (0.90)
0.46 (0.20) 0.60 (0.13) 0.56 (0.12)
2.63 (1.02) 3.51 (0.64) 3.25 (0.63)
RMSD ⫽ root mean square deviation.
224
VON
HELVERSEN, MATA, AND OLSSON
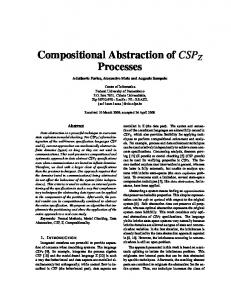
sensitivity parameter h). These were estimated by a nonlinear least squares fit, with the training set assumed as a knowledge base.5 We obtained parameter estimates for the cue abstraction model in the binary condition with a nonlinear least squares fit, with the parameter values of a logistic regression as the starting values. In the continuous task, we calculated parameter values analytically by running a multiple linear regression on participants’ responses. On average, both models fit adults and children rather well. In the binary task, the exemplar model fit the participants better (M ⫽ 0.35 RMSD, SD ⫽ 0.15) than did the cue abstraction model (M ⫽ 0.38 RMSD, SD ⫽ 0.18, Wilcoxon Z test ⫽ ⫺2.52, p ⫽ .01). In the continuous condition, the models fit judgments equally well (exemplar model, M ⫽ 1.89 RMSD, SD ⫽ 0.58; cue abstraction model, M ⫽ 1.91 RMSD, SD ⫽ 0.65, Z ⫽ ⫺0.10, p ⫽ .92). Table 3 reports the average model fit by environment and age-group. The RMSDs for all individuals can be found in Appendix B. Participant classification. To investigate age differences in cognitive processing, we classified participants by assigning each participant to the model that had the lower RMSD, given that the difference between the model fits was higher than one standard error of the mean model fits in each environment. We introduced this threshold because, in some cases, both models fit a participant about equally well.6 We excluded the participants who could not be unambiguously classified from the further analyses. In the binary condition, 6 children and 3 adults were excluded. In the continuous condition, 5 children and 5 adults were excluded. As illustrated in Figure 1, the majority of children and adults were better described by the exemplar model in the binary task. In contrast, in the continuous task, the majority of adults but not children (albeit more children than in the binary task) were classified as relying on cue abstraction. To analyze whether the cognitive processes of children and adults changed depending on the task, we ran chi-square tests in each age-group. The tests indicated that the task affected model choice for adults, 2(1, N ⫽ 42) ⫽ 4.63, p ⫽ .03, but not for children, 2(1, N ⫽ 39) ⫽ .04, p ⫽ .84. Cognitive processing and performance. Can differences in the choice of cognitive processes explain age differences in judgment performance? To answer this question, we ran an analysis of variance with accuracy for the new objects as the dependent variable and age-group and model choice as independent variables in each task condition. We chose the new items because the strongest impact of model choice on judgment accuracy should be expected there. Although both models allow for accurate learning of the training objects, they predict different judgments for the new
Figure 1. Percentage of participants best described by the exemplar model or the cue abstraction model by age-group and task.
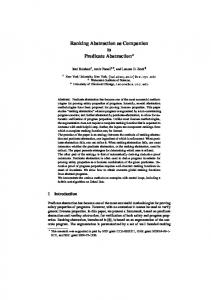
objects (see Juslin, Olsson, & Olsson, 2003). In the binary task (see Figure 2, left panel), neither age-group nor model choice had a significant impact on accuracy ( ps ⬎ .34). In the continuous task, however, there was a main effect of age-group, F(1, 36) ⫽ 4.47, MS ⫽ 2.36, p ⫽ .04, 2p ⫽ .11, and a significant interaction between age-group and model choice, F(1, 36) ⫽ 6.79, MS ⫽ 3.61, p ⫽ .01, 2p ⫽ .16.7 As illustrated in Figure 2 (right panel), the interaction suggests that children using the exemplar model performed as well as adults using the exemplar model (Madults ⫽ 3.39, SD ⫽ 0.35 vs. Mchildren ⫽ 3.28, SD ⫽ 0.44), t(19) ⫽ 0.65, p ⫽ .52, d ⫽ 0.30, but that children using a cue abstraction process performed worse than adults using a cue abstraction process (Madults ⫽ 2.62, SD ⫽ 1.15 vs. Mchildren ⫽ 3.72, SD ⫽ 0.62), t(17) ⫽ 2.44, p ⫽ .03, d ⫽ 1.01. Also, although difference in performance did not reach conventional levels of significance, children tended to perform worse when relying on cue abstraction than on exemplar-based processes (Mcue abstraction ⫽ 3.72, SD ⫽ 0.62 vs. Mexemplar ⫽ 3.28, SD ⫽ 0.44), t(18) ⫽ 1.88, p ⫽ .08, d ⫽ 0.93, and adults tended to perform worse when using exemplarbased processes (Mcue abstraction ⫽ 2.62, SD ⫽ 1.15 vs. Mexemplar ⫽ 3.39, SD ⫽ 0.35), t(12.21) ⫽ 2.11, p ⫽ .06, d ⫽ 0.87. Note that although children overall relied on similarity-based processes as successfully as did adults, they may have been less 5
Table 3 Average Model Fits (Mean RMSD and SD) by Age-Group and Task Task Binary
Continuous
Age-group
Exemplar model
Cue abstraction model
Exemplar model
Cue abstraction model
Children Adults
0.39 (0.07) 0.31 (0.19)
0.40 (0.15) 0.37 (0.20)
1.88 (0.53) 1.89 (0.65)
1.92 (0.57) 1.90 (0.72)
Note.
RMSD ⫽ root mean square deviation.
We also tested a version of the exemplar model with an additional free response scaling parameter, gamma (Nosofsky & Zaki, 2002). However, this version of the exemplar model performed worse in cross-validation. Thus, we report only the results for the exemplar model with ␥ ⫽ 1. 6 To check for the robustness of the classification, we also considered thresholds of two and three standard errors. These classifications provided similar results although with somewhat higher p values, due to the increasingly smaller sample sizes. This indicates that our findings based on the classification are robust. We conducted a model classification based only on the new test items as a further variant. This model classification was highly correlated to the classification based on the complete test set, r(70) ⫽ .75. The results from this classification indicated the same pattern but did not reach significance, probably due to the higher variance in the participants’ responses to the new test items. 7 Controlling for the accuracy during the training reduced the main effect of age-group to insignificance but did not affect the interaction.
THE DEVELOPMENT OF CUE ABSTRACTION IN JUDGMENT
Figure 2. Accuracy on the new objects in the test set by model choice and age-group. The results for the binary condition are shown in the left panel, and the results for the continuous condition are shown in the right panel. RMSD ⫽ root mean square deviation; SE ⫽ standard error.
accurate in storing the exemplars in memory. Children showed on average a lower sensitivity parameter (Mchildren ⫽ 19.63, SD ⫽ 14.45) than did adults (Madults ⫽ 38.58, SD ⫽ 17.59), t(48) ⫽ 4.16, p ⬍ .01, d ⫽ 1.18. This suggested that children had fuzzier memory traces than did adults (Nosofsky & Zaki, 1998). Last, to investigate why children performed worse than adults when relying on the cue abstraction model in the continuous task, we analyzed age differences in the importance given to the cues as captured by the cue weight parameters from the cue abstraction model (Cooksey, 1996). The literature suggests that children might find abstracting the weights a difficult task, resulting in an ineffective application of cue abstraction processes (Lafon et al., 2004; Montanelli, 1972). In line with this hypothesis we found that children relying on the cue abstraction model differed significantly from adults in the weight they assigned to the most important cue (Madults ⫽ 2.39, SD ⫽ 1.22 vs. Mchildren ⫽ 0.63, SD ⫽ 1.17), t(17) ⫽ 3.35, p ⬍ .01, d ⫽ 1.45. The difference in the weight assigned to the second most important cue did not reach significance, but there was a tendency for adults to give more weight to the cue than did children (Madults ⫽ 1.90, SD ⫽ 1.00 vs. Mchildren ⫽ 0.69, SD ⫽ 1.81), t(17) ⫽ 1.87, p ⫽ .08, d ⫽ 0.70. Children did not differ from adults in the weights assigned to the other cues ( ps ⬎ .18). The mean weights for the cues and the intercept are reported in Table 4. These data indicate that the adults weighted the cues in the order of their actual importance and that children gave more weight to the less important cues. We conducted an analysis comparing the relative weight participants gave to the most important cue with that given to the other three cues.
225
In particular, we compared the mean absolute weight that adults gave to the most important cue (M ⫽ 2.44, SD ⫽ 0.96) with that given to the other three cues (M ⫽ 1.78, SD ⫽ 0.58), t(10) ⫽ 2.01, p ⫽ .07, d ⫽ 1.26. Although not significant, the result showed that adults tended to give more weight to the most important cue. Children, on the other hand, tended to give more weight to the other three cues (M ⫽ 1.56, SD ⫽ 0.58) than to the most important cue (M ⫽ 0.77, SD ⫽ 1.07), t(7) ⫽ 1.43, p ⫽ .20, d ⫽ 1.26. To find out if the different weight that adults and children using a cue abstraction process gave to the most important cue would account for the age differences in the accuracy in the responses, we conducted a two-step regression analysis. In the first step we regressed age-group on the accuracy for the new items as a criterion; in the second step we added the parameter of the cue abstraction model representing the weight of the most important cue as a second predictor. This analysis showed that age-group significantly predicted the accuracy in judgments in the first step (R2 ⫽ .26,  ⫽ ⫺.51), t(17) ⫽ 2.44, p ⫽ .03. Adding the cue weight as a second predictor reduced the effect of age ( ⫽ ⫺.24), t(16) ⫽ ⫺0.94, p ⫽ .36 (see Table 5) and explained an additional 11% of the variance in accuracy (⌬R2 ⫽ .11), F(1, 16) ⫽ 2.79, p ⫽ .12. Thus, the ability to identify the best cue seems to have been a limitation in applying cue abstraction processes in the multiple-cue judgment task, and this fact can help explain age differences in how accurately the participants judged the new items. However, due to the small number of participants in this analysis, the results need to be interpreted with caution.
Discussion The results from the formal modeling of children’s and adults’ judgments suggest that although adults adapted their choice of cognitive processes to the tasks’ characteristics, children did not. A majority of 9- to 11-year-olds relied on similarity-based processes to solve both the categorization and the multiple-cue judgment tasks. In the categorization task, both adults’ and children’s judgments were best captured by an exemplar model. Furthermore, children performed as well as adults in categorizing new test items. This suggests that similarity-based categorizations can be mastered successfully by 9- to 11-year-olds. In contrast, in the multiple-cue judgment task, more adults relied successfully on cue abstraction processes, whereas the performance of the majority of 9- to 11year-olds was better captured by an exemplar model. Our findings resonate well with the idea that cue abstraction processes have higher cognitive demands than do similarity-based judgments (DeCaro et al., 2008; Juslin, Jones, et al., 2003) and that such demands can only be met later in ontogenetic time (Bunge & Zelazo, 2006; Kloos & Sloutsky, 2008). Our study also matches others show-
Table 4 Mean (SD) Cue Weights for the Participants Classified as Using the Cue Abstraction Model in the Continuous Condition Age-group
Intercept
Cue 1
Cue 2
Cue 3
Cue 4
Children Adults
15.00 (1.67) 12.41 (2.11)
0.63 (1.17) 2.39 (1.11)
0.69 (1.81) 1.90 (1.00)
1.25 (1.36) 1.07 (1.73)
⫺1.61 (1.35) ⫺0.51 (1.82)
Note.
nchildren ⫽ 9; nadults ⫽ 11.
226
VON
HELVERSEN, MATA, AND OLSSON
Table 5 Regression Analysis on the Accuracy for the New Objects for Participants Classified as Using the Cue Abstraction Model in the Continuous Condition Step Model 1 Age-group Model 2 Age-group Cue weight

t(df)
p
⫺.51
⫺2.44 (17)
.03
⫺.24 ⫺.43
⫺0.93 (16) ⫺1.67 (16)
.36 .12
Note. R2 ⫽ .37, N ⫽ 18. Cue weight denotes the parameter value for the cue with the highest weight as estimated from the cue abstraction model.
ing the importance of similarity-based processes for decision making and inference in children (Boswell & Green, 1982; Krascum & Andrews, 1993; Sloutsky, 2003; Sloutsky et al., 2007). In addition, our results extend previous work by suggesting that children age 9 –11 rely on similarity-based processes in a task in which adults typically rely on cue abstraction processes. Although adults relying on cue abstraction performed considerably better than did children relying on cue abstraction to solve the multiple-cue judgment task, children using an exemplar-based process performed as well as did adults using an exemplar-based process. Thus, although adults profited from “looking beyond looks,” children did not. One potential reason why children may not profit from relying on cue abstraction is that they are limited by strategy-utilization deficits (e.g., Miller, 1994; Siegler, 2000). Under this hypothesis, 9- to 11-year-olds may be starting to rely on both similarity-based and cue abstraction processes, but they may not be able to apply cue abstraction processes as efficiently as do adults. In line with this hypothesis, our results suggest that children performed worse when relying on cue abstraction processes because they had problems identifying and focusing on the most important pieces of information (Lafon et al., 2004; Mata, von Helversen, & Rieskamp, 2009; Miklich & Gillis, 1975; Montanelli, 1972), which is crucial for correctly applying the cue abstraction model. In turn, children’s failure to identify the correct cue weights may be related to learning deficits. Children had more difficulties learning to judge the criterion in the training set and performed worse than adults when judging both old and new items in the test phase. Controlling for individual differences in performance at the end of the training phase reduced these age differences at test, and this suggests that the successful mastering of the training phase through learning was indeed an important factor in determining judgment performance. Future studies using similar training procedures could likely profit from use of “rolling regression” methods (Lagnado, Newell, Kahan, & Shanks, 2006) to uncover children’s learning processes and possible limitations thereof. In this paper, we used a computational modeling approach to investigate the cognitive processes underlying multiple-cue judgments and categorization in two different age-groups. Our approach allowed us to distinguish between participants relying on similaritybased and cue abstraction processes and, in a next step, to investigate how reliance on these processes may determine age-related differences in performance. Computational modeling thus enabled us to go beyond directly observable behavior and examine the cognitive processes underlying estimation and categorization. As such, our results
suggest that computational modeling can help uncover differences between the cognitive processes of children and adults and that it is a powerful method for developmental research. One limitation of our study is that we relied on a fairly large age range of children (9 –11 years) but did not consider different age-groups within our sample, due to our small sample size. Most likely, there is considerable development in the use of similaritybased and cue abstraction processes from 9 to 11 years of age that we were not able to explore. A promising avenue for future research involves examining the development of categorization and inference processes from childhood to adolescence by considering separate age-groups. We hope that the insights and methodology advanced here can help guide these future efforts. In sum, 9- to 11-year-olds seem to rely more often on similaritybased processes than do adults. This preference for similaritybased processing was possibly due to difficulties in applying cue abstraction processes, and this implies that the ability to rely on complex rule-based processes develops during adolescence.
References Ashby, F. G., Alfonso-Reese, L. A., Turken, A. U., & Waldron, E. M. (1998). A neuropsychological theory of multiple systems in category learning. Psychological Review, 105, 442– 481. Bereby-Meyer, Y., Assor, A., & Katz, I. (2004). Children’s choice strategies: The effects of age and task demands. Cognitive Development, 19, 127–146. Boswell, D. A., & Green, H. F. (1982). The abstraction and recognition of prototypes by children and adults. Child Development, 53, 1028 –1037. Brehmer, B. (1994). The psychology of linear judgment models. Acta Psychologica, 87, 137–154. Bunge, S. A., & Zelazo, P. D. (2006). A brain-based account of the development of rule use in childhood. Current Directions in Psychological Science, 15, 118 –121. Cooksey, R. W. (1996). Judgment analysis: Theory, methods, and applications. San Diego, CA: Academic Press. Davidson, D. (1991). Children’s decision-making examined with an information-board procedure. Cognitive Development, 6, 77–90. DeCaro, M. S., Thomas, R. D., & Beilock, S. L. (2008). Individual differences in category learning: Sometimes less working memory capacity is better than more. Cognition, 107, 284 –294. Erickson, M. A., & Kruschke, J. K. (1998). Rules and exemplars in category learning. Journal of Experimental Psychology: General, 127, 107–140. Fisher, A. V., & Sloutsky, V. M. (2005). When induction meets memory: Evidence for gradual transition from similarity-based to category-based induction. Child Development, 76, 583–597. Gelman, S. A., & Coley, J. D. (1990). The importance of knowing a dodo is a bird: Categories and inferences in 2-year-old children. Developmental Psychology, 26, 796 – 804. Gelman, S. A., & Waxman, S. R. (2007). Looking beyond looks. Psychological Science, 18, 554 –555. Juslin, P., Jones, S., Olsson, H., & Winman, A. (2003). Cue abstraction and exemplar memory in categorization. Journal of Experimental Psychology: Learning, Memory, and Cognition, 29, 924 –941. Juslin, P., Karlsson, L., & Olsson, H. (2008). Information integration in multiple cue judgment: A division of labor hypothesis. Cognition, 106, 259 –298. Juslin, P., Olsson, H., & Olsson, A.-C. (2003). Exemplar effects in categorization and multiple-cue judgment. Journal of Experimental Psychology: General, 132, 133–156. Karlsson, L., Juslin, P., & Olsson, H. (2008). Exemplar-based inference in multi-attribute decision making: Contingent, not automatic, strategy shifts? Judgment and Decision Making, 3, 244 –260. Kloos, H., & Sloutsky, V. M. (2008). What’s behind different kinds of
THE DEVELOPMENT OF CUE ABSTRACTION IN JUDGMENT kinds: Effects of statistical density on learning and representation of categories. Journal of Experimental Psychology: General, 137, 52–72. Krascum, R. M., & Andrews, S. (1993). Feature-based versus exemplarbased strategies in preschoolers’ category learning. Journal of Experimental Child Psychology, 56, 1– 48. Kruschke, J. K. (1992). Alcove: An exemplar-based connectionist model of category learning. Psychological Review, 99, 22– 44. Lafon, P., Chasseigne, G., & Mullet, E. (2004). Functional learning among children, adolescents, and young adults. Journal of Experimental Child Psychology, 88, 334 –347. Lagnado, D. A., Newell, B., Kahan, S., & Shanks, D. R. (2006). Insight and strategy in multiple cue learning. Journal of Experimental Psychology: General, 135, 162–183. Lehrl, S. (1999). Mehrfachwahl-Wortschatz-Intelligenztest: Manual mit Block MWT-B [Multiple choice vocabulary intelligence test]. Balingen, Germany: Spitta. Mata, R., von Helversen, B., & Rieskamp, J. (2009). When easy comes hard: The development of adaptive strategy selection. Manuscript submitted for publication. Miklich, D. R., & Gillis, J. S. (1975). Interaction of age and cue validities in multiple-cue probability learning by children. Psychological Reports, 37, 235–240. Miller, P. H. (1994). Individual differences in children’s strategic behaviors: Utilization deficiencies. Learning and Individual Differences, 6, 285–307. Montanelli, D. S. (1972). Multiple-cue learning in children. Developmental Psychology, 7, 302–312. Nosofsky, R. M. (1984). Choice, similarity, and the context theory of classification. Journal of Experimental Psychology: Learning, Memory, and Cognition, 10, 104 –114. Nosofsky, R. M., & Johansen, M. K. (2000). Exemplar-based accounts of “multiple-system” phenomena in perceptual categorization. Psychonomic Bulletin & Review, 7, 375– 402.
227
Nosofsky, R. M., Palmeri, T. J., & McKinley, S. C. (1994). Rule-plusexception model of classification learning. Psychological Review, 101, 53–79. Nosofsky, R. M., & Zaki, S. R. (1998). Dissociations between categorization and recognition in amnesic and normal individuals: An exemplarbased interpretation. Psychological Science, 9, 248 –255. Nosofsky, R. M., & Zaki, S. R. (2002). Exemplar and prototype models revisited: Response strategies, selective attention, and stimulus generalization. Journal of Experimental Psychology: Learning, Memory, and Cognition, 28, 924 –940. Piaget, J. (1952). The origins of intelligence in children. New York: International Universities Press. Pitt, M., Myung, I., & Zhang, S. (2002). Toward a method of selecting among computational models of cognition. Psychological Review, 109, 472– 491. Roberts, S., & Pashler, H. (2000). How persuasive is a good fit? A comment on theory testing. Psychological Review, 107, 358 –367. Siegler, R. (2000). The rebirth of children’s learning. Child Development, 71, 26 –35. Sloutsky, V. M. (2003). The role of similarity in the development of categorization. Trends in Cognitive Sciences, 7, 246 –250. Sloutsky, V. M., Kloos, H., & Fisher, A. V. (2007). When looks are everything: Appearance similarity versus kind information in early induction. Psychological Science, 18, 179 –185. Stone, M. (1974). Cross-validatory choice and assessment of statistical predictions. Journal of the Royal Statistical Society, Series B, 36, 111– 147. Wechsler, D. (1981). Wechsler Adult Intelligence Scale—Revised: Manual. New York: Psychological Corporation. Wilburn, C., & Feeney, A. (2008). Do development and learning really decrease memory? On similarity and category-based induction in adults and children. Cognition, 106, 1451–1464.
Appendix A Mathematical Models Exemplar Memory The exemplar model assumes that the judgment is the average of the criterion values, weighted by their similarity to the probe.
冘
The similarity S( p, i) between exemplars is found by transforming the distance between them. The distance between a probe p and an exemplar i is
冋冘 冏 J
I
yˆp ⫽
dpi ⫽ h
S共 p, i兲 · xi
sj cpj ⫺ cij
j⫽1
i⫽1
冘
(A1)
I
S共 p, i兲
i⫽1
where yˆp is the estimated criterion value for the probe p; S is the similarity of the probe to the stored exemplars; xi is the criterion value of the exemplar i; and I is the number of stored exemplars in memory. The similarity S between the stored exemplar and the probe is calculated by the similarity rule of the generalized context model (Nosofsky, 1984).
冏册
,
(A2)
where cpj and cij, respectively, are the cue values of the probe p and an exemplar i on cue dimension j; h is a sensitivity parameter (changed from the usual c to avoid confusion with the cue values c) that reflects overall discriminability in the psychological space (Nosofsky & Zaki, 1998); and the parameters sj are the attention weights associated with cue dimension j. Attention weights vary between 0 and 1 and are constrained to sum to 1. The similarity S( p, i) between a probe p and an exemplar i is a nonlinearly decreasing function of their distance (dpi),
(Appendices continue)
228
VON
HELVERSEN, MATA, AND OLSSON
S共 p, i兲 ⫽ e⫺dpi.
to the function determining the continuous criterion and the model produces perfect judgments. In the binary task, a decision rule assumes that all objects p with the criterion C ⬍ 15 are classified into group A, that all objects with C ⬎ 15 are classified into group B, and that objects with C ⫽ 15 have probability of .5 of being classified into group A or B. The proportion of classifications into B p(b ⫽ 1) was modeled by a smoother logistic function to take account of random error (cf. Juslin, Olsson, & Olsson, 2003),
(A3)
Cue Abstraction The cue abstraction model assumes that the judgment yˆ of an object p is the sum of the weighted cue values c1 . . . cj, plus an intercept k
冘 J
yˆp ⫽ k ⫹
wj · cj,
(A4) pˆ共bˆ ⫽ 1兲 ⫽
l⫽j
where the intercept k and the weights w are free parameters. If k ⫽ 10, w1 ⫽ 4, w2 ⫽ 3, w3 ⫽ 2, and w4 ⫽ 1, Equation A4 is identical
ek⫹
冘 冘
Wi · ci
1 ⫺ ek⫹
Wi · ci
where Wi is the cue weights and k is the intercept.
Appendix B Individuals’ Models Fits (RMSD) by Age-Group and Environment Task Binary Age-group and no. participants Children 1 2 3 4 5 6 7 8 9 10 11 12 13 14 15 16 17 18 19 20 21 22 23 24 25 Adults 1 2 3 4 5 6 7 8 9 10 11
Continuous
Exemplar model
Cue abstraction model
Exemplar model
Cue abstraction model
0.39 0.35 0.32 0.43 0.33 0.30 0.33 0.40 0.43 0.36 0.46 0.43 0.41 0.50 0.52 0.26 0.46 0.46 0.38 0.44 0.25 0.33 0.42 0.43 0.33 0.29
0.40 0.42 0.35 0.57 0.23 0.32 0.28 0.30 0.60 0.38 0.34 0.45 0.66 0.58 0.00 0.36 0.51 0.56 0.39 0.46 0.29 0.45 0.44 0.35 0.18 0.38
1.26 2.09 2.02 2.51 1.44 2.58 1.61 1.91 1.11 2.20 2.37 2.37 1.46 2.23 1.15 2.06 1.65 1.57 2.27 2.53 1.05 0.99 2.76 1.84 2.10 1.53
1.25 1.48 2.41 2.44 1.74 3.05 1.82 1.26 1.93 2.01 3.12 2.31 1.58 1.52 1.63 2.06 1.16 1.28 2.69 2.70 1.66 1.15 2.12 1.57 2.10 2.58
0.00 0.30 0.00 0.57 0.13 0.46 0.58 0.21 0.53 0.18
0.00 0.31 0.00 0.61 0.45 0.52 0.66 0.18 0.71 0.45
2.86 1.35 1.93 1.68 2.19 3.26 2.23 1.30 1.54 1.83
2.84 2.49 2.03 1.41 2.51 3.18 1.93 1.26 0.97 2.18
(A5)
THE DEVELOPMENT OF CUE ABSTRACTION IN JUDGMENT
229
Appendix B (continued) Task Binary Age-group and no. participants 12 13 14 15 16 17 18 19 20 21 22 23 24 25
Continuous
Exemplar model
Cue abstraction model
Exemplar model
Cue abstraction model
0.33 0.55 0.44 0.37 0.42 0.57 0.21 0.01 0.40 0.35 0.20 0.35 0.00 0.28
0.18 0.00 0.52 0.58 0.18 0.61 0.37 0.36 0.33 0.45 0.42 0.43 0.18 0.43
2.15 1.71 1.63 1.46 1.16 1.26 2.55 1.79 3.78 1.38 1.78 1.94 1.23 1.73
2.09 1.56 1.51 1.94 1.14 0.55 2.22 2.23 3.04 0.90 1.17 2.72 1.96 1.03
Note. Participants were classified, if the difference between model fits exceeded a threshold, which was set at one standard error of the mean model fits. The threshold was .023 in the binary condition and was .087 in the continuous condition. RMSD ⫽ root mean square deviation.
Received August 22, 2008 Revision received May 13, 2009 Accepted May 19, 2009 䡲