variational Bayesian method in the speaker clustering experiment; with a small amount of data, the MCMC-based method was more effective; with large scale ...
FULLY BAYESIAN INFERENCE OF MULTI-MIXTURE GAUSSIAN MODEL AND ITS EVALUATION USING SPEAKER CLUSTERING Naohiro Tawara1 , Tetsuji Ogawa2 , Shinji Watanabe3 , Tetsunori Kobayashi1 1
Department of Science and Engineering, Waseda University, Tokyo, Japan 2 Waseda Institute for Advanced Study, Tokyo, Japan 3 NTT Communication Science Laboratories, NTT Corporation, Kyoto, Japan ABSTRACT This study aims to verify effective optimization methods for estimating parametric, fully Bayesian models in speech processing. For that purpose, we investigate the impact of the difference in optimization methods for the multi-scale Gaussian mixture model, which is suitable for speaker clustering, on the clustering accuracy. The Markov chain Monte Carlo (MCMC)-based method was compared with the variational Bayesian method in the speaker clustering experiment; with a small amount of data, the MCMC-based method was more effective; with large scale data (more than one million samples), the difference between these methods in terms of the clustering accuracy decreased and the MCMC-based method was computationally efficient.
case, discrete data are handled in LDA, whereas continuous data are handled in speech models such as hidden Markov models (HMMs) and GMMs. Hierarchical models are severely affected by local optima, and there is a strong likelihood of this problem being more serious especially in the case of speech modeling that uses continuous Gaussian mixture distributions with a complicated structure. Therefore, this paper verifies optimization methods suitable for estimating the utterance generative model, which is a hierarchical model for continuous data, in terms of performance and data scalability. For this purpose, we investigate the impact of the aforementioned model optimization methods (i.e., the MCMC-based and VB methods) on the speaker clustering performance by using two speech databases, TIMIT as common speech data and “corpus of spontaneous Japanese (CSJ)” as large scale real speech data.
Index Terms— Speaker clustering, multi-scale Gaussian mixture model, Gibbs sampling, variational Bayesian method
2. MULTI-SCALE MIXTURES OF GAUSSIAN MODELS
1. INTRODUCTION
Let out ∈ RD be a D-dimensional observation vector at the t-th Δ u be the u-th utterance frame in the u-th utterance, Ou = {out }Tt=1
Speaker variability in speech data has mainly two levels: 1) interutterance variability, which is derived from the difference in speaker characteristics, and 2) intra-utterance variability (i.e., intra-speaker variability), which is derived from the difference in contents of spoken utterances. Statistical modeling plays an important role in handling data involving such multi-scale properties. In the domain of natural language processing, latent Dirichlet allocation (LDA) [1, 2] is one of the successful approaches for handling multi-scale properties such as word-level and document-level properties. Hierarchical modeling has also been applied to acoustic speaker clustering in the form of an utterance generative model [3, 4]. In this model, we used conventional Gaussian mixture models (GMMs) for representing the intrautterance variability (i.e., intra-speaker variability) and a mixture of these GMMs for representing the inter-utterance variability (i.e., entire speaker space). The Markov chain Monte Carlo (MCMC)-based method and the variational Bayesian (VB) method have been applied to the optimization of hierarchical models such as the LDA and utterance generative models. The MCMC-based and VB methods used for LDA were compared previously [2], and it was found that the MCMCbased method is more efficient and takes less computational time to converge parameters. In addition, the VB method is more likely to converge the parameters to the local optima, which yield low-quality solutions. The MCMC-based method, in contrast, can avoid the local convergence problem and improve the quality of the solutions by taking sufficient time for model estimation. The MCMC-based method has been widely used in practice because of its effectiveness, computational efficiency, versatility, and ease of implementation. In this
978-1-4673-0046-9/12/$26.00 ©2012 IEEE
Δ
that comprises Tu observation vectors, and O = {Ou }U u=1 be a set of U utterances. We define the generative model to represent the speaker space by using a mixture of GMMs (MoGMMs) in which D-dimensional GMMs represent speaker characteristics (i.e., intra-speaker variability), and the mixture of these GMMs represents the entire speaker space (i.e., inter-speaker variability). In this model, the number of mixtures in the MoGMMs indicates the number of speakers. To deal with this hierarchical mixture model, two kinds of latent variables are introduced: Z = {zu }U u=1 represents the utterance-level latent variables, each of which identifies the MoGMM component (i.e., speaker distribution) to which the u-th utterance is assigned; u V = {vut }U,T u,t=1 represents the frame-level latent variables, each of which identifies the intra-speaker GMM component to which the t-th frame in the u-th utterance is assigned. In this case, the utterancelevel and frame-level latent variables in the MoGMM-based speech modeling correspond to the document-level and word-level latent variables in LDA, although continuous data are used in speech modeling and discrete data are used in LDA. The conditional probability of all utterances given the latent variables is described as follows: p(O|Z, V, Θ) YTu YU hzu wzu vut N (out |μzu vut , Σzu vut ) (1) = u=1 t=1 ˘ ¯ ¯ ˘ where Θ denotes a set of parameters {hj } , {wij } , μij , {Σij } ; hj , the weight for the entire speaker MoGMM component; wij , μij , and Σij , the weight, mean vector, and covariance matrix for the intra-speaker GMM component, respectively. Σij is a diagonal covariance matrix whose (d, d)-th element is represented by σij,d . In
5253
ICASSP 2012
Algorithm 1 Collapsed Gibbs sampling-based model estimation. 1: Initialize {zu , vut : u = 1, · · · , U, t = 1, · · · , Tu }. 2: repeat 3: for all u such that 1 ≤ u ≤ U do 4: for all t such that 1 ≤ t ≤ Tu do 5: Sample vut from Eq. 7 6: end for 7: end for 8: for all u such that 1 ≤ u ≤ U do 9: Sample zu from Eq. 8 10: end for 11: until some condition is met 3.1. MCMC-based method
Fig. 1. Graphical model for utterance generative model. a Bayesian approach, the conjugate prior distributions of parameters are introduced as follows: P (wij ) = D(wj0 ), P (h) = D(h0 ), YD 0 p(μij,d , σij,d ) = N G(ξ 0 , η 0 , μ0j,d , σj,d ) (2) d=1 ` 0´ where D h denotes the Dirichlet distribution with a hyper param´ ` 0 denotes the Normal-Gamma eter h0 and N G ξ 0 , η 0 , μ0j,d , σj,d 0 . Figure 1 distribution with hyper parameters ξ 0 , η 0 , μ0j,d and σj,d shows the graphical model for the utterance generative model used.
In the MCMC-based method for estimating the utterance-level latent variables, the samples of latent variables are obtained directly from the posterior distribution of these variables. It means that γvut =j|zu =i and γzu =i described in Eqs. 3 and 4 are zero-or-one values according to the assignment of data. In this study, we apply the collapsed Gibbs sampling, in which the parameters Θ are marginalized, to the marginalized joint posterior distribution. In each step of the collapsed Gibbs sampling, the value of one of the latent variables (e.g., zu ) is replaced with a value generated from the distribution of that variable given the values of the remaining latent variables (i.e., Z \u = {zu� |u� �= u}). In this case, the latent variables are sampled from the conditional posterior distribution as follows: [Frame-level latent variables] p(vut = j � |O, V\t , Z\u , zu = i) “ ” ˜ i,j � ) − gij � (Θ ˜ i,j � \t ) exp gij � (Θ “P ” = ˜ ˜ exp j gij (Θi,j ) − gij (Θi,j\t )
3. MODEL ESTIMATION When using the multi-scale mixture model described in the previous section, the speaker clustering problem reduces to estimating the utterance-level latent variables. In this case, the following posterior probabilities of the latent variables V and Z are estimated. γvut =j|zu =i
=
Δ
p(vut = j|O, Θ, zu = i)
(3)
γzu =i
=
Δ
p(zu = i|O, Θ)
(4)
Sufficient statistics of this model are computed by using the aforementioned posterior probabilities as follows: P 8 ci = Pu γzu =i > > < n = Pu,t γvut =j|zu =i · γzu =i ij (5) m = u,t γvut =j|zu =i · γzu =i · out ij > > P : 2 rij,d = u,t γvut =j|zu =i · γzu =i · (out,d ) where ci denotes the number of utterances assigned to the i-th component of the entire speaker MoGMM; nij , the number of frames assigned to the j-th component of the intra-speaker GMM of the i-th component of the MoGMM; and mij and rij , the first and second order sufficient statistics, respectively. The hyper parameters of the posterior distributions for Θ are computed as follows: 8 ˜ hi = h0i + ci > > > > w ˜ij = wj0 + nij > > > < ξ˜ij = ξ 0 + nij ˜ i,j = Θ (6) η˜ij = η 0 + nij > > 0 0 ξ μ +m > ij j > > μ ˜ ij = > ξ˜ij > : 0 σ ˜ij,d = σj,d + rij,d + ξ 0 (μ0j,d )2 + ξ˜ij (˜ μi,j,d )2 In 3.1 and 3.2, we describe the MCMC-based and VB methods, respectively.
(7)
[Utterance-level latent variable] p(zu = i� |O, V, Z\u ) P ”” “ P “ Γ( w ˜ � ) ˜ i� ,j ) − gij (Θ ˜ i� \u,j ) g + ( Θ exp log Γ(Pj wi˜ \u,j ij j ) � j “P “ Γ(P iw˜,j� ””” = P “ j i \u,j ) ˜ i,j )−gij (Θ ˜ i\u,j ) P log exp + j gij (Θ i Γ( w ˜ � ) j
i ,j
(8) ˜ i,j ) denotes the joint probability described as follows: where gij (Θ ˜ i,j ) gij (Θ
Δ
= =
p(O, V, vut = j, Z, zu = i) D log Γ(w ˜ij ) − log ξ˜ij 2 « „ η˜ij X η˜ij − +D log Γ log σ ˜ij,d d 2 2
(9)
˜i, w ˜ ij , and σ ˜ij , ξ˜ij , η˜ij , μ ˜ij,d are described in Eq. 6, and D where h ˜ i,j\t ) denotes the dimensionality of observation vectors; and gij (Θ is computed using O\t , Z, and V\t . This sampling process is iterated across all latent variables. For the utterance generative model used, the collapsed Gibbs sampling procedure is carried out as Algorithm 1. It should be noted that the sequence of the latent variables sampled is guaranteed to be the sequence of the samples generated from the original joint distribution. We, therefore, can assume that these estimates of the utterance-level latent variables are a result of speaker clustering.
5254
Algorithm 2 Variational Bayesian model estimation. 1: Initialize {zu , vut : u = 1, · · · , U, t = 1, · · · , Tu }. 2: repeat 3: for all i, j such that 1 ≤ i ≤ S, 1 ≤ j ≤ M do 4: Compute the expectation values described in Eqs. 16 - 19. 5: for all u, t such that 1 ≤ u ≤ U , 1 ≤ t ≤ Tu do 6: Compute q(V, Z) in Eq. 10 followed by computing the expectation values described in Eqs. 13 and 15. 7: end for 8: end for 9: for all i, j such that 1 ≤ i ≤ S, 1 ≤ j ≤ M do 10: Compute the hyper parameters of q(Θ) in Eq. 11 by using the sufficient statistics, as described in Eq. 6. 11: end for 12: until estimation is converged 3.2. Variational Bayesian (VB) method In the VB method, the utterance-level latent variables are deterministically obtained by estimating the variational posterior distribution, whereas in the MCMC-based method, these variables are stochastically sampled from the conditional posterior distribution. In the VB method, to optimize the variational posterior distribution, we attempt to maximize what is called “free energy,” which is the lower bound of the marginalized logarithmic likelihood (i.e., log p(O)). Under the assumption that each variable in the variational posterior distribution is i.i.d. as q(V, Z, Θ) = q(Z)q(V|Z)q(Θ), the optimal variational posterior distribution (i.e., q(V, Z, Θ) that maximizes the free energy) can be “Ddetermined as follows: E ” q(V, Z) ∝ exp log p(O, V, Z, Θ) (10) q(Θ) ” “D E (11) q(Θ) ∝ exp log p(O, V, Z, Θ) q(V,Z)
where �f (X)�q(X) denotes the expectation given that X is distributed according to q. Optimal q(V, Z) and q(Θ) are obtained from Algorithm 2. The posterior probability of a frame-level latent variable is estimated as follows: γv∗ut =j|zu =i „ 1X = exp �log wij �q(wij ) + �log σij,d �q(σij,d ) d 2 « D 1 X −1 − log2π− �σij,d (out,d − μij,d )2 �q(μij,d |σij,d ) (12) d 2 2 In this case, we can determine a frame-level latent variable by normalizing Eq. 12 as follows: γv∗ =j|zu =i γvut =j|zu =i = P ut∗ (13) j γvut =j|zu =i In the same manner, we can compute an utterance-level latent variable γzu =i from the posterior probability γz∗u =i as follows: Y X ∗ γvut =j|zu =i (14) γz∗u =i = �log hi �q(hi ) t
γzu =i
=
j
γ∗ P zu∗=i i γzu =i
(15)
In this case, the expected values of the parameters described in Eqs. 12 and 14 are computed as follows: X ˜i) ˜ i ) − ψ( h (16) �log hi �q(hi ) = ψ(h i X ˜ij ) − ψ( w ˜ij ) (17) �log wij �q(wij ) = ψ(w j
�log σij,d �q(σij,d ) = ψ(η˜ij ) − log σ ˜ij,d 2 �σ−1 ij,d (out,d −μij,d ) �q(μij,d |σij,d )
=
(18)
η˜ij σ ˜−1 ˜ij,d)2+ ξ˜ij (19) ij,d (out,d − μ
5255
Table 1. Number of speakers and utterances in evaluation data. The number of utterances are averaged over speakers in CSJ-4 and 5. # spkr. # utt. / spkr.
TIMIT 24 8
CSJ-1 10 5
CSJ-2 10 10
CSJ-3 10 20
CSJ-4 10 249.1
CSJ-5 20 232.1
where ψ(·) denotes Digamma function. 4. SPEAKER CLUSTERING EXPERIMENTS In order to compare the MCMC-based and VB methods, we carried out speaker clustering experiments. 4.1. Experimental condition 4.1.1. Speech data We performed speaker clustering experiments by using six evaluation sets obtained from the TIMIT and CSJ databases. Table 1 lists the number of speakers and utterances in the evaluation sets used. We used a core test set in TIMIT, which included 192 utterances spoken by 24 speakers. The remaining five evaluation sets were obtained from CSJ as follows: all lectures were divided into utterance units on the basis of silence segments in their transcriptions that were longer than 500 ms; ten speakers were randomly selected and their 5, 10, 20, and all utterances were selected for CSJ-1, CSJ-2, CSJ3, and CSJ-4, respectively; and 20 speakers were randomly selected and all their utterances were selected for CSJ-5. Each utterance is between 5 and 10 s long. We evaluated five combinations of different speakers in each data set. In this case, CSJ-4 and CSJ-5 include large scale data (about 1M and 3M samples, respectively). We used 39-dimensional acoustic feature parameters that consisted of 12-dimensional mel-frequency cepstrum coefficients (MFCCs), log energy, their Δ parameters, and their ΔΔ parameters. The frame length and frame shift were 25 ms and 10 ms, respectively. 4.1.2. Measurement We applied the average cluster purity (ACP), average speaker purity (ASP), and geometric mean of those values (K value) to the evaluation criteria in the speaker clustering [5]. The number of iterations in the MCMC-based method was set to 50. We considered the first 40 iterations as the burn-in period, and the K values obtained from this period were rejected. The average of the K values of the remaining ten iterations was measured. Furthermore, we carried out 50 similar experiments using different seeds to generate the random numbers and different initial values for the latent variables and then measured the average of the K values. For the VB method, we also carried out 50 similar experiments using different initial values for the latent variables and then measured the average of the K values. 4.1.3. Evaluation condition The hyper parameters in Eq. 2 were set as follows: h0 = 1, ξ 0 = 1, and η 0 = 1. wi0 , μ0ij , and Σ0ij in Eq. 2 were set to the weights, mean vectors, and covariance matrices of the universal background model (UBM), respectively. The UBM was trained with the complete test set in TIMIT except for the core test set. The number of speaker clusters was set to the actual number of speakers. The number of mixtures in the intra-speaker GMMs was set to two in both the MCMC-based and VB methods. The initial values of the utterancelevel latent variables and those of the frame-level latent variables were determined with the K-means clustering algorithm and assignment of random numbers to the variables, respectively.
Table 2. Speaker clustering results.
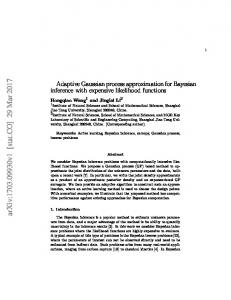
Fig. 2. K values as a function of the number of estimated speaker clusters. To distinguish between data for the same number of clusters, the dots are identified with small random horizontal perturbations. 4.2. Experimental results and discussion Table 2 lists the ACPs, ASPs, and K values obtained when using the MCMC-based and VB methods for the six evaluation sets. Figure 2 shows a scatter plot representing the relationship between the estimated number of speaker clusters and the corresponding K values for CSJ-1. In this figure, the dots are described with small random horizontal perturbations to distinguish between data for the same estimated number of clusters. The MCMC-based method outperformed the VB method for most of all evaluation sets. In this case, we can see that the difference in the clustering accuracy between these methods decreased with an increase in the number of utterances for each speaker from the results for CSJ-1, CSJ-2, CSJ-3, and CSJ-4. In addition, the VB method tended to estimate the fewer number of clusters than the true number of speakers, as compared with the MCMC-based method. This tendency became noticeable, especially when the number of utterances was fewer. The VB method is known to easily fall into local optima, whereas the MCMC-based method can avoid such solutions. This hypothesis was supported by Fig. 2; when applying the VB method, the K values were vertically distributed in wide ranges for the same estimated number of clusters, whereas the K values were almost the same in the MCMC-based method. Therefore, the MCMC-based method could achieve more precise speaker clustering than the VB method for small numbers of utterances. Next, we discuss the reason why the small number of clusters was estimated (in this case, adequate clustering could not be achieved) when the number of utterances was small, focusing on the MCMC-based method. The case where the estimated number of clusters was smaller than the true number of speakers indicates that there were the clusters to which no data were assigned as a result of the model estimation. The results can be interpreted as follows: once a speaker cluster becomes empty (i.e., no data are assigned to this cluster) at the step of sampling the utterance-level latent variables, new utterances are never assigned to this cluster. This indicates that ergodicity in the Gibbs sampler is not satisfied. In this case, it is not guaranteed that the samples are generated from the true posterior distribution. When the number of utterances is large, such a situation will not occur frequently and adequate latent variables would be obtained. In contrast, when the number of utterances is small, the number of speaker clusters to which no utterances are assigned will probably increase, and therefore, adequate clustering would not be achieved. We finally discuss computational cost. In the experiment performed using CSJ-5 (i.e., 20 speakers and 232.1 utterances per speaker), the MCMC-based method required double times of the VB-based method for one epoch of iterative calculation e.g., the
5256
Evaluation data TIMIT (spkr:24,utt:8) CSJ-1 (spkr:10,utt:5) CSJ-2 (spkr:10,utt:10) CSJ-3 (spkr:10,utt:20) CSJ-4 (spkr:10,utt:249.1) CSJ-5 (spkr:20,utt:232.1)
Method MCMC VB MCMC VB MCMC VB MCMC VB MCMC VB MCMC VB
#clusters 23.7 22.0 9.21 8.79 9.75 9.29 9.97 9.59 10 10 20 18.88
ACP 0.783 0.608 0.808 0.704 0.852 0.695 0.866 0.780 0.784 0.773 0.740 0.693
ASP 0.816 0.790 0.898 0.860 0.892 0.846 0.892 0.870 0.694 0.673 0.627 0.676
K value 0.799 0.692 0.851 0.777 0.871 0.782 0.879 0.823 0.738 0.721 0.681 0.684
former and latter methods took about 214.87 and 103.01 s, respectively, on an average by using Intel Xeon 3.00 GHz. However, the MCMC-based and VB methods required 10 and 100 iterations until convergence of estimation. As the number of utterances increases, the computational cost will drastically increase because a lot of iterations are needed. Therefore, fast convergence speed of the MCMC-based method has a great advantage in total computational cost. In addition, we can apply some sampling techniques with fast convergence e.g., blocked Gibbs sampling, simulated annealing, and beam sampling. 5. CONCLUSION AND FUTURE WORKS In this study, we investigated the impact of the difference in estimation methods, the MCMC-based and VB methods, of the fully Bayesian multi-scale mixture model on speaker clustering accuracy. Speaker clustering experiments showed that the MCMC-based method outperformed the VB method, especially when only few utterances could be used. We also showed that precise speaker clustering was not always achieved for a data set with a small number of utterances even when using the MCMC-based method, because the parametric Bayesian approach did not always satisfy the ergodicity required in the Gibbs sampler. In order to solve this problem, it is effective to apply nonparametric Bayesian modeling where the empty clusters can be selected in the Gibbs sampling procedure (e.g., Chinese restaurant process). Actually, in [5], we proposed a non-parametric Bayesian version of an utterance generative model and showed that this model was effective in estimating the number of speakers. In this model, however, the intra-speaker distribution was not represented by an MoGMM but approximately represented by a single Gaussian distribution. Therefore, in future work, we would like to extend the MoGMM used in this study to a non-parametric Bayesian model. 6. REFERENCES [1] D. M. Blei et al., “Latent Dirichlet allocation.,” Journal of Machine Learning Research, vol. 3, pp.993–1022, 2003. [2] T. L. Griffiths and M. Steyvers. “Finding scientific topics, ” Proc. the National Academy of Sciences of the United States of America, vol.101, pp.5228–5235, 2004. [3] S. Watanabe et al., “Gibbs sampling based multi-scale mixture model for speaker clustering,” Proc. ICASSP, pp.4524–4527, May 2011. [4] F. Valente and C. Wellekens, “Variational Bayesian speaker clustering,” Proc. ODYSSEY, The Speaker and Language Recognition Workshop, May 2004. [5] N. Tawara et al., “Speaker clustering based on utteranceoriented Dirichlet process mixture model,” Proc. Interspeech, pp.2905–2908, Aug. 2011.