ICSEA 2011 : The Sixth International Conference on Software Engineering Advances
Functional Complexity Measurement: Proposals and Evaluations
Luigi Lavazza
Gabriela Robiolo
Dipartimento di Informatica e Comunicazione Università degli Studi dell’Insubria Varese, Italy
[email protected]
Departamento de Informática Universidad Austral Buenos Aires, Argentina
[email protected]
Abstract — Several definitions of measures that aim at representing the size of software requirements are currently available. These measures have gained a quite relevant role, since they are one of the few types of objective data upon which effort estimation can be based. However, traditional Functional Size Measures do not take into account the amount and complexity of elaboration required, concentrating instead on the amount of data accessed or moved. This is a problem, when it comes to effort estimation, since the amount and complexity of the required data elaboration affect the implementation effort, but are not adequately represented by the current measures, including the standardized ones. Recently, a few approaches to measuring aspects of user requirements that are supposed to be related with functional complexity and/or data elaboration have been proposed by researchers. The authors of this paper have also proposed a measure of the functional complexity as specified in user requirements. In this paper we take into consideration some of these proposed measures and compare them with respect to their ability to predict the development effort, especially when used in combination with COSMIC measures of functional size. Keywords-Functional size measurement; Function Points; COSMIC function points; effort estimation; functional complexity measurement.
I.
INTRODUCTION
COSMIC function points [8][12] are growingly used for measuring the functional size of applications, i.e., to measure the size of functional user requirements. The measure of functional size is typically used to drive the estimation of the development effort. To this end, effort models require several inputs in addition to the functional size, including the complexity of the software to be [3][7]. In fact, problem complexity is recognized as one of the elements that contribute to the comprehensive notion of software size [9]. The need to account for software complexity when estimating the development effort does not depend on the functional size measurement method used: for instance, when more traditional measures of the functional size –like IFPUG function points [12]– are used, complexity has to be accounted for as well. Actually, both COSMIC and IFPUG function points fail to represent the amount and complexity of data elaboration required. COSMIC function points concentrate on the measure of the data movements, neglecting the data
Copyright (c) IARIA, 2011.
ISBN: 978-1-61208-165-6
elaboration. More precisely, the model of software used by the COSMIC method –illustrated in Figure 1–includes data elaboration, but no indication on how to measure it is provided. The COSMIC measurement manual [8] simply assumes that every data movement accounts for some amount of data elaboration, and that such amount is proportional to the number of data movements, so that by measuring data movements one measures also data manipulation. Functional User Requirements
Functional Process Type
Sub-process types Data Movement Type
Data Manipulation Type
Figure 1. The COSMIC generic software model.
Before proceeding, it is useful to spend some words on the fact that throughout the paper we treat the terms “complexity” and “amount of data elaboration” as synonyms. This is due to the fact that complexity is an inherently elusive concept, and also to the fact that at the functional requirements level it is not clear what should be the difference between the amount and the complexity of data elaboration: for instance, in many cases, complexity is considered proportional to the number of alternatives in a process execution, but this number is also clearly related to the size of the process. When dealing with effort estimation, the most popular methods require an evaluation of the complexity of the application. Currently such evaluation is of a purely qualitative nature. For instance, COCOMO II [7] provides a table that allows the user to evaluate complexity on an ordinal scale (from “very low” to “extra high”) according to five aspects (control operations, computational operations, device-dependent operations, data management operations, user interface management operations) that have to be evaluated in a qualitative and subjective way: e.g., the characterization of computational operations corresponding
257
ICSEA 2011 : The Sixth International Conference on Software Engineering Advances
to the “Nominal” complexity is “Use of standard math and statistical routines. Basic matrix/vector operations” [7]. It is quite clear that it would be greatly beneficial to replace such subjective and approximate assessment of complexity with a real measure, based on objective and quantitative evaluations, since this would enable the construction of more objective and accurate models of effort. Several different possible measures of functional complexity were proposed. For instance, in [5] the number of inputs and outputs, the number of decision nodes, the sum of predicates of all decision nodes, the depth of decision tree and the length of paths are considered as possible indicators of complexity. In [6], Cao et al. propose the usage of the number of data groups (NOD), the number of conditions (NOC) and entropy of system (EOS). They also study how these measures (also in combination with COSMIC FP) are correlated with the development effort. Another measure of complexity, the Paths, was defined on the basis of the information typically available from use case descriptions [21]. The measure of the complexity of use cases is based on the application of the principles of McCabe’s complexity measure [18] to the descriptions of use cases in terms of scenarios. In fact, use cases are usually described giving a main scenario, which accounts for the ‘usual’ behaviour of the user and system, and a set of alternative scenarios, which account for all the possible deviations from the normal behaviour that have to be supported by the system. Robiolo and Orosco [21] apply to the use case textual descriptions the same measure applied by McCabe to code. Every different path in a given use case scenario contributes to the measure of the use case’s complexity. The definition of Paths conforms to several concepts enounced by Briand et al. [4]: Paths represent “an intrinsic attribute of an object and not its perceived psychological complexity as perceived by an external observer”, and they represent complexity as “a system property that depends on the relationship between elements and is not an isolated element's property”. A detailed description of the Paths measure and its applicability to use cases described in UML can be found in [15]. Previous work showed that effort models that take into consideration complexity measures are more precise than those based on the functional size only. In particular, the authors of this paper showed that development effort correlates well with COSMIC function points and Path [15], and that the inclusion of a Path-based complexity measure improves the models based on size, whatever size measure is used (IFPUG Function Points, CFP, or even Use Case Points) [16]. In this paper we enhance the dataset used in [16] with some measures that represent potential complexity dimensions, build effort estimation models that exploit these measures, and discuss the precision of fit of these models. The results of the measurements and analyses reported in the paper contribute to enhancing the knowledge of how it is possible to measure functional complexity at the requirements level, and what is the contribution of such measure to effort estimation.
Copyright (c) IARIA, 2011.
ISBN: 978-1-61208-165-6
II.
THE EXPERIMENTAL EVALUATION
In the research work reported here, we used measures that are conceptually very close to those proposed in previous studies [5][6]. However, we did not stick exactly to the previous proposals, essentially for practical reasons. We used Paths instead of NOC because both measures capture essentially the same meaning, and the measures of Paths were already available. Similarly, we used the number of data groups instead of NOD, because –having measured the size of the applications in CFP, the documentation on the data groups was already available, thus the measurement could be performed very easily. Finally, we decided to use another “by product” of CFP measurement, namely the number of functional processes, as a simplified measure of size. A. The Dataset In order to evaluate the measures mentioned above with respect to their usability as effort predictors, we collected all such measures for a set of projects. We could not use data from the best known repositories –such as the PROMISE or ISBSG– because they do not report the size of each project according to different FSM methods; moreover, the Paths measure is very recent, and no historical data exist for it. TABLE 1.
THE DATASET
ProjID
Actual effort
Path
CFP
Func. Proc.
Data groups
Pers. DG
P1
410
71
143
39
21
7
P2
473.5
73
118
28
15
9
P3
382.4
60
109
24
15
12
P4
285
49
74
25
14
8
P5
328
34
48
12
17
7
P6
198
35
67
10
15
7
P7
442.02
50
81
16
12
6
P8
722.65
97
115
27
19
10
P9
392
83
105
24
22
11
P10
272
42
73
21
9
9
P11
131
18
51
13
5
5
P12
1042
118
85
30
29
12
P13
348
32
46
12
12
6
P14
242.5
68
96
26
18
9
P15
299.76
33
54
12
12
4
P16
147
20
53
14
15
4
P17
169
17
30
5
10
6
We measured 17 small business projects, which were developed in three different contexts: an advanced undergraduate academic environment at Austral University, the System and Technology (S&T) Department at Austral
258
ICSEA 2011 : The Sixth International Conference on Software Engineering Advances
Copyright (c) IARIA, 2011.
ISBN: 978-1-61208-165-6
TABLE 2. CORRELATIONS WITH EFFORT (LOG-LOG UNIVARIATE REGRESSION) Var.
Adj. R2
p-value
Outl.
MMRE
Pred(25)
Path
0.79
< 10-5
2
22.7
70.6
Path/FPr
0.73
< 10-3
5
37.2
58.8
0.65
-4
0
24.1
52.9
Path/CFP
< 10
Error range -35%.. 82% -48% .. 169% -43% .. 66%
Actual Effort
6.0
6.5
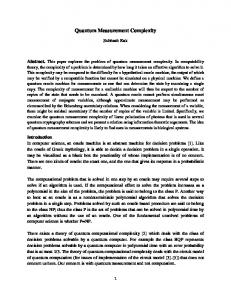
The regression line of the model representing Effort vs. Paths –which appears as the best univariate model– is illustrated in Figure 2.
5.5
3.0
3.5
4.0
4.5
Path
Figure 2. Effort vs. Path: log-log regression line.
20 -20
0
% residuals
40
60
80
The distribution of relative residuals is given in Figure 3.
-40
B. Analysis of the dataset using log-log transformations As a first approach to evaluating the correlation of effort with other measures, we used linear regression after log-log transformation, as is usually done in studies concerning effort (see for instance COCOMO [3][7]). We started by checking the correlation between effort and CFP. The results are not very good: after eliminating outliers, we got a model featuring adjusted R2 = 0.335. Then we moved to univariate analysis of the correlation between Effort and each variable mentioned in TABLE 1: – Path [Path] – COSMIC Function Points [CFP] – Functional Processes [FPr] – Data Groups [DG] – Persistent Data Groups [PDG] We also systematically tested the correlation between effort and the following density measures: – Path per Functional Process [Path/FPr] – Path per CFP [Path/CFP] – Data Groups per Functional Process [DG/FPr] – Data Groups per CFP [DG/CFP] – Persistent Data Groups per Functional Process [PDG/FPr] – Persistent Data Groups per CFP [PDG/CFP] These density measures introduce the concept of complexity per size unit. The complexity of a system is a property that depends on the relationships among system’s elements [4]. So, the measures listed above represent the density of relationships among elements per unit size. As size units we adopted both the fine grained CFP and the coarse grained number of functional processes. In fact, the number of functional processes is suggested as a reasonable approximation of the size in CFP in [8]. Quite interestingly, we got significant models only based on variables involving Paths. The results are synthetically reported in TABLE 2. For each model, we have also assessed the precision of the fit by using what are considered the de facto currently used goodness-of-fit indicators in Empirical Software Engineering, i.e., the Mean Magnitude of Relative Error (MMRE) and the percentage of data points whose actual effort falls within 75% and 125% of the estimated value (pred(25)) and the error range.
In TABLE 2 are reported only the models that satisfy the applicability conditions of linear regression (e.g., the residuals are normally distributed), are statistically significant (e.g., their p-value is < 0.05), and have coefficient of determination (Adjusted R2) sufficiently high (>0.6).
5.0
University and a CMM level 4 Company. The involved human resources shared a similar profile: advanced undergraduate students who had been similarly trained worked both at the S&T Department and at the CMM level 4 Company. All the selected projects met the following requisites: a) Use cases describing requirements were available. b) All projects were new developments. c) The use cases had been completely implemented, and the actual development effort in PersonHours was known. The dataset is reported in TABLE 1. Note that we distinguished the number of persistent data groups (column Pers. DG) from the total number of data groups, which includes also transient data groups. Our hypothesis is that persistent data groups are more representative of the amount of data being handled by the application.
Figure 3. Log-log regression of effort vs. Path: distribution of relative residuals.
259
ICSEA 2011 : The Sixth International Conference on Software Engineering Advances
Outl.
MMRE
Pred(25)
0.71
< 10-3
1
19.4
70.6
0.78
< 10-3
0
18.7
82.4
0.64
< 10-3
1
22.9
64.7
0.69
< 0.03
1
22.6
64.7
0.72