Bulletin of the JSME
Vol.10, No.9, 2016
Journal of Advanced Mechanical Design, Systems, and Manufacturing
Fuzzy-based Taguchi method for multi-response optimization of product form design in Kansei engineering: a case study on car form design Sugoro Bhakti SUTONO*,**, Salwa Hanim ABDUL-RASHID*, Hideki AOYAMA*** and Zahari TAHA**** * Centre for Product Design and Manufacturing, Department of Mechanical Engineering, Faculty of Engineering, University of Malaya 50603 Kuala Lumpur, Malaysia E-mail:
[email protected] ** Department of Industrial Engineering, Pelalawan School of Technology Pelalawan, Riau, Indonesia *** Department of System Design Engineering, Keio University 3-14-1 Hiyoshi, Kohoku-ku, Yokohama 223-8522, Japan **** Faculty of Manufacturing Engineering, Universiti Malaysia Pahang 26600 Pekan, Pahang, Malaysia
Received 13 June 2016 Abstract An integrated fuzzy-based Taguchi method (TM) for multi-response optimization of product form design is presented in this paper. The fuzzy-based TM is applied to determine the optimum combination of design parameters for product form design which will fulfill consumers’ aesthetic and emotional needs. Since conventional TM is incapable of handling multi-response optimization problems, a fuzzy logic system is integrated with the TM to overcome this problem. A case study of a car form design is used to demonstrate the effectiveness of the fuzzy-based TM and confirmation test is carried out to verify the method. It is found that the integrated design optimization method is capable of solving multi-response optimization problems in Kansei engineering (KE) and is able to determine the optimum combination of design parameters of a car form which are representative of consumers’ perception. The optimum designs generated from the integrated design optimization method are compared with competitor designs. It is found that the integrated design optimization method gives the best overall performance. Key words : Multi-response optimization, Product design, Taguchi method, Fuzzy logic, Kansei engineering
1. Introduction Kansei or affective engineering is an important aspect of new product design development, particularly consumer products, in order to gain a competitive edge in the market. Kansei product appearance has a deterministic influence on consumers’ decisions when it comes to purchasing products. Kansei design enables companies to develop new products which will satisfy the aesthetic and emotional needs of consumers. The most reliable and useful methodology to deal with the aesthetic and emotional needs of consumers is Kansei engineering (KE), which has been widely studied in product design (Nagamachi, 2002, 2008). ‘Kansei’ is a Japanese word which can be literally translated as feelings, images, emotions, affection, sense or impression. KE is a methodology which unites Kansei with the engineering discipline, a field where the development of products that bring happiness and satisfaction to human beings is performed technologically by analyzing human emotions and incorporating them into the product design (Nagamachi, 2011). Schütte et al. (2004) defined KE as a proactive product development methodology, which explores consumers’ impressions, feelings and demands regarding existing products systematically and translates them into design solutions and concrete design parameters. The general framework of KE process consists of the following steps: (1) selection of Paper No.16-00363 [DOI: 10.1299/jamdsm.2016jamdsm0108]
© 2016 The Japan Society of Mechanical Engineers
1
Sutono, Abdul-Rashid, Aoyama and Taha, Journal of Advanced Mechanical Design, Systems, and Manufacturing, Vol.10, No.9 (2016) the product domain, (2) spanning the semantic space, (3) spanning the product property space and (4) synthesizing. The main element of KE process is to construct a prediction or searching process model based on the relationship between product form features and consumers’ Kansei responses in order to generate optimum product form design solutions. The final step (i.e. synthesizing) involves generating optimum product form design solutions. In general, the development of the prediction or searching process model can be considered as a product form design optimization problem. Optimization of consumers’ satisfaction or response is essential in product design (Cross, 2008). In conventional KE techniques, product form design optimization is rather time-consuming and requires large sets of data. In addition, such conventional techniques lack flexibility, which causes the searching process of the entire solution space to be rather inefficient. These techniques treat the consumers’ responses merely as a single-criterion or response optimization problem when, in reality, the consumers’ perception of a product design is a multi-criteria or multi-response problem. Hence, a robust and systematic design optimization method has been proposed in previous studies to overcome the pitfalls associated with conventional Taguchi method (TM) (Lai et al., 2005; Sutono et al., 2012). The proposed method offers a robust, systematic means of reducing the time and cost involved in searching the entire solution space, and can be applied to a variety of design scenarios. The TM, which is a quality engineering concept, has been widely applied in optimum engineering designs (Taguchi et al., 2005). A number of studies have developed robust optimization methods based on the Taguchi experimental design in order to optimize product form designs. Lai et al. (2005) and Sutono et al. (2012) implemented TM and analysis of variance (ANOVA) to optimize product form designs and analyze the effect of design parameters on product form design. More recently, Oztekin et al. (2013) proposed a Taguchi-based method which is simple, feasible and versatile in order to determine the optimum combination of design parameters taking into account the impressions and feelings of consumers. However, the methods proposed in these studies are focused on single-criterion optimization problems, in which the focus is to determine the optimum combination of design parameters for each Kansei criterion. This is perfectly understandable since the original TM was developed to solve the optimization problems of a single performance characteristic (El-Taweel and El-Axir, 2009; Wu, 2004). It is more challenging to optimize multi-response optimization problems using TM since optimization of each Kansei criterion separately may lead to a serious conflict in the parameters’ settings (Hsieh et al., 2005). Several methods have been proposed over the years to deal with multi-response optimization problems in KE. Hong et al. (2008) proposed a technique based on multiple response surfaces (MRS) methodology for optimal balancing of multiple affective satisfaction dimensions. However, the MRS methodology was integrated with multiple linear regressions and steepest descent algorithm, thus the method may produce unsatisfactory results due to the poor performance of the linear models. It is generally known that the most critical problem in KE involves dealing with the non-linear relationship between product design features and Kansei responses. For this reason, Akay and Kurt (2009) developed a systematic approach to map the relationship between product design features and consumers’ Kansei responses, whereby the neuro-fuzzy method was integrated with multi-criteria group decision making and grey relational analysis. Yang (2011) constructed a hybrid Kansei engineering method which integrates support vector regression (SVR) and the multi-objective genetic algorithm (MOGA) based on multiple affective responses in order to facilitate the development of product form design. However, these methods are rather complex and do not offer a simple, straightforward means to obtain a stable, accurate and reliable solution since they require an extensive training process and large data sets. Huang et al. (2011) proposed a fuzzy product positioning method for the multiple criteria decision-making of a trade show booth design, in which the objective was to improve the efficiency of the searching process. Even though their method is capable of generating an ideal product form design, the method lacks systematic experimental design when it comes to generating combinations of design features for alternative samples. In addition, their method is incapable of identifying significant design features which affect the performance characteristics that are deemed crucial for optimum product form design. Based on the above argument, the aim of this study is to propose a method to solve a multi-response optimization problem in KE. The method involves integrating TM with a fuzzy logic system, and is therefore termed the ‘fuzzy-based TM’ throughout this paper. The TM is a powerful tool for the design of experiments whereas the fuzzy logic system is capable of tackling multi-response optimization problems while accounting for the non-linear relationship between Kansei responses and product design features, as well as the fuzziness of consumers’ responses. ANOVA is used to identify design parameters which significantly influence the Kansei responses. The goal of the fuzzy-based TM is to determine the optimum combination of design parameters which fulfills consumers’ aesthetic and emotional needs.
[DOI: 10.1299/jamdsm.2016jamdsm0108]
© 2016 The Japan Society of Mechanical Engineers
2
Sutono, Abdul-Rashid, Aoyama and Taha, Journal of Advanced Mechanical Design, Systems, and Manufacturing, Vol.10, No.9 (2016) Fuzzy-based TMs have been developed to address multi-criteria optimization problems in various fields including the manufacturing process. Tzeng and Chen (2007) developed a fuzzy-based TM to optimize a multi-criteria electrical discharge machining (EDM) process. Gupta et al. (2011) developed an efficient approach which integrates TM with a fuzzy logic system to determine the optimum machining parameters for a CNC turned part. Fuzzy-based TMs have also been developed for product design. For instance, Lin and Kuo (2011) proposed a fuzzy-based TM to solve the multi-objective structural design optimization problem of drawing dies. The objective functions were evaluated using integrated Taguchi and fuzzy logic inference methods to obtain the measuring index and optimize multiple performance characteristics. Hsiang et al. (2012) developed a fuzzy-based TM for use in applied materials. The method was used to determine optimum process parameters which would maximize the multiple performance characteristics index (MPCI) for hot extrusion of AZ31 and AZ61 magnesium alloy bicycle carriers. Although a number of studies have developed fuzzy-based TMs, only a few studies have implemented these methods for product form design in KE. Owing to the benefits offered by fuzzy-based TMs, the objective of this study is to propose a fuzzy-based TM to determine the optimum combination of design parameters for product form design which will satisfy consumers’ aesthetic and emotional needs. A confirmation test is used to verify the applicability of the proposed method in solving a multi-response optimization problem of car form design. It is believed that the fuzzy-based TM will be useful to the manufacturing industry, particularly manufacturers incorporating the concept of KE in product design.
2. Approaches 2.1 Taguchi method The Taguchi method (TM) was originally developed by Genichi Taguchi and is widely accepted as a simple and effective solution for parameter design and experimental planning to improve product quality. In this method, orthogonal arrays (OAs) from experimental design theory are used to study a large number of variables with a small number of experiments. Basically, the TM is based on OAs, loss function and signal-to-noise (S/N) ratio. An orthogonal array (OA) is first defined based on the number of design parameters and their levels. Following this, the deviation between the experimental and desired value is calculated by defining a loss function. The S/N ratio is calculated by transforming its loss function value and is used to determine the performance characteristic. There are three types of performance characteristic in the S/N ratio analysis, i.e. the nominal-the-best, the smaller-the-better and the larger-the-better. The details of the concept are given in Taguchi et al. (2005). The S/N ratio ηij of the smaller-the-better characteristic can be expressed as: 1 n ij 10 log y ij2 n i 1
(1)
The S/N ratio ηij of the larger-the-better characteristic can be expressed as: 1 n 1 2 n i 1 y ij
ij 10 log
(2)
The S/N ratio ηij of the nominal-the-best characteristic can be expressed as: y ij2 s2
ij 10 log
(3)
where yij is the experimental value of the ith experiment at the jth test, y ij is the mean of the experimental value of the ith experiment at the jth test, n is the number of tests and s2 is the variance of yij.
2.2 Fuzzy logic system Fuzzy logic is a mathematical theory of inexact reasoning which models the human reasoning process in linguistic terms (Ross, 2010). A fuzzy logic system consists of a fuzzifier, membership functions, fuzzy rule base, fuzzy inference
[DOI: 10.1299/jamdsm.2016jamdsm0108]
© 2016 The Japan Society of Mechanical Engineers
23
Sutono, Abdul-Rashid, Aoyama and Taha, Journal of Advanced Mechanical Design, Systems, and Manufacturing, Vol.10, No.9 (2016) engine and defuzzifier. The fuzzifier uses membership functions to convert crisp inputs into fuzzy sets. A membership function is a curve that defines how each input value is mapped to a degree of membership between 0 and 1. After fuzzification, the fuzzy inference engine performs fuzzy reasoning on the fuzzy rules to generate fuzzy values, and the defuzzifier transforms these values into a crisp output or a non-fuzzy output value. The centroid or center of gravity method is the most common method used for defuzzification. The structure of the fuzzy logic system for four inputs and one output is shown in Fig. 1. x1 x2 x3 x4
Fuzzy inference engine
Fuzzifier
Membership functions
Fig. 1
Defuzzifier
Fuzzy rules
y0
x1: S/N ratio for elegant x2: S/N ratio for youthful x3: S/N ratio for modern x4: S/N ratio for sporty y0: Multiple performance characteristics index (MPCI)
Structure of fuzzy logic system for four input variables and one output variable.
There are various types of fuzzy numbers used to visualize a membership function, namely, monotonic, triangular, trapezoidal, and s-shape or normal (bell-shape). To date, there are no standard rules for selecting the proper shape of the membership functions for the fuzzy sets of the input and output variables. In this study, a triangular fuzzy number is chosen as the membership function. The membership function of a triangular fuzzy number is defined by: 0, x a Ai Ai ( x, a Ai , b Ai , c Ai ) c Ai x 0,
b c
,
for x a Ai
Ai
a Ai , for a Ai x b Ai
Ai
b Ai
(4)
for b Ai x c Ai for x c Ai
where A is the membership function of the fuzzy set, x is a variable, and aA, bA and cA are parameters. The fuzzy rules are used by the fuzzy inference engine for fuzzy reasoning in order to generate the fuzzy values. IF-THEN rule statements are used by the fuzzy logic system to formulate fuzzy reasoning in the fuzzy inference engine based on their structure. The fuzzy rule base consists of a group of IF-THEN control rules which involve multiple inputs and one multi-response output y, which are expressed as follows: Rule 1 : IF x1 is A1 AND x 2 is B1 AND x 3 is C1 AND x 4 is D1 ... THEN y is E1 ELSE Rule 2 : IF x1 is A2 AND x 2 is B 2 AND x 3 is C 2 AND x 4 is D 2 ... THEN y is E 2
(5)
ELSE ... Rule n : IF x1 is An AND x 2 is B n AND x 3 is C n AND x 4 is D n ... THEN y is E
where Ai , Bi , C i , Di , … and E i are fuzzy subsets modeled by the corresponding membership functions Ai , Bi , Ci , Di , … and Ei , respectively. Based on the Mamdani implication method of inference reasoning, the fuzzy reasoning of these rules yields a fuzzy multi-response output. The membership function of the fuzzy multi-response output y is denoted as: C 0 ( y ) A1 ( x1 ) B1 ( x2 ) C1 ( x3 ) D1 ( x4 ) ... E1 ( y ) ... An ( x1 ) Bn ( x2 ) C n ( x3 ) Dn ( x4 ) ... E n ( y )
(6)
where ˄ and ˅ are the minimum and maximum operation, respectively. Finally, fuzzification using the centroid method is adopted to convert the fuzzy multi-response output C ( y ) into a non-fuzzy value y0. The non-fuzzy value y0 is given by: 0
y0
y C ( y ) C ( y)
(7)
0
0
In this study, the non-fuzzy value y0 is called the multiple performance characteristics index (MPCI).
[DOI: 10.1299/jamdsm.2016jamdsm0108]
© 2016 The Japan Society of Mechanical Engineers
24
Sutono, Abdul-Rashid, Aoyama and Taha, Journal of Advanced Mechanical Design, Systems, and Manufacturing, Vol.10, No.9 (2016)
3. Fuzzy-based Taguchi optimization methods for product form design The aim of this study is to propose a method which solves a multi-response optimization problem for product form design. Hence, an optimization method is proposed by integrating a fuzzy logic system with TM. The method is used to determine the optimum combination of design parameters for product form design with multiple Kansei responses. The optimization process of this study is outlined in the following steps: (1) identify and select the representative Kansei words as Kansei responses, followed by identifying the product design parameters and setting the design parameter levels for the Taguchi design of the experiment, (2) select an appropriate Taguchi’s OA and assign the design parameters to the selected OA in order to generate product form design samples, (3) conduct the experiments to evaluate each product form design sample with the selected representative Kansei responses using a semantic differential questionnaire, (4) calculate S/N ratios based on the experimental data to determine the performance of each product form design sample for each Kansei response, (5) perform a fuzzy logic operation on S/N ratios of each Kansei response to obtain the multiple performance characteristics index, (6) conduct factor effect analysis and ANOVA to determine the optimum combination of design parameter levels, (7) conduct a confirmation test to verify the results, in which the optimum product form design is compared with existing product design models.
4. Case study of car form designs An experimental case study was carried out using car form designs to demonstrate the applicability of the fuzzy-based TM proposed in this study. The target market was basically Malaysian consumers, and the designs were evaluated based on the car’s silhouettes, consisting of the car’s side and front views. It should be noted the term ‘silhouette’ refers to the form, profile or shape of the car and these terms are used interchangeably in the literature. A product’s silhouette is essential for designers to design and develop three-dimensional images of the product.
4.1 Representative Kansei responses A total of 16 initial Kansei word-pairs were collected to describe the consumers’ perception of car form designs, and these are summarized in Table 1. These word-pairs were selected by eliminating the adjectives gathered from KE literature, car magazines and the internet based on the similarities in the definitions (i.e. synonyms). Following this, the initial Kansei words were reduced according to their importance and relevance to this study, which produced a list of representative Kansei responses. The number of representative Kansei responses used in an experiment should be less than or equal to seven for simplicity as well as to ensure reasonable consistency (Saaty and Ozdemir, 2003). The collected initial Kansei word-pairs were further analyzed in order to determine the representative Kansei responses. For this purpose, 112 subjects, 56 males and 56 females, were asked through a questionnaire to evaluate the collected initial Kansei word-pairs using the semantic differential method. After obtaining the semantic differential data, the factor analysis and cluster analysis were then employed to extract initial Kansei word-pairs and select the representative Kansei responses (Shieh et al., 2011). The results from the factor analysis are presented in Table 2 and for the two-stage cluster analysis are presented in Table 3 that were adapted from the work of Sutono (2016). Kansei word-pairs with the shortest distance to the centroid of each cluster are selected as the representative word-pairs for the cluster. Consequently, modern, elegant, sporty and youthful were selected as the final set of representative Kansei responses. Table 1
Initial Kansei word-pairs.
No.
Kansei word-pairs
No.
Kansei word-pairs
1
Elegant–inelegant
9
Cute–not cute
2 3 4
Stylish–unstylish Youthful–oldish Sleek–lusterless
10 11 12
Sporty–not sporty Formal–casual Grand–not grand
5 6 7
Modern–ordinary Powerful–powerless Rugged–fragile
13 14 15
Streamlined–not streamlined Classic–poor Bold–plain
8
Spacious–confined
16
Masculine–feminine
[DOI: 10.1299/jamdsm.2016jamdsm0108]
© 2016 The Japan Society of Mechanical Engineers
25
Sutono, Abdul-Rashid, Aoyama and Taha, Journal of Advanced Mechanical Design, Systems, and Manufacturing, Vol.10, No.9 (2016) Table 2 No
Results of factor analysis for 16 Kansei word-pairs.
Kansei word-pairs
4 Sleek–lusterless 5 Modern–ordinary 2 Stylish–unstylish 14 Classic–poor 13 Streamlined–not streamlined 3 Youthful–oldish 10 Sporty–not sporty 9 Cute–not cute 1 Elegant–inelegant 7 Rugged–fragile 16 Masculine–feminine 6 Powerful–powerless 15 Bold–plain 12 Grand–not grand 11 Formal–casual 8 Spacious–confined Final statistics: Eigenvalue Percentage of variance Cumulative percentage
Factor 1
Factor 2
Factor 3
Cronbach’s alpha
0.915 0.912 0.868 -0.847 0.837 0.792 0.775 0.666 0.632 0.221 0.077 0.241 0.301 0.303 -0.201 -0.030
0.343 0.372 0.473 0.258 0.487 -0.071 0.463 -0.458 0.610 0.954 0.946 0.918 0.898 0.684 0.226 0.612
0.041 0.074 0.096 0.402 0.166 -0.593 -0.409 -0.493 0.472 0.108 0.266 0.302 0.191 0.625 0.947 0.764
0.898 0.894 0.928 0.915 0.892 0.901 0.893 0.923 0.897 0.898 0.892 0.899 0.893 0.889 0.916 0.903
6.25 39.04 39.04
5.93 37.08 76.12
3.27 20.45 96.57
KMO (Kaiser-Meyer-Olkin) = 0.818 Cronbach’s alpha = 0.908 Values in italic correspond to the groups of Kansei word pairs related to Factors 1–3.
Table 3
*
Results of cluster analysis.
Cluster
No.
Kansei word-pairs
1 1 1 1 1 2 2 2 2 2 2 2 2 3 3 4
5 14 4 2 13 1 15 6 12 8 7 16 11 10 9 3
Modern–ordinary* Classic–poor Sleek–lusterless Stylish–unstylish Streamlined–not streamlined Elegant–inelegant* Bold–plain Powerful–powerless Grand–not grand Spacious–confined Rugged–fragile Masculine–feminine Formal–casual Sporty–not sporty* Cute–not cute Youthful–oldish*
Euclidean distance 0.108 0.111 0.116 0.179 0.412 0.192 0.249 0.313 0.322 0.388 0.408 0.456 0.805 0.206 0.206 0.000
Representative Kansei word-pairs used as Kansei responses within the cluster 1–4.
4.2 Product design parameters Product design parameters which will evoke consumers’ Kansei responses are defined as the control factors in Taguchi experiments. A number of studies pertaining to KE and car design were first reviewed to identify the
[DOI: 10.1299/jamdsm.2016jamdsm0108]
© 2016 The Japan Society of Mechanical Engineers
26
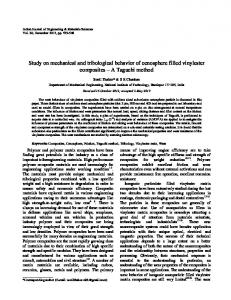
Sutono, Abdul-Rashid, Aoyama and Taha, Journal of Advanced Mechanical Design, Systems, and Manufacturing, Vol.10, No.9 (2016) appropriate design parameters for car design (Lai et al., 2005; Nordgren, 2007). The design parameters which most likely influenced consumers’ Kansei responses were then identified. A total of 13 design parameters were modified and adapted from the works of Lai et al. (2005) and Nordgren (2007). Their corresponding levels are presented in Table 4. These design parameters describe the form features of a car. The position of the design parameters with respect to the overall car is also shown in Fig. 2. Design parameters which were of less importance were kept fixed and excluded from the design parameter settings in order to evaluate impression effects.
Fig. 2 Table 4 Factor A B C D E F G H I J K L M
Design parameters for car form design.
Car design parameters and their corresponding levels. Design parameter
Ratio of car height to car length [H/L] Ratio of fore region length to overall length [LF/L] Ratio of front height to overall height [H F/H] Gradient of front bumper [θ1] Gradient of hood [θ2] Gradient of A-pillar [θ3] Ratio of rear region length to overall length [LR/L] Ratio of rear region height to overall height [H R/H] Gradient of C-pillar [θ4] Gradient of rear bumper [θ5] Gradient of trunk [θ6] Gradient of rear fender bottom [θ7] Gradient from side top [θ8]
1
Level 2
3
0.326 0.360 0.600 0 0 20 0.140 0.710 20 -16 2 0 14
0.273 0.425 0.540 15 3 25 0.235 0.680 30 0 4 6 22
0.220 0.490 0.480 30 6 30 0.330 0.650 40 16 6 12 30
4.3 Car form designs generated using Taguchi’s orthogonal array The car form designs were generated using Taguchi’s OA. The Taguchi design of experiments consisted of 13 design parameters and each parameter was set to three levels, as shown in Table 4. In general, a full factorial experiment would require up to 1,594,323 (313) car form designs. However, the number of experiments was reduced effectively by means of the Taguchi’s OA. The Taguchi’s L27 OA was adopted in this study due to the number of design parameters and their corresponding levels. The experimental layout is shown in Table 5. The level of each design parameter in the OA was used to generate a basic car form design (silhouette) for Kansei design evaluation. A total of 27 car form designs were generated using the Taguchi’s L27 OA, as shown in Fig. 3.
4.4 Evaluation experiment A survey was carried out to evaluate the car form designs based on the Kansei responses, using a questionnaire as the research instrument. The questionnaire consisted of four representative Kansei words which described consumers’ subjective responses as well as 27 car form designs generated using the Taguchi’s OA (Fig. 3). A total of 219 Malaysians participated in the survey, comprising 97 males and 122 females with an age range of 18–56 years. This
[DOI: 10.1299/jamdsm.2016jamdsm0108]
© 2016 The Japan Society of Mechanical Engineers
27
Sutono, Abdul-Rashid, Aoyama and Taha, Journal of Advanced Mechanical Design, Systems, and Manufacturing, Vol.10, No.9 (2016) corresponds to 44.3% males and 55.7% females, respectively. The subjects were instructed to rate each car form design for each Kansei response on a 5-point Likert scale. The questionnaire was designed based on the semantic differential method. The semantic differential method is a measurement tool which is frequently used in product design, especially Kansei engineering, in order to measure the affective and emotional value of a product. The data scores were then averaged to obtain a final utility rating. The data collected from the survey were further analyzed using S/N ratio analysis. Table 5
Experimental design layout using Taguchi’s L27 OA. Level of design parameter
Experiment no.
A
B
C
D
E
F
G
H
I
J
K
L
M
1 2 3 4 5 6 7 8 9 10 11 12 13 14 15 16 17 18 19 20 21 22 23 24 25 26 27
1 1 1 1 1 1 1 1 1 2 2 2 2 2 2 2 2 2 3 3 3 3 3 3 3 3 3
1 1 1 2 2 2 3 3 3 1 1 1 2 2 2 3 3 3 1 1 1 2 2 2 3 3 3
1 1 1 2 2 2 3 3 3 2 2 2 3 3 3 1 1 1 3 3 3 1 1 1 2 2 2
1 1 1 2 2 2 3 3 3 3 3 3 1 1 1 2 2 2 2 2 2 3 3 3 1 1 1
1 2 3 1 2 3 1 2 3 1 2 3 1 2 3 1 2 3 1 2 3 1 2 3 1 2 3
1 2 3 1 2 3 1 2 3 2 3 1 2 3 1 2 3 1 3 1 2 3 1 2 3 1 2
1 2 3 1 2 3 1 2 3 3 1 2 3 1 2 3 1 2 2 3 1 2 3 1 2 3 1
1 2 3 2 3 1 3 1 2 1 2 3 2 3 1 3 1 2 1 2 3 2 3 1 3 1 2
1 2 3 2 3 1 3 1 2 2 3 1 3 1 2 1 2 3 3 1 2 1 2 3 3 1 2
1 2 3 2 3 1 3 1 2 3 1 2 1 2 3 2 3 1 2 3 1 3 1 2 1 2 3
1 2 3 3 1 2 2 3 1 1 2 3 3 1 2 2 3 1 1 2 3 3 1 2 2 3 1
1 2 3 3 1 2 2 3 1 2 3 1 1 2 3 3 1 2 3 1 2 2 3 1 1 2 3
1 2 3 3 1 2 2 3 1 3 1 2 2 3 1 1 2 3 2 3 1 1 2 3 3 1 2
No. 1
No. 2
No. 3
No. 4
No. 5
No. 6
No. 7
No. 8
No. 9
No. 10
No. 11
No. 12
No. 13
No. 14
No. 15
No. 16
No. 17
No. 18
No. 19
No. 20
No. 21
No. 22
No. 23
No. 24
No. 25
No. 26
No. 27
Fig. 3 Car form designs generated using Taguchi’s L27 OA. 4.5 Calculation of the S/N ratio
[DOI: 10.1299/jamdsm.2016jamdsm0108]
© 2016 The Japan Society of Mechanical Engineers
28
Sutono, Abdul-Rashid, Aoyama and Taha, Journal of Advanced Mechanical Design, Systems, and Manufacturing, Vol.10, No.9 (2016)
4.5 Calculation of the S/N ratio In this study, the S/N ratio of the larger-the-better performance characteristic was used for each Kansei response. The S/N ratio was calculated using Eq. (2) based on the evaluation value of the four Kansei words parameter in 27 car form designs (experiments) by the total number of subjects (n) (i.e. 219 subjects). The evaluation values used in the calculation are the scores obtained from the participants' evaluation using a 5-point Likert scale as mentioned in Section 4.4. The S/N ratios for each Kansei response and car form design are summarized in columns 2 through 5 of Table 6. Table 6
Results of S/N ratio and MPCI. S/N ratio
Experiment no.
Elegant
Youthful
Modern
Sporty
1 2 3 4 5 6 7 8 9 10 11 12 13 14 15 16 17 18 19 20 21 22 23 24 25 26 27
6.113 6.529 5.698 7.867 5.910 8.344 7.127 8.279 7.347 6.988 6.493 7.016 8.590 4.953 9.760 9.813 6.559 8.610 6.546 7.727 6.867 6.447 10.282 6.434 6.778 10.664 7.463
2.158 5.681 6.945 6.489 7.458 8.361 9.538 9.199 8.137 2.224 1.279 3.579 8.550 2.414 8.309 5.917 4.979 8.497 1.164 2.241 1.226 3.196 4.244 2.537 3.154 7.314 5.323
6.772 5.632 7.424 8.086 7.544 7.343 8.837 9.009 6.551 7.092 3.783 7.345 8.838 5.095 10.415 9.970 6.550 9.464 4.060 7.413 4.301 5.822 9.406 5.471 3.955 10.019 7.867
2.032 3.522 5.640 6.492 4.959 6.443 8.937 9.099 6.503 5.558 1.160 4.700 8.374 5.312 8.702 7.728 6.459 8.815 1.417 5.279 1.551 5.087 6.235 3.882 5.456 8.743 7.649
MPCI 0.2107 0.3377 0.4318 0.6067 0.4717 0.6776 0.8214 0.8648 0.6492 0.3259 0.0635 0.3896 0.8003 0.1860 0.8916 0.8202 0.4731 0.8448 0.0627 0.3644 0.0668 0.3243 0.7516 0.2860 0.2417 0.9362 0.6379
4.6 Fuzzy logic operations The fuzzy logic system was used to obtain the multiple performance characteristics index (MPCI) as a single output value. The S/N ratios for ‘elegant’, ‘youthful’, ‘modern’ and ‘sporty’ were used as the input variables whereas the MPCI was used as the output variable for the fuzzy inference rules. The triangular membership function was chosen since it is commonly used in practical applications and simplifies the computational process (Yeh and Deng, 2004). The input variables were converted into linguistic fuzzy subsets (small, medium, and large) using three membership functions of triangular fuzzy numbers, as shown in Figs. 4a–4d. Similarly, the output variable was converted into linguistic fuzzy subsets (very small, small, small-middle, middle, middle-large, large and very large) using seven membership functions of triangular fuzzy numbers, as shown in Fig. 4e.
[DOI: 10.1299/jamdsm.2016jamdsm0108]
© 2016 The Japan Society of Mechanical Engineers
29
Sutono, Abdul-Rashid, Aoyama and Taha, Journal of Advanced Mechanical Design, Systems, and Manufacturing, Vol.10, No.9 (2016)
Small 1
Middle
Small
Large
0.8
Small 1
0.4
0.6
0.4
6
7
8
9
10
2
S/N Ratio for Elegant
3
4
0.4
5
6
7
8
4
9
5
S/N Ratio for Youthful
(a) Small 1
0.6
0
0 5
Large
Very Small
6
7
8
9
10
S/N Ratio for Modern
(b)
Middle
Large
0.2
0.2
0
Middle
0.8
Degree of membership
0.6
0.2
(c)
Small
Smaller Middle
Middle
Larger Middle
Large
Very Large
1
0.8
0.8
Degree of membership
Degree of membership
Large
0.8
Degree of membership
Degree of membership
Middle
1
0.6
0.4
0.2
0.6
0.4
0.2
0
0 2
3
4
5
6
7
8
9
0
0.2
0.4
0.6
0.8
1
MPCI
S/N Ratio for Sporty
(d)
(e)
Fig. 4 Membership functions of the fuzzy variable: (a) S/N ratio for elegant, (b) S/N ratio for youthful, (c) S/N ratio for modern, (d) S/N ratio for sporty, (e) Multiple performance characteristics index.
Fuzzy reasoning was constructed based on four inputs and one output, as shown in Fig. 1. The fuzzy rule base consisted of a group of IF-THEN statements for the four S/N ratios (x1, x2, x3 and x4) and single multi-response output (y). Three fuzzy subsets were assigned to the four input variables (see Figs. 4a–4d) whereas seven fuzzy subsets were assigned to the MPCI output variable (see Fig. 4e). The fuzzy input and output expressions used for constructing fuzzy rules base according to its fuzzy subset are presented in Table 7. The degrees of membership were computed for the fuzzy sets based on the values of x1, x2, x3, x4 and y. Based on the fuzzy input and output expressions in Table 7, the number of rules are 34 = 81 rules to build a fuzzy rule base as there are three fuzzy subsets on each four input variables. The fuzzy rule base which consists of eighty-one rules (see Table 8) was derived directly using the IF-THEN rule statements in Eq. (5) based on the fact that a better MPCI is given by a higher S/N ratio. The membership function of a fuzzy multi-response output was then computed as decision criteria based on Mamdani implication method of inference reasoning using Eq. (6). Following this, the defuzzifier computed the non-fuzzy (crisp) value using Eq. (7) to obtain the final MPCI. Table 7
Fuzzy expression of input and output variables. Fuzzy input
Elegant (x1) Youthful (x2) Modern (x3) Small Medium Large
Small Medium Large
Small Medium Large
Fuzzy output Sporty (x4)
MPCI (y)
Small Medium Large
Very small Small Small-middle Middle Middle-large Large Very large
The S/N ratio results and their MPCI for each design alternative are presented in column 6 of Table 6. It can be deduced that a higher S/N ratio results in a higher MPCI, which indicates that a car form design with a higher performance characteristic leads to a higher S/N ratio for the Kansei response.
[DOI: 10.1299/jamdsm.2016jamdsm0108]
© 2016 The Japan Society of Mechanical Engineers
10 2
Sutono, Abdul-Rashid, Aoyama and Taha, Journal of Advanced Mechanical Design, Systems, and Manufacturing, Vol.10, No.9 (2016)
Table 8 IF (Antecedent) Rule 1 2 3 4 5 6 7 8 9 10 11 12 13 14 15 16 17 18 19 20 21 22 23 24 25 26 27 28 29 30 31 32 33 34 35 36 37 38 39 40 41
Elegant Youthful Modern (x1) (x2) (x3) S S S S S S S S S S S S S S S S S S S S S S S S S S S M M M M M M M M M M M M M M
S S S S S S S S S M M M M M M M M M L L L L L L L L L S S S S S S S S S M M M M M
Fuzzy rules table used to determine the MPCI value. THEN (Consequent) Sporty MPCI (x4) (y)
S S S M M M L L L S S S M M M L L L S S S M M M L L L S S S M M M L L L S S S M M
S M L S M L S M L S M L S M L S M L S M L S M L S M L S M L S M L S M L S M L S M
VS VS S VS S SM S SM M VS S SM S SM M SM M LM S SM M SM M LM M LM L VS S SM S SM M SM M LM S SM M SM M
Rule
IF (Antecedent) Elegant Youthful Modern (x1) (x2) (x3)
42 43 44 45 46 47 48 49 50 51 52 53 54 55 56 57 58 59 60 61 62 63 64 65 66 67 68 69 70 71 72 73 74 75 76 77 78 79 80 81
M M M M M M M M M M M M M L L L L L L L L L L L L L L L L L L L L L L L L L L L
M M M M L L L L L L L L L S S S S S S S S S M M M M M M M M M L L L L L L L L L
M L L L S S M S M L M L L S S S M M M L L L S S S M M M L L L S S S M M M L L L
THEN (Consequent) Sporty MPCI (x4) (y) L S M L S M S L M S L M L S M L S M L S M L S M L S M L S M L S M L S M L S M L
LM M LM L SM M M LM LM LM L L VL S SM M SM M LM M LM L SM M LM M LM L LM L VL M LM L LM L VL L VL VL
4.7 Determination of the optimum combination of design parameters Since the experimental layout was orthogonal, it is possible to segregate the effect of each design parameter on the MPCI at different levels. Factor effect analysis was used to determine the optimum combination of design parameters based on the MPCI using the fuzzy-based Taguchi method. The factor effect analysis converted the results of the fuzzy logic system by averaging the MPCI for each level of the corresponding design parameter using the response table of the Taguchi method. The response table and response graph obtained from the average value of the MPCI for each design parameter level is shown in Table 9 and Fig. 5, respectively. The total mean of the MPCI for the 27 car form
[DOI: 10.1299/jamdsm.2016jamdsm0108]
© 2016 The Japan Society of Mechanical Engineers
11 2
Sutono, Abdul-Rashid, Aoyama and Taha, Journal of Advanced Mechanical Design, Systems, and Manufacturing, Vol.10, No.9 (2016) designs is presented in the last row of Table 9. In general, the larger the total mean of the MPCI, the better the performance characteristics will be. Nevertheless, it is necessary to determine the relative significance of the design parameters which contribute to the performance characteristics in order to determine the optimum combination of design parameters. Hence, ANOVA was carried out to identify the relative importance of all design parameters which contributed to the performance characteristics. ANOVA was used to identify the design parameters which made a significant contribution to the performance characteristics. The ANOVA results for MPCI are presented in Table 10. Table 9 Factor A B C D E F G H I J K L M
Response table of design parameters and levels on MPCI.
Design parameter Ratio of car height to car length Ratio of fore region length to overall length Ratio of front height to overall height Gradient of front bumper Gradient of hood Gradient of A-pillar Ratio of rear region length to overall length Ratio of rear region height to overall height Gradient of C-pillar Gradient of rear bumper Gradient of trunk Gradient of rear fender bottom Gradient from side top
MPCI Level 1
Level 2
Level 3
0.5635# 0.2503 0.4978 0.5193# 0.4682 0.6463# 0.3725 0.5254# 0.5304# 0.5024 0.4601 0.4319 0.4927
0.5328 0.5551 0.4834 0.4876 0.4943 0.5124 0.4921 0.5143 0.5267 0.4749 0.5005 0.5023 0.5502#
0.4080 0.6484# 0.5230# 0.4974 0.5417# 0.3455 0.6397# 0.4645 0.4471 0.5269# 0.5437# 0.5701# 0.4613
Max-Min 0.1556 0.3980 0.0396 0.0318 0.0735 0.3008 0.2672 0.0609 0.0833 0.0520 0.0837 0.1382 0.0889
Total mean value of the MPCI = 0.5001 #
Maximum design parameter level
Fig. 5
Response graph for multiple performance characteristics index.
[DOI: 10.1299/jamdsm.2016jamdsm0108]
© 2016 The Japan Society of Mechanical Engineers
12 2
Sutono, Abdul-Rashid, Aoyama and Taha, Journal of Advanced Mechanical Design, Systems, and Manufacturing, Vol.10, No.9 (2016)
Table 10
ANOVA results of MPCI.
Factor
Design parameter
DF
SS
MS
F-value
Contribution (%)
A B C D E F G H I J K L M
Ratio of car height to car length Ratio of fore region length to overall length Ratio of front height to overall height Gradient of front bumper Gradient of hood Gradient of A-pillar Ratio of rear region length to overall length Ratio of rear region height to overall height Gradient of C-pillar Gradient of rear bumper Gradient of trunk Gradient of rear fender bottom Gradient from side top Error Total F0.05(2,12) = 3.88
2 2 2 2 2 2 2 2 2 2 2 2 2 12 38
0.1222 0.7876 0.0072 0.0048 0.0250 0.4088 0.3225 0.0189 0.0399 0.0122 0.0315 0.0860 0.0366 0.2115 2.1146
0.0611 0.3938 0.0036 0.0024 0.0125 0.2044 0.1613 0.0095 0.0199 0.0061 0.0158 0.0430 0.0183 0.0176
3.4664 22.3487 0.2052 0.1351 0.7088 11.5981 9.1517 0.5367 1.1318 0.3454 0.8944 2.4402 1.0375
5.78 37.25 0.34 0.23 1.18 19.33 15.25 0.89 1.89 0.58 1.49 4.07 1.73 10 100
DF = Degree of freedom; SS = Sum of square; MS = Mean square
4.8 Confirmation test A confirmation test was carried out once the optimum car form designs had been generated using the fuzzy-based TM. The main purpose of the confirmation test was to verify the performance of the optimum car form designs and assess the capability of the proposed methods in designing a product form which satisfies multiple Kansei responses. Two Malaysian car models were chosen for comparison with the optimum car form designs; these were basically the latest models currently available in the automobile market in Malaysia. Each model was converted into a two-dimensional image of a car profile in accordance with the design parameters used in this study so that the models were consistent with the design alternatives used in the Taguchi experiment. The competitor and optimum car form designs used in the confirmation test are shown in Figs. 6a–4b.
(a)
(b)
(c)
Fig. 6 Competitor and optimum car profiles evaluated in the confirmation test: (a) Competitor design 1, (b) Competitor design 2, (c) Optimum design obtained from fuzzy-based TM.
A total of 80 subjects (40 males and 40 females) with an age range of 18–56 years participated in the confirmation test. The questionnaire was constructed based on the semantic differential method and the subjects were required to rank the three car form designs for each Kansei response on a 5-point Likert scale. The S/N ratio for each Kansei response was determined by calculating the data scores of the confirmation test to verify the performance of the optimum car form designs. The results are tabulated in Table 11. The performance of the three car form designs was also evaluated based on ranking scores (Chen and Chuang, 2008) in order to assess the capability of the fuzzy-based TM. The performance of each car form design was ranked based on its S/N ratio magnitude. A car form design was ranked as first, second and third if the design was given a score of 3, 2 and 1, respectively. The ranks and total score for each car form design were computed, and the results presented in Table 11. For example, car form design no. 3 was given a score of 3 for three Kansei responses (youthful, modern and sporty) and a score of 2 for the elegant response. This gives a total score of 11 (3 × 3 + 2 = 11).
[DOI: 10.1299/jamdsm.2016jamdsm0108]
© 2016 The Japan Society of Mechanical Engineers
13 2
Sutono, Abdul-Rashid, Aoyama and Taha, Journal of Advanced Mechanical Design, Systems, and Manufacturing, Vol.10, No.9 (2016) Table 11 No.
Results of the confirmation test.
Car form design
Elegant Youthful Modern Sporty Performance evaluation based on S/N ratio
1 2 3
Competitor design 1 Competitor design 2 Optimum design obtained from fuzzy-based TM
Best performance in Taguchi’s OA experiment Improvement in S/N ratio 1 2 3
Overall performance
8.096 4.879 7.832
6.208 5.739 11.680
9.261 5.429 12.042
8.393 4.814 11.448
7.989 5.215 10.751
10.664 (2.832)
9.538 2.142
10.415 1.627
9.099 2.349
-
2 1 3
2 1 3
Performance evaluation based on ranking score Competitor design 1 3 2 Competitor design 2 1 1 Optimum design obtained from fuzzy-based TM 2 3
Total score 9 4 11
5. Discussion The fuzzy-based TM was used to determine the optimum combination of design parameters for product form design with multiple Kansei responses. This integrated design optimization method was used to overcome the shortcoming of traditional TM which is incapable of solving a multi-response optimization problem. The fuzzy logic system is integrated with TM to simplify the optimization process by converting the complicated multiple performance response values into single performance response index, the MPCI. A car form design silhouette is used as an illustrative case study in order to demonstrate the applicability of this integrated design optimization method. In the process of determining the optimum combination of car design parameters in multi-response problem, the S/N ratio calculation was performed to transform the evaluation values obtained from the Taguchi experiments into S/N ratio of multiple Kansei responses (Table 6). For overall evaluation of the multiple Kansei response, fuzzy logic operations transform the S/N ratio of multiple Kansei responses into a single MPCI (Table 6). Factor effect analysis of the MPCI over 13 design parameters using Taguchi’s L27 OA was conducted to select the optimum combination of car design parameters. Table 9 shows the factor effect analysis response table of the average MPCI for each design parameter level and its factor effect. A greater factor effect indicates that the car design parameter has a significant influence to the MPCI. A higher MPCI value implies better multiple performance characteristics. Consequently, the level with the highest average MPCI indicates the best multiple performance characteristics. Thus, the combination of car design parameters which results in the highest average MPCI would be the optimum combination. The optimum design parameter combination was determined from the response table of MPCI in Table 9 and the graphical representation of MPCI in Fig. 5. The car design parameter levels yielding the maximum average MPCI which conform with the four representative Kansei responses are A1 B3 C3 D1 E3 F1 G3 H1 I1 J3 K3 L3 M2. These design parameter levels are therefore selected as the optimum combination of car design parameters. A car profile which is formed by the optimum combination of design parameters generated using the fuzzy-based TM that looks and feels elegant, youthful, modern and sporty is shown in Fig. 6c. The ANOVA results for MPCI (Table 10) indicate that the ratio of fore region length to overall length (B), gradient of A-pillar (F), ratio of rear region length to overall length (G), ratio of car height to car length (A) and gradient of the rear fender bottom (L) were the design parameters which significantly influenced the MPCI, with a contribution of 37.25, 19.33, 15.25, 5.78 and 4.07%, respectively. The F-values for these design parameters are greater than the critical F0.05(2,12) value of Fisher’s F-test (3.88). In contrast, the other eight design parameters (i.e. C, K, H, J, M, D, I and E) made an insignificant contribution to the MPCI since the F-values were less than the critical value. Hence, it is evident from the ANOVA results that B, F, G, A and L are the design parameters which significantly influence the performance characteristics of the Kansei responses for an optimum car form design using the fuzzy-based TM. In addition, it can be seen from Table 10 that the percentage of contribution error is 10%, which indicates that the experiment had high feasibility and sufficiency. In general, an experiment is acceptable without neglecting major factors if the percentage of error is less than 15%. Conversely, an experiment is unacceptable with losses in some significant factors if the percentage of error is greater than 50% (Lu et al., 2009). Based on the percentage of error obtained in this study, it can be concluded that the fuzzy-based Taguchi design optimization method is highly acceptable.
[DOI: 10.1299/jamdsm.2016jamdsm0108]
© 2016 The Japan Society of Mechanical Engineers
14 2
Sutono, Abdul-Rashid, Aoyama and Taha, Journal of Advanced Mechanical Design, Systems, and Manufacturing, Vol.10, No.9 (2016) Based on a confirmation test (Table 11), it can be seen that car form design no. 3 (i.e. the optimum design generated by the fuzzy-based TM) has the highest S/N ratio for three Kansei responses (youthful, modern and sporty) as well as the highest overall performance. In addition, car form design no. 3 was compared with the best performance for each Kansei response in Taguchi’s OA experiment. The results confirm that the fuzzy-based TM is capable of improving the quality of a car form by generating the optimum combination of design parameters while taking into account multiple consumers’ emotional responses. It can be seen from Table 11 that car form design no. 3 also has the highest total score among the three car form designs, with a value of 11. Hence, it can be deduced that the fuzzy-based TM is capable of optimizing a product form design with multiple Kansei responses.
6. Conclusions An integrated design optimization method (i.e. fuzzy-based TM) was proposed in this study with the aim to determine the optimum combination of design parameters for product form design. A car form design was chosen as the experimental case study in order to demonstrate the applicability of the integrated design optimization method. In general, it was found that the method offers a simple, efficient and straightforward means for designers to generate an optimum product form design with multiple Kansei responses. The following conclusions are drawn based on the results of this study: The fuzzy-based TM accounts for multiple Kansei responses (i.e. elegant, youthful, modern and sporty) simultaneously in generating the optimum combination of design parameters for a car profile. The factors/levels of all design parameters have been identified and the optimum combination has been found to be A1 B3 C3 D1 E3 F1 G3 H1 I1 J3 K3 L3 M2. The performance of the optimum car form designs generated by the fuzzy-based TM is significantly influenced by the ratio of car height to car length (A), ratio of fore region length to overall length (B), gradient of A-pillar (F), ratio of rear region length to overall length (G) and gradient of the rear fender bottom (L), contributing 81.68 of the total variance. The fuzzy-based TM improves overall performance relative to the best performance of each Kansei response in Taguchi’s OA. The results of the confirmation test and performance evaluation using ranking scores reveal that the fuzzy-based TM outperforms the competitors’ car form designs. The fuzzy-based TM is capable of optimizing a product form design with multiple Kansei responses. Even though a car form design was used as the experimental case study, the fuzzy-based Taguchi method can also be applied to optimize other product designs with a variety of design parameters.
Acknowledgment This research was supported by the Japan International Cooperation Agency (JICA) for the ASEAN University Network-Southeast Asia Engineering Education Development Network (AUN/SEED-Net) under the Contract No.: JICA 8123227, as well as the Malaysian Ministry of Higher Education (MOHE) under the High Impact Research Grant, Grant No.: HIR-MOHE D000008-16001.
References Akay, D. and Kurt, M., A neuro-fuzzy based approach to affective design, International Journal of Advanced Manufacturing Technology, Vol.40, No.5–6 (2009), pp.425–437. Chen, C. C. and Chuang, M. C., Integrating the Kano model into a robust design approach to enhance customer satisfaction with product design, International Journal of Production Economics, Vol.114, No.2 (2008), pp.667– 681. Cross, N., Engineering Design Methods: Strategies for Product Design (2008), John Wiley & Sons. El-Taweel, T. A. and El-Axir, M. H., Analysis and optimization of the ball burnishing process through the Taguchi technique, International Journal of Advanced Manufacturing Technology, Vol.41, No.3–4 (2009), pp.301–310. Gupta, A., Singh, H. and Aggarwal, A., Taguchi-fuzzy multi output optimization (MOO) in high speed CNC turning of
[DOI: 10.1299/jamdsm.2016jamdsm0108]
© 2016 The Japan Society of Mechanical Engineers
15 2
Sutono, Abdul-Rashid, Aoyama and Taha, Journal of Advanced Mechanical Design, Systems, and Manufacturing, Vol.10, No.9 (2016) AISI P-20 tool steel, Expert Systems with Applications, Vol.38, No.6 (2011), pp.6822–6828. Hong, S. W., Han, S. H. and Kim, K. J., Optimal balancing of multiple affective satisfaction dimensions: a case study on mobile phones, International Journal of Industrial Ergonomics, Vol.38, No.3–4 (2008), pp.272–279. Hsiang, S. H., Lin, Y. W. and Lai, J. W., Application of fuzzy-based Taguchi method to the optimization of extrusion of magnesium alloy bicycle carriers, Journal of Intelligent Manufacturing, Vol.23, No.3 (2012), pp.629–638. Hsieh, K. L., Tong, L. I., Chiu, H. P. and Yeh H. Y., Optimization of a multi-response problem in Taguchi's dynamic system, Computers & Industrial Engineering, Vol.49, No.4 (2005), pp.556–571. Huang, M. S., Tsai, H. C. and Huang, T. H., Applying Kansei engineering to industrial machinery trade show booth design, International Journal of Industrial Ergonomics, Vol.41, No.1 (2011), pp.72–78. Lai, H. H., Chang, Y. M. and Chang, H. C., A robust design approach for enhancing the feeling quality of a product: a car profile case study, International Journal of Industrial Ergonomics, Vol.35, No.5 (2005), pp.445–460. Lin, B. T. and Kuo, C. C., Application of the fuzzy-based Taguchi method for the structural design of drawing dies, International Journal of Advanced Manufacturing Technology, Vol.55, No.1–4 (2011), pp.83–93. Lu, H. S., Chang, C. K., Hwang, N. C. and Chung, C. T., Grey relational analysis coupled with principal component analysis for optimization design of the cutting parameters in high-speed end milling, Journal of Materials Processing Technology, Vol.209, No.8 (2009), pp.3808–3817. Nagamachi, M., Kansei engineering as a powerful consumer-oriented technology for product development, Applied Ergonomics, Vol. 33, No. 3 (2002), pp. 289–294. Nagamachi, M., Perspectives and the new trend of Kansei/affective engineering, The TQM Journal, Vol.20, No.4 (2008), pp.290–298. Nagamachi, M., Kansei/affective Engineering (2011), CRC Press. Nordgren, A. K., Exploring automotive shape with Kansei design: a systematic approach to building design support systems with shape sensibility, Dissertation (2007), Keio University. Oztekin, A., Iseri, A., Zaim, S. and Nikov, A., A Taguchi-based Kansei engineering study of mobile phones at product design stage, Production Planning & Control, Vol.24, No.6 (2013), pp.465–474. Ross, T. J., Fuzzy Logic with Engineering Applications (2010), John Wiley & Sons. Saaty, T. L. and Ozdemir, M. S., Why the magic number seven plus or minus two, Mathematical and Computer Modelling, Vol.38, No.3–4 (2003), pp.233–244. Schütte, S. T. W., Eklund, J., Axelsson, J. R. C. and Nagamachi, M., Concepts, methods and tools in Kansei engineering, Theoretical Issues in Ergonomics Science, Vol.5, No.3 (2004), pp.214–231. Shieh, M.-D., Wang, T.-H. and Yang, C.-C., A clustering approach to affective response dimension selection for product design, Journal of Convergence Information Technology, Vol.6, No.2 (2011), pp.197–206. Sutono, S. B., Selection of representative Kansei adjectives using cluster analysis: a case study on car design, International Journal of Advanced Engineering, Management and Science, Vol.2, No.11 (2016), pp.1885–1891. Sutono, S. B., Taha, Z., Abdul-Rashid, S. H., Aoyama, H. and Subagyo, Application of robust design approach for design parameterization in Kansei engineering, Advanced Materials Research, Vol.479–481 (2012), pp.1670– 1680. Taguchi, G., Chowdhury, S. and Wu, Y., Taguchi's Quality Engineering Handbook (2005), John Wiley & Sons. Tzeng, Y. F. and Chen, F. C., Multi-objective optimisation of high-speed electrical discharge machining process using a Taguchi fuzzy-based approach, Materials & Design, Vol.28, No.4 (2007), pp.1159–1168. Wu, F. C., Optimising robust design for correlated quality characteristics, International Journal of Advanced Manufacturing Technology, Vol.24, No.1–2 (2004), pp.1–8. Yang, C. C., Constructing a hybrid Kansei engineering system based on multiple affective responses: application to product form design, Computers & Industrial Engineering, Vol.60, No.4 (2011), pp.760–768. Yeh, C. H. and Deng, H. P., A practical approach to fuzzy utilities comparison in fuzzy multicriteria analysis, International Journal of Approximate Reasoning, Vol.35, No.2 (2004), pp.179–194.
[DOI: 10.1299/jamdsm.2016jamdsm0108]
© 2016 The Japan Society of Mechanical Engineers
16 2