May 9, 2012 - provides the best results independently from the considered dataset. ..... recognition and Digital Techniques, (ICAPRDT'99), Calcutta, india, 27- ...
10 Fuzzy Inference System for Data Processing in Industrial Applications Silvia Cateni and Valentina Colla Scuola Superiore Sant’Anna, TeCIP Institute, PERCRO, Pisa Italy 1. Introduction In the last years Fuzzy Inference Systems (FIS) have been used in several industrial applications in the field of automatic control, data classification, decision analysis, expert systems, time series prediction, and pattern recognition. The large use of FIS in the industrial field is mainly due to the nature of real data, that are often incomplete, noisy and inconsistent, and to the complexity of several processes, where the application of mathematical models can be impractical or even impossible, due to the lack of information on the mechanisms ruling the phenomena under consideration. Fuzzy theory is in fact essential and applicable to many complex systems and the linguistic formulation of its rule basis provides an optimal, very suitable and intuitive tool to formalise the relationships between input and output variables. In real world database anomalous data (often called outliers) can be frequently found, which are due to several causes, such as erroneous measurements or anomalous process conditions. Outliers elimination is a necessary step, for instance, when building a training database for tuning a model of the process under consideration in standard operating conditions. On the other hand, in many applications, such as medical diagnosis, network intrusion or fraud detection, rare events are more interesting than the common samples. The rarity of certain patterns combined to their low separability from the rest of data makes difficult their identification. This is the case, for instance, of classification problems when the patterns are not equally distributed among the classes (the so-called imbalanced dataset (Vannucci et al., 2011)). In many real problems, such as document filtering and fraud detection, a binary classification problem must be faced, where the data belonging from the “most interesting” class are far less frequent than the data belonging to the second class, which corresponds to normal situations. The main problem with imbalanced dataset is that the standard learners are biased towards the common samples and tend to reduce the error rate without taking the data distribution into account. In this chapter a preliminary brief review of traditional outlier detection techniques and classification algorithms suitable for imbalanced dataset is presented. Moreover some recent practical applications of FIS that are capable to outperform the widely adopted traditional methods for detection of rare data are presented and discussed.
www.intechopen.com
216
Fuzzy Inference System – Theory and Applications
2. Outlier detection Outliers are measurements that are different from other values of the same dataset and can be due to measurement errors or to the variability of the phenomenon under consideration. Hawkins (Hawkins, 1980) defined an outlier as "an observation that deviates so much from other observations as to arouse suspicion that it was generated by a different mechanism". The detection of outlier is an important step of data mining because it improves the quality of data and it represents a useful pre-processing phase in many applications, such as financial analysis, network intrusion detection and fraud detection (Hodge, 2004). Classical outlier detection methods can be classified into four main groups: distance-based, density-based, clustering-based and statistical-based approaches. All these approaches have several advantages or limitations and in the last years a lot of contributions have been proposed on this subject. Artificial intelligence techniques have been widely applied to overcome the traditional methods and improve the cleanness of data; in particular some fuzzy logic-based approaches proved to outperform classical methodologies. 2.1 Distance-based methods Distance-based method is based on the concept of the neighborhood of a sample and it was introduced by Knorr and Ng (Knorr & Ng, 1999). They gave the following definition: "An object O in a dataset T is a DB(p,D)-outlier if at least fraction p of the objects in T lie at a distance greater than D from O". The parameter p represents the minimum fraction of samples that is out of an outlier's D-neighborhood. This definition needs to fix a parameter and do not provide a degree of outlierness. Ramaswamy et al. (Ramaswamy et al., 2000) modified the definition of outlier: "Outliers are the top n data points whose distance to the kth nearest neighbor is greatest". Jimenez-Marquez et al. (Jimenez-Marquez et al., 2002) introduced the Mahalanobis Outlier Analysis (MOA) which uses Mahalnobis distance (Mahalanobis, 1936) as outlying degree of each point. Another outlier detection method based on Mahalanobis distance was proposed by Matsumoto et al. (Matsumoto et al., 2007). Mahalnobis distance is defined as the distance between each point and the center of mass. This approach considers outliers data points that are far away from their center of mass. 2.2 Density-based methods Density-based methods calculate the density distribution of data and classify as outliers the points lying in low-density regions. Breunig et al. (Breunig et al., 2000) allocate a local outlier factor (LOF) to each point on the basis of the local density of its neighborhood. In order to understand the formula concerning the Local Outlier Factor is necessary introduce several definitions. The k-distance of a point x is the distance between two points x, y belonging to the dataset D such that for at least k points data d(x,y')≤d(x,y); where y'є D-{x} and k an integer value. The k distance neighborhood of a data point x includes points whose distance from x is not greater than the k distance. Moreover the reachability distance of a data point x respect to the data point y is defined as the maximum between k-distance of y and distance between the two data points. The Local reachability density of the data point x is defined as the inverse of the mean reachability distance based on the MinPtsnearest neighbors of x. Finally the Local Outlier Factor is defined as the mean of the ratio of the local reachability density of x and the cardinality of the set including the MinPts-nearest
www.intechopen.com
217
Fuzzy Inference System for Data Processing in Industrial Applications
neighbors of x. It is evident that MinPts is an important parameter of the proposed algorithm. Papadimitriou et al. (Papadimitriou et al., 2003) propose LOCI (Local Correlation Integral) which uses statistical values belonging to data to solve the problem of choosing values for MinPts. 2.3 Clustering-based methods Clustering-based methods perform a preliminary clustering operation on the whole dataset and then classify as outliers the data which are not located in any cluster. Fuzzy C-means algorithm (FCM) is a method of clustering developed by Dunn in 1973 (Dunn, 1973) and improved by Bezdek in 1981 (Bezdek, 1981). This approach is based on the notion of fuzzy c-partition introduced by Ruspini (Ruspini, 1969). Let us suppose X={x1, x2, ... xn} be a set of data where each sample xh (h=1, 2, ... n) is a vector with dimensionality p. Let Ucn be a set of real c×n matrices where c is an integer value which can assume values between 2 and n. The fuzzy C-partition space for x is the following set: Mcn = { UєUcn; uihє[0, 1] ; ∑
,
∑
}
(1)
where uih is the degree of membership of xn in cluster i (1≤i≤c). The objective of FCM approach is to provide an optimal fuzzy C-partition minimizing the following function: , ;
∑
∑
‖
‖
(2)
where V=(v1, v2,... vc) is a matrix of cluster centres, ║.║is the Euclidean norm and m is a weighting exponent (m>1). Many clustering-based outlier approaches have been recently developed. For instance, Jang et al. (Jang et al., 2001) proposed an outlier-finding process called OFP based on k-means algorithm. This approach considers small clusters as outliers. Yu et al. (Yu et al., 2002) proposed an outlier detection method called FindOut, which is based on removing of clusters from original data to identify outliers. Moreover He et al. (He et al., 2003) introduced the notion of cluster-based local outlier and outlier detection method (FindCBLOF), which exploits a cluster-based LOF in order to identify the outlierness of each sample. Finally Jang et al. (Jang et al., 2005) proposed a novel method in order to improve the efficiency of FindCBLOF approach. 2.4 Statistical-based methods Statistical-based methods use standard distribution to fit the initial dataset. Outliers are defined considering the probability distribution and assuming that the data distribution is a priori known. The main limit of this approach lies in the fact that, for many applications, the prior knowledge is not always distinguishable and the cost for fitting data with standard distribution could be considerable. A widely used method belonging to distribution-based approaches has been proposed by Grubbs (Grubbs, 1969). This test is efficient if data can be approximated by a Gaussian distribution. The Grubbs test calculates the following statistics: (3)
www.intechopen.com
218
Fuzzy Inference System – Theory and Applications
where µ is the mean value and ϭ the standard deviation of data. When G is greater than a fixed threshold the i-th data-point is classified as an outlier. The critical value depends on the required significance level of test; common values are 1% and 5%. Other similar tests that assume that data are normally distributed are Rosner's test (Gibbons, 1994) and Dixon's test (Dixon, 1993). 2.5 Fuzzy Inference System based method In the last years novel interesting FIS-based outlier detection approaches have been proposed in order to outperform the classical approaches. Yousri et al. (Yousri et al., 2007) proposes an approach which combine an outlier detection method with a clustering algorithm. The outlier detection method is used for two objectives: to give a hard membership for outliers to decide if the considered pattern is an outlier or not and to give a degree of outlierness. A clustering algorithm is then used to allocate patterns to clusters. Let P indicate the dataset and p its generic sample and let To be the outlier detection technique and Tc the adopted clustering algorithm. The combination of outlier detection and clustering algorithms is provided by the following formula, providing the degree of outlierness of a sample p: (4) where OTo (p) is the degree of outlierness resulting from To for each sample p while OTc (p) is the degree of outlierness resulting from Tc considering an outlier the patterns allocated to tiny clusters or not assigned to any cluster. Finally wo and wc represent the weights given to both algorithms to determine outliers. The two weights must be not negative (wo, wc ≥ 0) and their sum must be positive (wo+wc > 0). Equation (4) can be rewritten as follows:
(5)
The parameter wo/wc should be accurately fixed considering a balance between the membership degree given to the outlier cluster and the clusters in the set of initial groups. The main advantage of this approach is that it is general, i.e. it can combine any outlier detection method with any clustering algorithm, and it is effective with low and high dimensional dataset. Another novel fuzzy approach is proposed by Xue et al. (Xue et al., 2010). The approach is called Fuzzy Rough Semi-Supervised Outlier Detection (FRSSOD) and combines two methods: the Semi-Supervised Outlier Detection method (SSOD) (Gao et al., 2006) and the clustering method called Fuzzy Rough C-Means clustering (FRCM) (Hu & Yu, 2005). The aim of this approach is to establish if samples on the boundary are outliers or not, by exploiting the advantages of both approaches. In order to understand FRSSOD a brief description of SSOD and FRCM is necessary.
www.intechopen.com
219
Fuzzy Inference System for Data Processing in Industrial Applications
SSOD is a semi-supervised outlier detection method (Li et al. 2007; Zhang et al. 2005; Gao et al., 2006; Xu & Liu, 2009) main that uses both unlabeled and labelled samples in order to improve the accuracy without the need for a high amount of data. Let us suppose that X is the dataset with n samples forming K clusters. The first l samples are labelled as binary values: the null samples are considered outliers while the unitary value are not outliers. If we consider that outliers are not included in any of the K clusters, an n×K matrix must be found whose elements tih ( i=1,2 ... ,n ; h=1, 2, ..., K) are unitary when xi belongs to cluster Ch. Outliers are determined as points that do not belong to any clusters through the minimization of the following objective function: ∑
∑
,
∑
∑
∑
∑
(6)
where ch represent the centroid of cluster Ch, dist is the Euclidean distant and 1, 2 are adjusting parameters. The objective function is the sum of three parts. The first part come from k-means clustering and outliers are not considered, the second part is used to constrain the number of outliers below a certain threshold and finally the third part is used to maintain consistency of labelling introduced by authors with existing label. FRCM is a combination between Fuzzy C-means algorithm and Rough C-means approach. Fuzzy C-means method was introduced by Dunn (Dunn, 1974) and it is an unsupervised clustering algorithm. The approach assigns a membership degree to each sample for each cluster by minimizing the following objective function:
, ;
∑
∑
‖
‖
(7)
where V = (v1, v2, ..., vc) is the vector representing the centres of the clusters, uik is the degree of membership of the sample xk to the cluster i. The iteration stops when a stable condition is reached and the sample is allocated to the cluster for which the membership value is maximum. The centres initialization is an important step affecting the final result. The RCM approach is based on the concept of C-means clustering and on the concept of rough set. Rough set was introduced by Pawlak (Pawlak, 1982; Pawlak, 1991). In the rough set concept each observation of the universe has a specified amount of information. The objects which have the same information are indistinguishable. A rough set, unlike a precise set, is characterized by lower approximation, upper approximation and boundary region. The lower approximation includes all objects belonging to the considered notion, while the upper approximation contains objects which possibly belong to the notion. The boundary region represents the difference between the two regions. In RCM method each cluster is considered as a rough set having the three regions. A sample, unlike in the classical clustering algorithm, can be member of more than one cluster. Also, it is possible to have overlaps between clustering. Lingras and West (Lingras & West, 2004) proposed a method based on the following four properties: -
A sample can belong only to one of lower approximation regions. The lower approximation region of a cluster must be a subset of its upper approximation region. If a sample do not belong to any lower approximation regions then it is member of at least two upper approximation regions. Samples belonging to boundary region are undecided data and are assigned to two or more upper approximation regions.
www.intechopen.com
220
Fuzzy Inference System – Theory and Applications
FRCM integrates the concept of rough set with the fuzzy set theory adding a fuzzy membership value of each point to the lower approximation and boundary region of a cluster. The approach divides data into two sets, a lower approximation region and a boundary region; then the points belonging to the boundary region are fuzzified. Let us suppose that are respectively the lower and upper X={x1, x2, ..., xn} is the available dataset and Ch and approximation of the cluster h. The boundary region is calculated as the difference between the two regions. If u={uih} are memberships of clusters the problem of FRCM become the optimization of the following function: J m ( u , v ) (uih )m dih2 n
.
H
(8)
i 1 h 1
FRSSOD combines the two methods above described, i.e. FRCM and SSOD, in order to create a novel approach. Let X be the set of data with n samples and Y its subset formed by the first l1). As the idea of SSOD approach only normal points are divided in two clusters and also the points considered as outliers don't compare in the first term of the equation. Then the second term of the equation is used to maintain the number of outliers under a certain limit and finally the third term maintains consistency of user labelling with existing label punishing also the mislabelled samples. The proposed method is applied on a synthetic dataset and on real data and results show that FRSSOD can be used in many fields having fuzzy information granulation. The experimental results show also that the proposed method has many advantages over SSOD improving outlier detection accuracy and reducing false alarm rate thanks to the control on labelled samples. The main disadvantages of the FRSSOD method are that the result depends on the determination of number of cluster, initialization of the centres of clusters and adjustment parameters. Another fuzzy based method to detect outliers is proposed by Cateni et al. (Cateni et al., 2009). The proposed approach combines different classical outlier detection techniques in order to overcome their limitations and to use their advantages. An important advantage of the proposed method lies in the fact that the system is automatic and no a priori assumptions are required. The method consists in calculating four features for each pattern by using the most popular outlier detection techniques: 1.
Distance-based. The Mahalanobis distance is calculated and normalized with respect to its maximum value. Patterns which assume value near 1 are considered outliers.
www.intechopen.com
Fuzzy Inference System for Data Processing in Industrial Applications
2.
3.
4.
221
Clustering-based. The clustering algorithm used for each method is the fuzzy Cmeans (FCM) that has already been described. The output of the clustering represents the membership degree of the selected samples to clusters and it lies in the range [0,1]. Samples for which such features is close to 0 have to be considered outliers. The FCM approach requires the number of clusters to be a priori known. If the distribution is unknown, it is not easy to find the optimal number of clusters. In this approach a validity measure based on intra-cluster and inter-cluster distance measures (Ray & Turi, 1999) is calculated in order to determine automatically the most suitable number of clusters. This step is fundamental because the result of clustering strongly depends on this parameter. Density-based. For each pattern the Local Outlier Factor (LOF) is evaluated. This feature requires that the number of the samples of nearest neighbours K must be known a-priori. Here K corresponds to the number of elements in the less populated cluster that has been previously calculated by the Fuzzy C Means algorithm. The LOF parameter lies in the range [0;1] where the unitary value means that the considered sample is an outlier. Distribution-based. The Grubbs test is performed and the result is a binary value: an unitary value indicates that the selected pattern is an outlier, is null otherwise.
This four features are fed as inputs to a FIS of the Mandani type (Mandani, 1974). The output of the system, called outlier index, represents the degree of outlierness of each pattern. Finally a threshold, set to 0.6, is used to point out the outliers. The proposed method has been tested in a dataset provided by a steelmaking industry in the pre-processing phase. The extracted data represent the chemical analysis and process variables associated to the liquid steel fabrication. A dataset has been analyzed in order to find factors that affect the final steel quality. In this case outliers can be caused by sensor failures, human error during registration of data of off-line analysis or abnormal conditions; this kind of outliers are the most difficult to discover because they do not differ so much from some correct data. In the considered problem the variables which are mostly affected by outliers are tapping temperature, reheating temperature and the addition of aluminium. First of all each variable has been normalised in order to obtain values in the range [0,1]. Table 1 illustrates the results that have been obtained on 1000 measurements through 6 different approaches: a distance-based approach, a clustering-based approach a densitybased approach, a distribution-based approach and two fuzzy-based approaches. The effective outliers are five and they have been pointed out by technical skilled personnel working on the plant and in the table are identified with alphabetic letters in order to understand how many and which outliers are correctly detected by several methods. In the second row the outliers are shown that are present for each considered variable and the other columns refer to outliers detected by each considered method. Finally, table 2 illustrates how many samples have been misclassified as outliers (the so-called false alarms) for each method. Table 2 shows that fuzzy-base approach is able to detect all outliers present in the dataset without fall in false alarms errors. Therefore the obtained results confirm the effectiveness of the fuzzy-based approaches because they outperform traditional techniques and in particular the second fuzzy proposed approach (Cateni et al., 2009) obtains the best results.
www.intechopen.com
222
OUTLIERS Mahalanobis distance Fuzzy C-means Local Outlier Factor Grubbs Test Fuzzy 1 (Yousri et al.,2007) Fuzzy 2 (Cateni et al., 2009)
Fuzzy Inference System – Theory and Applications
Tapping Temperature A -B – C
Reheating Temperature A-B-C
Aluminium addition A - B - C - D –E
B
B
A-D–E
A–B B A
A-B B A
B–C A-B-C–E B-D–E
A–B
A-B
A-B-C–E
A - B –C
A - B -C
A - B - C - D –E
Tapping Temperature A -B – C
Reheating Temperature A-B-C
Aluminium addition A - B - C - D –E
0
0
1
0 1 0
0 0 0
1 0 2
0
0
0
0
0
0
Table 1. Outlier Detection.
OUTLIERS Mahalanobis distance Fuzzy C-means Local Outlier Factor Grubbs Test Fuzzy 1 (Yousri et al.,2007) Fuzzy 2 (Cateni et al., 2009)
Table 2. Number of false alarms.
3. Imbalanced datasets In a classification task often there are more instances of a class than others. Class imbalance is mainly connected to the concept of rarity. There are two types of rarity, rare cases or outliers (as seen in the previous paragraph) and rare class where a class of interest includes few samples in comparison to the other classes present in the dataset. Outliers and rare classes are not related but there are empirical studies which demonstrate that the minority class contains more outliers than the majority class (Weiss and Provost, 2003). Imbalanced datasets are present in many real-world applications such as detecting cancerous cell (Chan and Stolfo, 1998), fraud detection (Phua et al., 2004), keyword extraction (Turney, 2000), oilspill detection (Kubat et al., 1998), direct marketing (Ling and Li, 1998), and so on. Many approaches have been proposed in order to solve the imbalance problem (Visa and Ralescu, 2005) and they include resampling the training set, feature selection (Castillo and Serrano, 2004), one class learners (Raskutti and Kowalczyk, 2004) and finally cost-sensitive learners, that take into account the misclassification cost (Zadrozny et al., 2003). In this kind of data one class is significantly larger than other classes and often the targeted class (known as positive class) is the smallest one. In this cases classification is difficult because the
www.intechopen.com
Fuzzy Inference System for Data Processing in Industrial Applications
223
conventional computational intelligence methods tend to classify all instances to the majority class (Hong et al., 2007). Moreover this methods (such as Multilayer Perceptron, Radial Basis Functions, Linear Discriminant Analysis...) cannot classify imbalanced dataset because they learn data based on minimization of accuracy without taking into account the error cost of classes (Visa & Ralescu, 2005; Alejo et al., 2006; Xie & Qiu, 2007). The performance of machine learning is typically calculated by a confusion matrix. An example of the confusion matrix is illustrated in Tab.3 where columns represent the predicted class while the rows the actual class. Most of studies in imbalanced domain are referred to binary classification, as a multi-class problem can be simplified to a two-class problem. Conventionally the class label of the minority class is positive while the class label of the majority class is negative. In the table True Negative value (TN) represents the number of negative samples correctly classified, True Positive (TP) value is the number of positive samples correctly classified, False Positive (FP) is the number of negative samples classified as positive and finally the False Negative (FN) is the number of positive samples classified as negative. Other common evaluation measures are Precision (Prec) which is a measure of the accuracy providing that a specific class has been predicted and Recall (Rec) which is a measure of a prediction model to select instances of a certain class from a data set. In this case, Recall is also referred to as true positive rate and true negative rate is also called Specificity (Spec).
Negative Positive
Predicted Negative
Predicted Positive
TN FN
FP TP
Table 3. Confusion Matrix Through this matrix the following widely adopted evaluation metrics can be calculated: Accuracy = (TP+TN)/(TP+FN+FP+TN)
(10)
FP rate = Spec =FP/(TN+FP)
(11)
TP rate = Rec = TP/(TP+FN)
(12)
Prec = TP/(TP+FP)
(13)
F - Measures = [(1+ 2)*Rec*Prec]/[(
2*Prec)+Prec]
(14)
where corresponds to the relative importance of Precision versus Recall. Typically =1 when false alarms (false positive) and misses (false negative) can be considered equally costly. 3.1 Traditional approaches In general approaches for imbalanced dataset can be divided in two categories: external and internal approaches. The external methods do not depend on the learning algorithm to be used: they mainly consist in a pre-processing phase aiming at balancing classes before training classifiers. Different re-sampling methods fall into this category. In
www.intechopen.com
224
Fuzzy Inference System – Theory and Applications
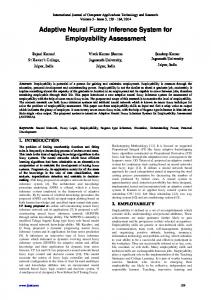
contrast internal method develops variations of the learning algorithm in order to solve the imbalance problem. 3.1.1 External methods Re-sampling strategies have several advantages. First of all re-sampling methods are competitive (McCharty, 2005) and often similar (Maloof, 2003) to the results obtained choosing the cost-sensitive learning. Moreover re-sampling methods are simple and do not require to modify the internal working of the classifier chosen (Elkan, 2001). Re-sampling methods are pre-processing techniques and they can be divided in two categories: oversampling techniques and undersampling techniques. Oversampling methods balance the classes by adding new points to the minority class while undersampling methods increase the number of samples belonging to the minority class. The simplest re-sampling techniques are the random oversampling method and the random undersampling methods. The random oversampling method balances the distribution classes by randomly replicating some instances belonging to the minority class but random oversampling can lead to overfitting. The random undersampling technique randomly removes negative examples from the majority class encountering the problem to deleting some important information of the dataset. Both random techniques sample the dataset until the classes are approximately balanced. In order to solve the cited limitations improved resampling techniques have been proposed. 3.1.1.1 Oversampling techniques Synthetic Minority Oversampling TEcnique (SMOTE) creates minority samples to oversample the minority class avoiding the overfitting problem (Chawla et al., 2002). Instead of replicating existing data points SMOTE generates new samples as follow: for every minority example, its n nearest neighbours belonging to the same class are evaluated (in SMOTE n is set to 5); then new synthetic data points are randomly generated along the segment joining the original data point and its selected neighbour. Figure 1 shows an example concerning SMOTE algorithm: x represents the selected data point, ni are the selected nearest neighbours and s1, s2 and s3 are samples generated by the randomized interpolation.
Fig. 1. Example of SMOTE algorithm.
www.intechopen.com
Fuzzy Inference System for Data Processing in Industrial Applications
225
As SMOTE over-generalizes the minority class but does not take into account the distribution of neighbours from the majority class another novel approach, called Borderline-SMOTE (Han et al., 2005), is proposed. This approach is a generalization of SMOTE approach, it focuses the attention on oversampling around samples located in the borderline between classes. This approach is based on the assumption that the positive instances are divided into three regions: noise, borderline and safe by considering the number of negative examples on k nearest neighbours. If n is the number of negative examples among the k nearest neighbours, the regions are defined as follow: -
Noise: n=k Borderline: 0.5k≤n≤k Safe: 0≤n≤0.5k
Borderline-SMOTE exploits the same oversampling technique as SMOTE but it oversamples only the instances belonging to the borderline region. Bunkhumpornpat et al. proposed another approach called Safe-Level-SMOTE (Bunkhumpornpat et al., 2009). This method assigns for each positive data-points a safe-level (sf) which is defined as the number of positive data-points in the k nearest neighbours. If the safe level of an instance is close to k, then it considered safe. The safe level ratio is defined as the ratio between the safe level of a positive instance and the safe level of a nearest neighbours. Also each synthetic new point is generated in safe region by considering the safe level ratio of instances. This method is able to outperform both SMOTE and BorderlineSMOTE because they may generate instances in unsuitable positions such as overlapping or noise regions. Wang et al. (Wang et al., 2006) propose a novel approach that improves the SMOTE algorithm by including the Locally Linear Embedding (LLE) algorithm (Sam & Lawrence, 2000). The SMOTE approach has an important limitation: it assumes that the local space between any positive samples is positive, i.e. belonging to the minority class. This fact could be not true if the training data is not linearly separable. This method maps the training data into a lower dimensional space through the Locally Linear Embedding technique, then SMOTE is applied in order to create the desirable number of synthetic data points and finally the new data points are mapped back to the initial input space. The so-called LLEbased SMOTE algorithm is evaluated on three datasets applying three different classifiers: Naive Bayesian, K-NN classifier and Support Vector Machine (SVM). Experimental results show that the LLE-based SMOTE algorithm outperforms the conventional SMOTE. Liu and Ghosh (Liu & Ghosh, 2007) propose a novel oversampling method, called generative oversampling, which increases information to the training set by creating artificial minority class points on the basis of the probability distribution to model the minority class. Also, generative oversampling can be used if the data distribution can be approximated with an existing model. Firstly a probability distribution is chosen in order to model the minority class, then parameters for the probability distribution are studied on the basis of the training data and finally synthetic data points are created from the learned probability distribution until the necessary number of points belonging to the minority class has been reached. Authors demonstrate that this approach works well for a range of text classification datasets using as classifier a SVM classifier. This method is simple to develop and it is suitable for several data types by selecting appropriate generative models.
www.intechopen.com
226
Fuzzy Inference System – Theory and Applications
3.1.1.2 Undersampling techniques A popular undersampling method is the Condensed Nearest Neighbour (CNN) rule (Hart, 1968). CNN is used in order to find a consistent subset of samples. A subset is defined consistent with S if, using a one nearest neighbour, correctly classifies the instances in S. Fawcett and Provost (Fawcet and provost, 1997) propose an algorithm to extract a subset from S and using the approach as an undersampling method. Firstly one example belonging to the majority class is randomly extracted and put with all examples belonging to the minority class in . Then a 1-NN over the examples in is used in order to classify the examples belonging to S. If an example in S is misclassified, it is moved to . The main aim of this method is to delete the examples belonging to the majority class which are distant from the decision border. Another undersampling approach is the so-called Tomek links (Tomek, 1976). This method can be defined as follow: let us suppose that xi and xj are two examples belonging to different classes and d(xi, xj) is their distance. A pair (xi, xj) is called a Tomek link if there is not an example xk such that d(xi, xl)< d(xi, xj) or d(xj, xl)< d(xi, xj). If two examples are a Tomek link then either one of these is noise or both are borderline. If Tomek Link is used as underline sampling, only samples belonging to the majority class are removed. Kubat and Matwin (Kubat & Matwin, 1997) propose a method, called One-Side Selection (OSS) which uses both Tomek Link and CNN. Tomek Link is used as undersampling technique removing noisy and borderline samples belonging to the majority class. Borderline samples are considered as unsafe since noise can make them fall on the wrong side of the decision border. CNN is used to delete samples belonging to the majority class which are distant from the decision border. The remainder samples including safe samples of majority class and all samples belonging to the minority class, are used for learning. 3.1.2 Internal methods Internal methods deal with variations of a learning algorithm in order to make it less sensitive for the class imbalance. Two common methods Boosting and Cost-Sensitive learning are used in this area. Boosting is a method used to improve the accuracy of weak classifiers. The most famous boosting algorithm is the so-called AdaBoost (Freund & Schapire, 1997). It is based on the fusion of a set of weak learners, i.e. classifiers which have better performance than random classifiers in a classification task. During the learning phase weak learners are trained and included in the strong learner. The contribution of the added learners is weighted on the basis of their performance. At the end all modified learners contribute to classify unlabelled samples. This approach is suitable to deal with imbalanced dataset because the samples, belonging to the minority class, are most likely to be misclassified and also have higher weights during iterations. In literature several approaches using boosting techniques for imbalanced dataset has been proposed (Guo & Viktor, 2004; Leskovec & Shawe-Taylor, 2003) and results confirm the effectiveness of the method. Another effective approach is the cost-sensitive learning. In this approach cost is associated with misclassifying samples; the cost matrix is a numerical representation of the penalty of classifying samples from a class to another. A correct classification has not penalty and the
www.intechopen.com
Fuzzy Inference System for Data Processing in Industrial Applications
227
cost of misclassifying minority examples is higher than the cost of misclassifying the majority examples. The aim of this approach is to minimize the overall cost on the training dataset. The cost matrix can balance the dataset by assigning the cost misclassifying a class with inverse proportion to its frequency. Another way is to set the cost matrix by considering the application driven criteria taking into account user requirements. Cost matrix is a general notion which can be exploited within common classifiers such as decision tree (Pazzali et al., 2004; Chawla, 2003) or neural networks (De Rouin et al., 1991). Soler and Prim (Soler & Prim, 2007) propose a method based on the Rectangular Basis Function network (RecBF) in order to solve the imbalance problem. RecBF networks have been introduced by Berthold and Huber (Berthold & Huber, 1995) and are a particular type of Radial Basis Function (RBF) networks which exploit neurons with hyper-rectangular activation function in the hidden layer. 3.2 Fuzzy based approaches In classification task with imbalanced dataset SVMs are widely used (Baser et al., 1992). In (Akbani et al., 2004; Japkowicz & Shayu, 2002) the capabilities of SVM and their effect on imbalance have been widely discussed. SVM is a widely used machine learning method which has been applied to many real world problems providing satisfactory results. SVM works effectively with balanced dataset but provides suboptimal classification models considering the imbalanced dataset; several examples demonstrate this conclusion (Veropoulus et al., 1999; Akbani et al., 2004; Wu & Chang, 2003; Wu & Chang, 2005; Raskutti & Kowalczyk, 2004; Imam et al., 2006; Zou et al., 2008; Lin et al., 2009; Kang & Cho, 2006; Liu et al., 2006; Haibo & Garcia, 2009). SVM is biased toward the majority class and provides poor results concerning the minority class. A limit of the SVM approach is that it is sensitive to outliers and noise by considering all the training samples uniformly. In order to overcome this problem a Fuzzy SVM (FSVM) has been proposed (Lin & Wang, 2002) which is a variant of the traditional SVM algorithm. FSVM associates different fuzzy membership values (called weights) for different training samples in order to assign their importance degree of its class. Subsequently the proposed approach includes these weights inner the SVM learning algorithm in order to reduce the effect of outliers or noise when finding the separating hyperplane. An extension of this approach is due to Wang et al. (Wang et al.,2005). They introduced two membership values for each training sample defining the membership degree of positive and negative classes. This approach has been proposed again by Hao et al. (Hao et al., 2007) based on the notion of vague set. Spyrou et al. (Spyrou et al., 2005) propose another kind of fuzzy SVM approach which uses a particular kernel function built from fuzzy basis functions. There are also other works which combine fuzzy theory with SVM assigning a membership value to the outputs of the algorithm. For example Xie et al. (Xie et al., 2005) define a membership degree for the output class through the decision value generated by SVM algorithm, while Inoue and Abe (Inoue & Abe, 2001) use the fuzzy output decision for multiclass classification. Finally Mill and Inoue (Mill & Inoue, 2003) propose an approach which generates the fuzzy membership values for the output classes through the strengths support vectors.
www.intechopen.com
228
Fuzzy Inference System – Theory and Applications
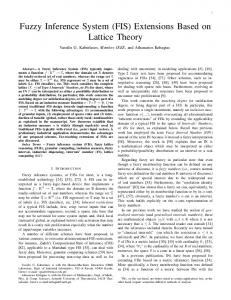
Another typology of FSVM regards the extraction of fuzzy rules from the trained SVM model and a lot of works were been proposed (Chiang & Hao, 2004; Chen & Wang, 2003; Chaves et al., 2005; Castro et al., 2007). The above approaches demonstrate that FSVM outperforms the traditional SVM algorithm avoiding the frequent problem of outliers and noise. However the FSVM technique, such as the SVM method, can be sensitive to the class imbalance problem. Batuwita and Palade (Batuwita & Palade, 2010) propose a novel method which uses the FSVM for class imbalance leraning (CIL). This approach, that is called FSVM-CIL, is able to classify with a satisfactory accuracy solving both the problems of class imbalance and outlier/noise. FSVM-CIL is been improved by Lakshmanan et al. (Lashmanan et al., 2011) extending the approach to multi-class classification problem instead of binary classification. The general implementation scheme of the proposed approach is represented in figure 2.
Fig. 2. Implementation diagram FSVM-CIL method assigns a membership value for training examples in order to suppress the effect of class imbalance and to reflect the within-class importance of different training samples suppressing the effect of outliers and noise. Let us suppose that ki+ and ki- are the membership values of the positive class sample xi+ and negative class sample xi- in their own class respectively. They are calculated as follows:
www.intechopen.com
229
Fuzzy Inference System for Data Processing in Industrial Applications
ki+ =f(xi+ )*k+
ki- =f(xi- )*k
(15)
where k+ and k- are values which reflect the class imbalance such that k+ > k- and f(xi ) is defined considering the distance between xi and its class centre di. Samples near to the class centre are considered important samples because containing more information and also their f(xi) value is high. In contrast, samples which lie far away from centres are treated as outliers or noise and their f(xi) value is low. In FSVM-CIL approach authors use two separate decaying functions of distance to define f(xi): a linearly decaying function flin(xi) and fexp(xi). The two functions are defined as follows: (16)
flin(xi) = 1-[di/(max{di}+ )]
where is a small positive value which is introduced in order to avoid that flin(xi) could assume null value. (17)
fexp(xi) = 2/(1+exp{ di})
where , which can assume values inner the range [0;1], determines the steepness decay and di is the Euclidean distance between xi and its own centre. The performance measure used in this approach is the geometric mean of sensitivity GM and it is represented in equation (18). √SE ∗ SP
(18)
where SE and SP are the proportions of positive and negative samples among the correctly classified ones, respectively. Three datasets (Blanke & Merz, 1988) have been exploited in order to demonstrate the effectiveness of the FSVM-CIL approach. Then a comparison between this method and SVM and FSVM has been evaluated considering both linear and exponential decaying function. Table 4 shows a description of the used datasets while Tab.5 illustrates the obtained results for the several approaches tested.
Ecoli Pima Indians Page Blocks
# Positive Samples 77 268 115
# Negative Samples 259 500 5358
IR 0.297 0.536 0.021
Table 4. Datasets descriptions. IR represents the imbalance ratio, i.e. the ratio between the positive and the negative class. As already mentioned, SVM classifier favours the majority class over the minority class obtaining an high value of SP and a low value of SE. This result confirms that SVM classifier is sensitive to the imbalance problem. Concerning FSVM results show that the best FSVM setting depends on the considered dataset. For Ecoli and Pima databases the choice of the type of decaying function is irrelevant while treating with page-blocks dataset the exponential decaying function provides better results than the linear one. Finally table shows that concerning FSVM-CIL approach, the use of exponential decaying function provides the best results independently from the considered dataset.
www.intechopen.com
230
Fuzzy Inference System – Theory and Applications
ECOLI
PIMA
PAGE
GM SE SP GM SE SP GM SE SP
SVM (%)
FSVM (lin) (%)
FSVM (exp) (%)
88.59 78.67 93.12 70.18 55.04 89.50 76.47 58.26 99.54
88.53 78.18 93.60 69.78 54.55 87.5 79.15 61.74 91.48
85.50 78.64 92.97 71.33 55.60 82.50 81.62 67.06 99.01
FSVMCIL (lin) (%) 89.08 90.02 86.52 71.56 66.94 76.14 94.51 93.81 95.21
FSVMCIL (exp) (%) 90.64 92.45 88.19 72.74 69.10 76.35 95.05 93.14 95.36
Table 5. Classification results and comparison between several methods Jesus et al. (Jesus et al., 2006) propose the study of the performance of Fuzzy Rule Based Classification System (FRBCS) in imbalanced datasets (Chi et al., 1996). The authors analyze the synergy of the linguistic FRBCS with some pre-processing techniques using several approaches such as undersampling, oversampling or hybrid models. A FRBCS is composed by a Knowledge Base (KB) and a Fuzzy Reasing Method (FRM). FRM uses the information of KB in order to determine the class for each sample which goes to the system. KB is composed of two elements: the Data Base (DB) which includes the notion of the fuzzy sets associated to the linguistic terms and the Rule Base (RB) which contains a set of classification rules. The FRM, which is an inference procedure, utilizes the information of KB to predict a class from an unclassified sample. In a classification task the model of FRM includes four operations: 1. 2.
3. 4.
Compute the compatibility degree of data with the precedent of the rules. Compute the association degree of data to the consequent class of each rule. This step consists in the generation of an aggregation function between the compatibility degree and the certainty degree of the rule with the class related. Set the association degree of data with the several classes. Classify by applying a decision function F on the association degree of data with classes.
FRBCS has been proposed in (Chi et al., 1996) and is an extension of the well known Wang & Mendel method (Wang & Mendel, 1992) to classification task. FRBCS finds the relationship between variables of the problem and establishes an association between the space of the features and the space of the classes. The main operations are as follows:
Firstly a domain of variation of each feature Xi is determined, then fuzzy partitions are computed. This step is important in order to establish the linguistic partitions. For each example, a fuzzy rule is generated. Rules are created by considering several main steps. Computing the matching degree of each example to the several fuzzy regions. Assigning the selected example to the fuzzy region with the higher membership degree.
www.intechopen.com
Fuzzy Inference System for Data Processing in Industrial Applications
231
Creating a rule for each example in this manner: the antecedent is determined by the selected Fuzzy region with the label of class of the sample in the subsequent. Compute the certainty degree.
In order to demonstrate the effectiveness of the proposed approach, authors considered several datasets belonging to the UCI repository with different degrees of imbalance. The proposed method has been divided into three parts: an analysis of the use of preprocessing for imbalanced problems (such as SMOTE, random oversampling, random under-sampling ...), a study of the effect of the FRM and an analysis of the influence of the granularity applied to the linguistic partitions in combination with the inference method. Results show that in all considered cases the presence of the pre-processing phase improves the behaviour of the learning algorithm. The main conclusion of the proposed method is that the FRCM algorithm outperforms the other analyzed methods obtaining the best results adding a re-sampling operation before use the FRCM technique; moreover authors have found that FRBCSs perform well again the C4.5 decision tree in the context of very high imbalanced datasets. An alternative to imbalance problem is the use of Complementary Learning Fuzzy Neural Network (CLFNN) which is proposed in (Tan et al., 2007). The use of fuzzy logic allows to tolerate uncertainty in the data reducing the effect of data imbalance. CLFNN has the main advantage that does not requires data pre-processing and hence, does not make any a prior assumption on data and does not alter the data distribution. This method exploits a neurofuzzy system which is based on complementary learning theory (Tan et al., 2005). Complementary learning is a system observed in human brain; with this theory different brain areas, which are segregated and mutually exclusive, are registered in order to recognize different objects (Gauthier, 2000). When an object is seen, registered areas are activated while the irrelevant areas are inhibited; this mechanism is called lateral inhibition. Generally complementary learning has the following characteristics:
Features extraction of positive and negative examples. Separation of positive and negative information. Development of lateral inhibition.
According to this concepts, the different approaches that are present in the literature can be divided into three groups: 1. 2. 3.
Positive/negative systems, where the system builds information on the basis only of the target class. Neutral learning systems, where the notion of positive and negative does not exist. Complementary learning systems, where the system creates knowledge on the basis of positive and negative classes considering the relation between positive and negative samples.
CLFNN is considered a 9-tuple (X, Y, D, A, R, B, l, s, p). The definition of each element is as follows: -
X is the observation, belonging to the input space U, which has a set of variables x=(x1, x2, ..., xI).
www.intechopen.com
232 -
-
-
Fuzzy Inference System – Theory and Applications
Y is the output associated to the input X. If M is the number of possible outputs, YєV (V=V1 x V2 x ... x VM) where V is the output space. Moreover Y is the union of Y+ and Ywhich represent respectively the positive and negative output. D is a set of observation X and its relative output Y and represents the source knowledge data. A is a set of knowledge which explains the behaviour amongst samples X in D. R represents the rules, i.e. the information learnt from D connecting the inputs to the relative outputs. B is a set of knowledge which explains the behaviour amongst samples Y in D. l represents the learning function building the CLFNN based on D. This function includes two complementary learning function: s and p. s is the structure learning which builds the net. For instance a clustering algorithm can independently obtain the structures from data. Moreover it creates the fuzzy sets and memory elements that describe the underlying data. If the existing knowledge is not sufficient for data description, other nodes are added. The process ends when the structure of data is suitable to reflect the data D. p is the parameter learning which can be any supervised learning algorithm.
In CLFNN the behaviour is characterized by a linguistic term derived by fuzzy set A. A is a mapping of X to the linguistic model of CLFNN; each set A identifies a set of locations in the input space characterizing by their membership functions. CLFNN is less subjected to data imbalance problem because it builds its knowledge from positive and negative classes separately and the influence of each class on the other one is minimized. Moreover in CLFNN the inference system uses the lateral inhibition which improves the system performance treating with imbalanced dataset. In order to demonstrate the efficiency of CLFNN method, four imbalanced datasets are used: Single Photon Emission Computed Tomography (SPECT) (Blake & Merz, 1998), Wisconsin Breast Cancer diagnosis (WBCD) (Blake & Merz, 1998), Fine Needle Aspiration (FNA) (Cross & Harrison, 2006) and Thermogram (THERM).(Ng &Fok, 2003). The dataset is divided in training set, testing set and validation set maintaining the class distribution. The averaged performance of CLFNN, which is calculated by the F-Measure over three cross-validation sets, is compared with other popular methods: Multilayer Perceptron (MLP)(Rosenblattx, 1958)., Radial Basis Function (RBF) (Powell, 1985), Linear Discriminant Analysis (LDA) (McLachlan, 2004), Decision tree C4.5 (Brodley & Utgoff,P.E.) and Support Vector Machine (SVM). Table 6 illustrates the description of datasets and the averaged results obtained over the different cross validations with the several approaches. The acronym IR indicates the imbalanced ratio, i.e. the ratio between the number of positive samples and the number of negative samples. Table 6 shows that CLFNN provides better results than the other approaches. In thermogram dataset none of the system can give satisfactory results because of its very high imbalance ratio but, also in this case, CLFNN outperforms the other approaches. This work confirms that CLFNN provides more consistent results over different data distributions coming a promising tool for handling imbalanced dataset.
www.intechopen.com
233
Fuzzy Inference System for Data Processing in Industrial Applications
SPECT
WBCD
FNA
THERM
# Positive Samples
212
212
235
5
# Negative Samples
55
357
457
65
IR
3.85
0.59
0.51
0.07
MLP
0.762
0.925
0.917
0.2
RBF
0.8
0.912
0.912
0.2
C4.5
0.763
0.907
0.906
0.2
SVM
0.79
0.93
0.93
0.2
LDA
0.90
0.931
0.918
0.2
CLFNN
0.91
0.96
0.96
0.37
Table 6. Datasets description and averaged results.
4. Conclusions Fuzzy Systems offer several advantages, among which the possibility to formalise and simulate the expertise of an operator in process control and tuning. Moreover the fuzzy approach provides a simple answer for processes which are not easily modelled. Finally they are flexible and nowadays they can be easily implemented and exploited also for realtime applications. This is the main reason why, in many industrial applications, dealing with processes that are difficult to model, fuzzy theory is widely adopted obtaining satisfactory results. In particular, in this chapter, applications of FIS to industrial data processing have been presented and discussed, with a particular emphasis on the detection of rare patterns or events. Rare patterns are typically much difficult to identify with respect to common objects and often data mining algorithms have difficulty dealing with them. There are two kind of “rarity”: rare case and rare classes. Rare cases, commonly known as outliers, refer to anomalous samples, i.e. observations that deviate significantly from the rest of data. Outliers may be due to sensor noise, process disturbances, human errors and instruments degradation. On the other hand, rare classes or more generally class imbalance, occur when, in a classification problem, there are more samples of some classes than others. This chapter provides a preliminary review of classical outlier detection methods and then illustrates novel interesting detection methods based on Fuzzy Inference System. Moreover the class imbalance problem is described and traditional techniques are treated. Finally some actual Fuzzy based approaches are considered. Results demonstrate how, in real world applications, fuzzy theory can effectively provide an optimal tool outperforming other traditional techniques.
www.intechopen.com
234
Fuzzy Inference System – Theory and Applications
5. References Akbani, R., Kwek, S.& Japkowicz, N. (2004). Applying support vector machines to imbalanced datasets. In Proceedings of 15th European Conference on Machine Learning, Pisa, Italy, September 20-24, 2004. Alejo, R., Garcia, V., Sotoca, J.M., Mollineda, R.A. & Sanchez, J.S. (2006). Improving the classification accuracy of RBF and MLP neural networks trained with imbalanced samples. In E. Corchado et al. (Eds) IDEAL 2006, pp.464-461. Batuwita R. & Palade, V. (2010). FSVM-CIL: Fuzzy Suport Vector Machines for class Imbalance Learning. IEEE Transactions on fuzzy system, Vol. 3, N° 18, June 2010. Berthold, M.R. & Huber, K.P. (1995). From radial to rectangular basis functions: a new approach for rule learning from large datasets. Technical report, University of Karlsruhe, 1995. Bezdek, J.C. (1981). Pattern Recognition with Fuzzy Objective Function Algorithms, Plenum Press, New York. Blake, C.L. (1998). UCI Repository of machine learning databases. Irvine C.A., university of California, Department of Information and Computer science. Boser, B. E., Guyon, I. M. & Vapnik, V. N. (1992). A training algorithm for optimal margin classifiers. In D. Haussler, editor, 5th Annual ACM Workshop on COLT, pages 144-152, Pittsburgh, PA, 1992. ACM Press Breunig, N.M; kriegel, H.P. & Ng, R.T. (2000). LOF: Identifying density-based local outliers. Proceedings of ACM Conference, pp.93-104. Brodley, C.E & Utgoff, P.E. (1995). Multivariate decision trees. Machine Learning, 19. pp. 4577. Bunkhumpornpat, C. Sinapiromsaran, K. & Lursinsap, C. (2009). Safe-Level-SMOTE: Safe Level Synthetic Oversampling technique fopr handling the class imbalanced problem. In Proceedings PAKDD 2009,Springer LNAI 5476, pp. 475-482. Castillo, M.D. & Serrano, J.I. (2004) A multistrategy approach for digital text categorization from imbalanced documents. SIGKDD Explor. Newsl., Vol. 6, N° 1, pp. 70-79. Castro, J.; Hidalgo, L.; Mantas, C. & Puche, J. (2007). Extraction of fuzzy rules from Support vector machine. Fuzzy Sets System, Vol. 158, pp.2957-2077. Cateni, S.; Colla, V. & Vannucci, M. (2009). A fuzzy system for combining different outliers detection methods, Proceedings of the 25th conference on proceedings of the International conference: Artificial Intelligence and Applications, , Innsbruck, Austria, 16-18 Febbraio 2009. Chan, P.K. & Stolfo, S.J. (1998). Toward scalable learning with non-uniform class and cost distribution: a case study in credit fraud detection. Kwowledge Discovery and data Mining, pp.164-168. Chaves, A.; Vellasco, M. & Tansheit, R. (2005). Fuzzy rule extraction from support vector machines, 5th inter. Conf. Hybrid Intell. System, Rio de Janeiro, Brazil. Chawla, N.V.; Hall, L.O., Bowyer, W. & Kegelmeyer, W.P. (2002) SMOTE: Synthetic Minoruty Oversampling TEcnique. Journal of Artificial Intelligence Research. 16, pp.321-327.
www.intechopen.com
Fuzzy Inference System for Data Processing in Industrial Applications
235
Chawla, N.V. (2003). C4.5 and imbalanced data sets: investigating the effect of sampling method, probabilistic estimate, and decision tree structure. Workshop on learning from imbalanced dataset II, ICML, Washington DC, 2003. Chi, Z, Yan, H. & Pham,T. (1996). Fuzzy algorithms with applications to image processing and pattern recognition. World Scientific. Chiang, J. & Hao, P. (2004). support Vector learning mechanism for fuzzy rule-based modeling: a new approach.IEEE Trans. Fuzzy System, vol 12, no 6, pp.1-12. Chen, Y. & Wang, J. (2003). Support vector learning for fuzzy rule based classification systems, IEEE Trans Fuzzy System, Vol,11, no 6, pp.716-728. Cross, S. & Harrison, R. F.(2006). Fine needle aspirated of breast lesions dataset. Artificial Neural Networks in Medicine World map. De Rouin, E., Brown, J., Fausett, L. & Schneider, M., (1991). Neural network training on unequally represented classes. In Intelligent engineering systems through artificial neural networks, pp. 135-141, ASME press, NY. Dixon, W.J. (1953). processing data for Outliers. Biometrics 9, pp.74-89, 1953. Dunn, J.C. (1973). A fuzzy relative of the ISODATA Process and its use in detecting compact well-separated clusters, Journal of Cybernetics,3, pp. 32-57, 1973. Dunn, J.C. (1974). Some recent investigations of a new fuzzy partition algorithm and its application to pattern classification problems, journal of Cibernetics 4, pp.1-15, 1974. Fawcett, T.& Provost, F.J. (1997). Adaptive fraud detection. Data Mining Knowledge Discovery, Vol. 1, N°3, pp.291-316. Gao, J., Cheng, H. & Tan, P.N. (2006). Semi-supervised outlier detection. Proceedings of the 2006 ACM Symposium on apllied Computing, ACM Press, 2006, pp. 635-636. Gauthier, I., Skuldlasky, P., Gore, J.C. & Andreson, A.W. (2000). Experise for cars and birds recruits brain areas involved in face recognition. Nature Neuroscience, Vol 3., (2), pp.191-197. Gibbons, R.D. (1994). Statistical Methods for Groundwater Monitoring, John Wiley & Sons, New York. Grubbs, F.E. (1969). Procedures for detecting outliyng observations in samples, Technometric 11, pp.1-21. Guo, H. & Viktor, H. (2004) Learning from imbalanced data sets with boosting and data generation: the DataBoost-IM approach. ACM SIGKDD Explorations Newsletter Special issue on learning from imbalanced datasets Volume 6 , Issue 1 (June 2004). Haibo, H & Garcia, E. (2009). Learning from Imbalanced Data. IEEE Trans. Knowl. Data Eng. Vol 21, no 9, pp.1263-1284. Han, H. Wang, W & Mao,B. (2005). Borderline-SMOTE: A New Oversampling Method in Imbalanced Data sets Learning. Proceeding of ICIC Springer LNCS 3644, pp.878-887. Hao, Y., Chi, X. & Yan, D. (2007) Fuzzy Support Vector Machinre based on vague sets for credit assessment. Proc. 4th Int. Conf. Fuzzy System Knowl. Discov. Changsha, China, vol.1 , pp. 603-607. Hart, P. (1968). The condensed nearest neighbor rule. IEEE Trans. Inform. Theory, 14. pp.515516. Hawkin, D. (1980). Identification of outliers, Chapman and Hall, London 1980.
www.intechopen.com
236
Fuzzy Inference System – Theory and Applications
He,Z., Xu,X. & Deng, S. (2003) Discovering cluster-based local outliers, Pattern recognition Letters, pp.1651-1660. Hodge, V.J. (2004). A survey of outlier detection methodologies, Kluver Academic Publishers, Netherlands, January, 2004. Hong, X.; Chen, S. & Harris, C.J. (2007). A kernel based two class classifier for imbalanced datasets. IEEE Transactions on Neural Networks, vol 18 (1), pp.28-41. Hu, Q. & Yu, D. (2005) An improved clustering algorithm for information granulation, Proceedings of 2nd International Conference on Fuzzy Systems and Knowledge Discovery (FSKD'05), vol 3613, LNCS, Springer-Verlag, Berlin Heidelberg Changsha, China, 2005, pp.494-504. Imam, T., Ting, K. & Kamruzzaman, J. (2006). z-SVM: An SVM for improved classification of imbalanced data. In Proceeding of Aust. Joint Conf. AI, Hobart, Australia, pp. 264-273. Inoue, T. & Abe, S. (2001). Support Vector machine for pattern classification. Proc. Int. Conf. Neural Network, Washington , D.C. pp.1449-1457. Jang, M.F., Tseng, S.S, & Su, C.M. (2001). Two-phase clustering process for outliers detection. Pattern Recognition Letters, pp.691-700. Jang, S., Li, Q., Wang, H. & Zhao, Y. (2005). A two-stage outlier detection method. MINIMICRO SYSTEMS, pp.1237-1240. Japkowicz, N. & Shaju, S. (2002). The class imbalance problem: a systematic study. Intelligent Data Analysis, Volume 6, Issue 5 (October 2002), Pages: 429 – 449. Jesus, M.J., Fernandèz, A., Garcia, S. & Herrera, F. (2006) A first study of the use of fuzzy rule based classification systems for Problems with Imbalanced Data Sets. Symposium on Fuzzy Systems in Computer Science (FSCS06). Magdeburg, Germany, pp. 63-72 (2006). Jimenez-Marquez, S.A., Lacroix, L. & Thibault, J. (2002) Statistical data validation methods for large cheese plant database. J.Dairy Sci., 85(9), Sep 2002, pp. 2081-2097. Kang, P. & Cho, S. (2006). EUS SVMs: Ensemble of under sampled SVMs for data imbalance problems. Proc. of 13th International Conference Neural Inf. Process., Hong Kong, pp. 837-846. Knorr, E.M., Ng, R. (2003). algorithms for Mining Distance-based Outliers in Large datasets, Proceedings of VLDB, pp.392-403, 2003. Kubat, M. & Matwin, S. (1997). Addressing the curse of imbalanced training sets: one sided selection. Proceedings of the Fourteenth International Conference on Machine Learning. pp.179-186. Nashville Tennesse, Morgan, Kaufmann. Kubat, M., Holte, R.C. and Matwin, S. (1998). Machine learning for the detection of oil spill in satelite radar images, Machine Learning, Vol. 30, N°2-3, pp.195-215. Leskovec, J. & Shawe-Taylor, J. (2003). Linear programming boosting for uneven datasets. In Proc. Of the 20th International conference on Machine learning (ICML-2003), Washington DC, 2003. Li, P., Chan, K.L. & Fang, W. (2006) Hybrid kernel machine ensemble for imbalanced data sets. In Proc. Of the 18th Int. Conference on pattern recognition, (ICPR'06), 2006.
www.intechopen.com
Fuzzy Inference System for Data Processing in Industrial Applications
237
Li, B.; Fang, L. & Guo, L. (2007) A novel data mining method for network anomaly detection based on transductive Scheme, Advances in Neural Networks, LNCS, VOL.4491, Springer Berlin, 2007, pp. 1286-1292. Lin, C.F. & Wang, D. (2002) Fuzzy support Vector machine, IEEE Trans. Neural Network, vol 13, n 2, pp.464-471. Lin, Z., Hao, Z. & Yang, X. Lium, X. (2009). Several SVM ensemble methods integrated with under-sampling for imbalanced data learning. In Advanced Data Mining and Application,Berlin, Germany Springer Verlag, pp.536-544. Ling, C.X. & Li, C. (1998). Data Mining for direct marketing: problems and solutions. Knowledge Discovery and data Mining, pp.73-79. Lingras, P. & West, C. (2004). Interval set clustering of web users with rough k-means, Journal of Intelligent Information System, Vol. 23, N°1, July 2004, pp. 5-16. Liu, Y., An, A. & Huang, X. (2006). Boosting prediction accuracy of imbalanced dataset with SVM ensembles. Proc. 10th Pac.-Asia Conf. Adv. Knowl. Discov. Data Mining, Singapore pp.107-118. Liu, A. & Ghosh, J. (2007). Generative Oversampling for Mining Imbalanced Datasets. In DMIN pp. 66-72. Mahalanobis, P.C. (1936). On the generalized distance in statistics. Proceedings of the National Institute of science of india, pp.49-55. Maloof, M. (2003). Learning when data sets are imbalanced and when costs are unequal and unknown. ICML, 2003. Mandani, E.H. (1974). Application of fuzzy algorithms for control of simple dynamic plant. Proceedings of the IEEE Control and Science, 121, pp. 298-313, 1974. Matsumoto, S., Kamei, Y., Monden, A. & Matsumoto, K. (2007). Comparison of outlier Detection methods in Fault-proneness Models. Proceedings of the 1st International symposium on Emperical Software Engineering and measurements (ESEM2007), pp. 461463. McCarthy, K., Zabar, B. & Weiss, G. (2005). Does cost sensitive learning beat sampling for classifying rare classes?. UBDM'05 New York, NY, USA, ACM Press, pp.6977. McLachlan (2004). Discriminant Analysis and Statistical pattern recognition.Wiley interscience. Mill, J. & Inoue, A. (2003). An application of fuzzy support vector. Proc. 22nd Int. Conf. Neural Amer. fuzzy Inf. Process Soc. Chicago, IL pp.302-306. Ng, E.Y.K & Fok, S.C. (2003). A framework foe early discovery of breast tumor using thermography with artificial neural network. The Breast Journal, Vol. 9, 4, 2003, pp.341-343. Papadimitriou, S. Kitawaga, H. Gibbons, P. & Faloutsos, C. (2003). LOCI: Fast Outlier Detection using the Local Correlation Integral. Proceedings of the International Conference of Data Engineering, 2003. Pawlak, Z. (1982). Rough Sets. International journal of computer and Information Sciences, 11, 341-356. Pawlak, Z. (1991). Rough Sets: Theoretical aspects of reasoning about data. Dordrecht: Kluver Academic Publisher.
www.intechopen.com
238
Fuzzy Inference System – Theory and Applications
Pazzani, M., Marz, C., Murphy, P., Ali, K., Hume, T. & Brunk, C. (1994). Reducing misclassification cost. In Proceedings of the 11th Intl. Conference on machine learning, pp. 217- 225, 1994. Phua, C, Alahakoon, D. & Lee, V. (2004). Minority report in fraud detection: Classification of skewed data, SIGKDD explor. Newsl., Vol. 6, N°1, pp.50-59, 2004. Powell, M.J.D. (1985). Radial Basic Functions for multivariable interpolation: a review. IMA Conference on Algorithms for the Approximation of Functions on Data. pp.143-167, RMCS Shrivenham, England. Ramasmawy,S., Rastogi, R. & Shim, K. (2000). Efficient Algorithms for Mining Outliers from large datasets, Proceedings of International conference of management of data (SIGMOD' 00), 2000, pp. 427-438. Raskutti, B. & Kowalczyk, A. (2004). Extreme re-balancing for svms: a case study. SIGKDD Exploration, Vol 6, N°1, pp. 60-69. Ray, S & Turi, H. (1999). Determination of number of clusters in k-means clustering and application in colour image segmentation. Proceedings of 4th International conference in pattern recognition and Digital Techniques, (ICAPRDT'99), Calcutta, india, 27-29 December 1999, pp. 137-143. Rosenblatt, F. (1958). The Perceptron: a probabilistic model for information storage and organization in The brain. Psycological review, 65. pp.386-408. Ruspini, E. (1969). A new approach to clustering. Information and Control, N°15, pp.22-32, 1969. Sam, T.R. & Lawrence, K.S. (2000). Nonlinear Dimensionality Reduction by Locally Linear embedding. Science , 290, pp. 2323-2326. Soler, V. & Prim, M. (2007). Rectangular basis functions applied to imbalanced datasets. Lecture notes in computer science, Vol. 4668/2007, Springer. Spyrou, E., Stamou, G. Avrithis, Y. & Kollias, S. (2005). Fuzzy Support Vector Machine for image classification fusing mpeg7 visual descriptors. Proc. 2nd Eur. Workshop Integr. Knowl. Semantics Dig. Media Technol. London UK, pp.25-30. Tan, T.Z., Ng, S.G. & Quek, C. (2005). Ovarian cancer diagnosis by hippocampus and neocortex-inspired learning memory structures. Neural Networks.Vol 18, 5-6, pp.818-825. Tan, T.Z.; Ng, S.G. & Quek, C. (2007). Complementary Learning Fuzzy Neural Network: An approach to Imbalanced Dataset. Proceedings of International Joint Conference on Neural Networks, Orlando, Florida, USA, August 12-17. Tomek, I. (1976). Two modifications of CNN. IEEE Transactions System Man Comm. 6, pp.769772. Turney, P.D. (2000). Learning algorithms for keyphrase extraction. Information Retrieval, vol.2 , n°4, pp. 303-336. Vannucci, M., Colla, V., Cateni, S. & Sgarbi, M. (2011). Artificial intelligence techniques for unbalanced datasets in real world classification tasks. Computational Modeling and Simulation of Intellect current state and future perspectives, pp. 551565.
www.intechopen.com
Fuzzy Inference System for Data Processing in Industrial Applications
239
Veropoulus, K. Campbell, C. & Cristianini, N. (1999). Controlling the sensitivity of support vector machines, in Proc. Int. Joint Conf. Artificial Intelligence, Stockholm, Sweden, pp. 55-60. Visa, S. & Ralescu, A. (2005). Issues in mining imbalanced datasets - a review paper. Proocedings of the Sixteen Midwest Artificial Intelligence and Cognitive Science Conference, pp. 67-73. Xie, Z., Hu, Q. & Yu, D. (2005). Fuzzy Support Vector Machine for classification. Proc. Int. Conf. Adv. Natural. comput. Changsha, China p.1190-1197. Xu, Z. & Liu, S. (2009). Rough based Semi- Supervised Outlier Detection. Sixth International conference on Fuzzy System and Knowledge Discovery, pp. 520-524. Wang, L.X. & Mendel, J.M. (1992). Generating fuzzy rules for learning from examples. IEEE Transactions on Systems, Man and Cybernetics, Vol 35, No 2, pp.353-361. Wang, J. Xu, M., Wang, H. & Zhang, J. (2006). Classification of Imbalanced Data by using the SMOTE algorithm and Locally Linear Embedding. Proceeding of 8th International conference on Signal Processing, IEEE, Classification of Imbalanced Data by using the SMOTE algorithm and Locally Linear Embedding. Vol. 3, pp. 16-20, 2006. Wang, Y., Wang, S. & Lai, K. (2005). A new fuzzy support vector machine to evaluate credit risk. IEEE Trans. Fuzzy Syst. Vol 13, no 6, pp.820-831. Weiss, G.M. & Provost, F. (2003). Learning when training data are costly: the effect of class distribution on tree induction. Journal of Artificial Intelligence Research, 19, pp. 315354. Wu, G. & Chang, E. (2003). Class boundary alignment for imbalanced dataset learning. Proceeding of Internaltional Conference Data Mining, Workshop Learning Imbalanced Datasets II, Washington ,D.C. Wu, G. & Chang, E. (2004). KBA: Kernel Boundary Alignment considering imbalanced data distribution.. Proceeding of IEEE Trans. Knowl. Data Eng. Vol 17, N°6, pp. 786-795. Xie, J. & Qiu, Z. (2007). The effect of imbalanced datasets on LDA: a theoretical and empirical analysis. Pattern Recognition, vol. 40, pp.557-562. Xue, Z.; Shang, Y; Feg S. (2010) Semi-supervised outlier detection based on fuzzy rough C-means clustering, Mathematics and Computers in simulation, 80, pp.2011-2021, 2010. Yousri, N.A., Ismal, M.A. & Kamel, M.S. (2007). Fuzzy outlier analysis a combined clustering-outlier detection approach, IEEE SMC 2007. Yu, D., Sheikholeshami, G & Zhang, A. (2003). Findout: finding out outliers in large datasets. Knowledge and information Systems, pp.387-412. Zadrozny, B., Langford, J. & Abe, N. (2003). Cost sensitive learning by cost proportionate example weigthing. In ICDM'O3 Proceedings of the Third IEEE International Conference on Data Mining, 2003. Zhang, D., Gatica-Perezs, D., Bengio, S. & McCowan, I. Semi supervised adapted HMMs for unusual event detection, IEEE Computer society Conference on Computer Vision and Pattern Recognition (CVPR'05) IEEE Press, June, 2005. Vol 1 pp.611-618.
www.intechopen.com
240
Fuzzy Inference System – Theory and Applications
Zou, S. Huang, Y., wang,Y. Wang, J. & Zou, C. (2008). SVM learning from imbalanced data by GA sampling for protein domain prediction. Proc. of 9th Int. Congf. Joung Comput., Sci Hunan, China, 2008, pp.982-987.
www.intechopen.com
Fuzzy Inference System - Theory and Applications Edited by Dr. Mohammad Fazle Azeem
ISBN 978-953-51-0525-1 Hard cover, 504 pages Publisher InTech
Published online 09, May, 2012
Published in print edition May, 2012 This book is an attempt to accumulate the researches on diverse inter disciplinary field of engineering and management using Fuzzy Inference System (FIS). The book is organized in seven sections with twenty two chapters, covering a wide range of applications. Section I, caters theoretical aspects of FIS in chapter one. Section II, dealing with FIS applications to management related problems and consisting three chapters. Section III, accumulates six chapters to commemorate FIS application to mechanical and industrial engineering problems. Section IV, elaborates FIS application to image processing and cognition problems encompassing four chapters. Section V, describes FIS application to various power system engineering problem in three chapters. Section VI highlights the FIS application to system modeling and control problems and constitutes three chapters. Section VII accommodates two chapters and presents FIS application to civil engineering problem.
How to reference
In order to correctly reference this scholarly work, feel free to copy and paste the following: Silvia Cateni and Valentina Colla (2012). Fuzzy Inference System for Data Processing in Industrial Applications, Fuzzy Inference System - Theory and Applications, Dr. Mohammad Fazle Azeem (Ed.), ISBN: 978-953-51-0525-1, InTech, Available from: http://www.intechopen.com/books/fuzzy-inference-system-theoryand-applications/fuzzy-inference-systems-for-data-processing-in-industrial-applications
InTech Europe
University Campus STeP Ri Slavka Krautzeka 83/A 51000 Rijeka, Croatia Phone: +385 (51) 770 447 Fax: +385 (51) 686 166 www.intechopen.com
InTech China
Unit 405, Office Block, Hotel Equatorial Shanghai No.65, Yan An Road (West), Shanghai, 200040, China Phone: +86-21-62489820 Fax: +86-21-62489821