Fuzzy inference systems for estimation of Air Quality Index Daniel Dunea, Alexandru Alin Pohoata, Emil Lungu Valahia University of Targoviste
[email protected],
[email protected], emil
[email protected] Abstract The paper provides a reliable method in assessing the Air Quality Index (AQI) by employing fuzzy logic. Long-time series of sulfur dioxide (SO2), nitrogen dioxide (NO2) and particulate matter (PM10) obtained through continuous monitoring at Romanian Targoviste DB1 station were inputted in a Mamdani fuzzy inference system (FIS) obtaining the AQI output in a more comprehensive matter. The rules were structured by level of air pollutants concentration. All defined rules were evaluated in parallel in a random order. The triangular and trapezoidal membership functions fitted to the intended purpose of computational efficiency. The AQI synthetic indicator allows the user a quick interpretation of the status of the surrounding air in residential areas. Key words: Fuzzy inference, air pollution, air quality index. 2000 AMS subject classifications: 00A69.
1
Introduction
This work presents the use of fuzzy techniques for Air Quality Index (AQI) assessments. In Romania, AQI is established on a scale from 1 to 6 (1-excellent, 6-very bad) using data acquired by automated stations of the National Network of Air Quality Monitoring [1] . RNMCA comprises more than 140 automated stations for continuous monitoring of air quality managed by 41 local centers, which collect and transmit data from stations and AQI information to the public panel. The information is also transmitted after primary validation for certification at the National Reference Laboratory (LNR) in Bucharest. The selection of AQI is made taking into account the worst value from a set of specific indices. Specific indices are established using 6 intervals of pollutant concentrations such as sulfur dioxide (SO2), nitrogen dioxide (NO2), Ozone (O3), Carbon monoxide (CO) and particulate matter (PM10). At least three specific indices should generally be available to calculate the general AQI. Fuzzy inference methods assume that all the rules are activated 1
at every cycle and contribute collectively to the solution. It is a parallel oneshot inference, but the inference process can continue as the new inferred results can be fed again as inputs [5]. Methods based on the fuzzy sets theory should be applied in the context of environmental numbers. The boundaries between an acceptable and an unacceptable concentration is not to be considered as sharp, but as fuzzy, with implications for subsequent action plans. The use of fuzzy numbers is proposed as a suitable technique for handling environmental criteria and tackling decisions made under uncertainty [8]. Fuzzy logic was successfully applied for various air quality assessments and predictions [2], [3], [4], [6], [7]. The literature shows that fuzzy inference systems are frequently considered for short-term forecasting applied to emissions control or to AQI computations. These methods have some advantages over deterministic approaches [9]. In this paper, large time series of SO2, NO2 and PM10 were used as inputs in a Mamdani fuzzy inference system (FIS) to model the AQI output in a more intuitive matter.
2
Technical description
Specific indices are established using 6 intervals of pollutant concentrations such as: • Sulfur dioxide (SO2), • Nitrogen dioxide (NO2), • Ozone (O3), • Carbon monoxide (CO), • and particulate matter (PM10). The most important air pollutants variables were selected for analysis (SO2, NO2 and PM10) because they are primary pollutants emitted into the atmosphere directly from various sources retaining the same chemical form and significantly affecting the human health and ecosystems components. Figure 1 presents six intervals of concentration corresponding to each index. Fuzzy inference takes inputs, applies fuzzy rules, and produces explicit outputs. The FISs of Mamdani type are suitable for air quality evaluation as both the inputs and the outputs of the FIS are represented by the values of linguistic variables [4]. The primary mechanism relying on If-Then (facts state/action) rules has defined an input space into output space. Fuzzy inference permitted the reading of the input vector values (3 inputs) and based on the set of rules , allocated the values of vector output (a single output, which is the AQI). Numerical input values can be easily translated into descriptive words (e.g. excellent, very good, good, favorable, bad and very bad). 2
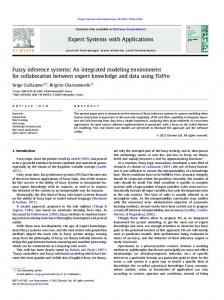
Figure 1: Intervals of concentration for each variable and their corresponding specific index - AQI (1-excellent, 6-very bad) Membership function Mf shows the extent to which a value from a domain is included in a fuzzy concept. There is no general method for designing form, number and parameters of input and output membership functions. The design of input and output membership functions is based on the limits set by the government (see Figure 1) and on the recommendations of environmental experts. The triangular and trapezoidal membership functions fitted to the intended purpose. Consequently, selected membership functions, as specific curves, defined how each entry point in space belonged to a degree of membership in the range 0 and 1. Figure 2 shows five triangular and one-side trapezoidal Mfs for each of the three inputs.
Figure 2: Membership functions of the input variables (nitrogen dioxide NO2; sulfur dioxide SO2; particulate matter PM10) Figure 3 depicts the triangular functions responsible for the AQI modeling by level of pollution. The structure of production rules was developed using Fuzzy Logic Toolbox module of MATLAB. The rules were structured by level of air pollutants concentration (more than 80 rules). Figures 4 and 5 highlight the windows of rule editor and rule viewer in Matlab showing some of the developed rules and the relationship between inputs and AQI output.
3
Figure 3: Output functions of the fuzzy inference system
Figure 4: Rule editor of Matlab showing several rules that control the FIS
2.1
Largest of Maximum (LOM) Defuzzification
There are numerous defuzzification methods. Each defuzzification method outputs different results. There is no exact rule on selection of defuzzification for certain applications. LOM was selected due to the nature of the problem: the air quality is established by the maximum of the pollution indices that makes the usual Center Of Gravity (COG) method unsuitable. In fuzzyfication, an operator transforms crisp data into fuzzy sets, so
Figure 5: Rule viewer with the relationship between inputs and output
4
that data can be processed by the rule-base. The fuzzification process can be described as: A = fuzzifier(x0 ) (1) e where x0 = [x1 , x2 , ..., xn ]T is an input vector and A = [A1 , A2 , ...An ]T e e The e Mame are fuzzy sets, and fuzzyfier represents a fuzzyfication operator. dani implication of max-min fuzzy inference is given by: µB k (z) = max[min[µAk (input(x1 )), µAk (input(x2 ))]], k = 1, ..., r (2) 1 2 e e e where µB k (z) is the height of the aggregated fuzzy set for the r rules. The e fuzzy set is defuzzified to yeld crisp output as represented by: aggregated
z ∗ = def uzzif ier(Z k ) (3) e where z ∗ is the crisp output and Z k is the fuzzy set resulted from aggregation, and defuzzifier represents theedefuzzification operator. The LOM defuzzyfication is done in two steps. First the largest height in the union is determined: hgt(Z k ) = sup µB k (z) e z∈Z e
(4)
Where supremum (sup) is the least upper bound. Then, the largest of maximum is calculated: o n (5) z ∗ = sup z ∈ Z | µB k (z) = hgt(Z k ) e z∈Z e
3
Experimental results
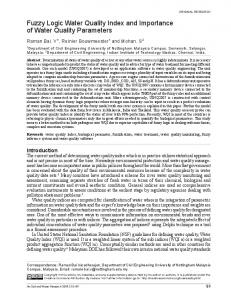
The set of fuzzy rules algorithm developed in Matlab has performed the following steps: • scalar representing the system input 3 variables were transformed into membership functions through the fuzzyfying functions; • the information was transferred to the inference engine; • values of membership functions were transformed into output by defuzzyfication of the scalar value, representing the output indicator which evaluates the air quality status (0 excellent quality; 1 bad quality). In this paper, we have selected for presentation only a segment of 1871 values for each input from the existing database in order to show a clear image of the FIS capabilities. Figure 6 offers information regarding the 5
1 AQI y mean y median
Very Bad
0.833333 Bad
0.666666
Air Quality Index
Satisfactory
0.5
Favourable 0.333333 Good
0.1666666666 Excelent
0
0
168
336
504
672
840
1008 Time (hours)
1176
1344
1512
1680
1848
2000
Figure 6: FIS-generated AQI timeline evolution corresponding to the hourly time series of pollutants (3 inputs with n = 1871 each) fluctuations of AQI during 78 days randomly selected from the database. Numerous exceedings over the 0.5 level have occurred corresponding to low quality of the surrounding air near the station. FIS output was statistically analyzed determining central tendency, dispersion and distribution indicators.
Frequency
Mean = 0.41 Std. Dev. =0.191 N =1,871
588
584
600
433 400
200 110 85 40 6 0 0.00
15
2 0.20
0.40
0.60
0.80
8 1.00
AQI Distribution
Figure 7: Air Quality Index frequency (0.9-1.0 interval means worst conditions of air quality) Figure 7 shows the AQI frequency. Of particular interest from the environmental point of view are the values occurring in the upper intervals. The presented FIS might be able to trigger alarms helping residents through early warnings when bad air quality conditions might occur. Analyzed data showed the occurrence of worst conditions (8 times) and also worrisome situations when AQI was in bad conditions (55 times). The developed FIS can be a useful tool for air quality control taking into account that the analyzed pollutant time series were randomly selected, but situations of concern were detected. The standardized skewness and kurtosis values were within the range expected for data from a normal distribution (-2, 2).
6
Figure 8: Statistical indicators of the AQI time series (n = 1871)
4
Conclusion
The concepts underlying fuzzy technology are successfully used in air quality modeling, allowing an alternative approach in solving specific environmental problems when the objectives or constraints are not precisely defined, and necessary information is missing, is sporadic or discontinuous. The AQI synthetic indicator allows the user a quick interpretation of the status of the surrounding air (imissions). By integrating three pollutant time series into single indicator, the FIS provided a better and comprehensive image of the air pollution status within the area of interest compared to classical pollution report using individual pollutant concentrations. Some issues might occur if using more than three variables due to the number increment of adjacent rules. Future work will focus on the following directions: Due to the large number of FIS rules a simplification is required and thus we will consider the utilization of parallel fuzzy systems that will reduce both the rules number as well as the processing time. We will test the adequacy of a time delay neural network implementation selecting the structure according to the best forecasting properties using FIS-generated AQI as input.
References [1] [RNMCA] - National Network http://www.calitateaer.ro
of
Air
Quality
Monitoring,
[2] D. Dunea, Developing an expert system applied for air quality assessments, The Scientific Bulletin of the Electrical Engineering Faculty, Bibliotheca Publishing House, , 2008, online at: http://www.buletinfie.ro/en/numere2008/Art13%20%20(S2),%20Dunea,%2069-74.pdf [3] B. Fisher , Fuzzy Environmental Decision-Making: Applications to Air Pollution, Atmospheric Environment, Vol.37, 2003, pp.1865-1877. 7
[4] P. Hajek ,V. Olej , Air Quality Indices and their Modelling by Hierarchical Fuzzy Inference Systems, WSEAS TRANSACTIONS on ENVIRONMENT and DEVELOPMENT, Issue 10, Volume 5, 2009. [5] N. K., Kasabov, Foundations of neural networks, fuzzy systems, and knowledge engineering, A Bradford Book, The MIT Press, Cambridge, Massachusetts, London, England, 1998. [6] E.G. Onkal, , I. Demir and H. Hiz, Assessment of urban air quality in Istanbul using fuzzy synthetic evaluation, J. Atmos. Environ. 38: 38093815, 2004. [7] M. Oprea, D. Dunea , 2010. SBC-MEDIU: a multi-expert system for environmental diagnosis. Environmental Engineering and Management Journal, 9 (2), pp. 205-213, 2010. [8] M. Saeedi, H. Fakhraee and M. Rezaei Sadrabadi, A Fuzzy Modified Gaussian Air Pollution Dispersion Model.Research Journal of Environmental Sciences, 2: 156-169, 2008. [9] P. Zannetti , Air Pollution Modelling, Theories, Computational Methods and Available Software, Van Nostrand Reinhold, New York, 1990.
8