Mourhir et al. Environmental Systems Research 2014, 3:21 http://www.environmentalsystemsresearch.com/content/3/1/21
RESEARCH
Open Access
River water quality index for Morocco using a fuzzy inference system Asmaa Mourhir1*, Tajjeeddine Rachidi2 and Mohammed Karim3
Abstract Background: The aim of this work is to propose a new river water quality index using fuzzy logic. The proposed fuzzy index combines quality indicators’ prescribed thresholds extracted mainly from the Moroccan and the Quebec water legislations. The latter is reputed for its strict water quality assessment. The proposed index combines six indicators, and not only does it exhibit a tool that accounts for the discrepancy between the two base indices, but also provides a quantifiable score for the determined water quality. These classifications with a membership grade can be of a sound support for decision-making, and can help assign each section of a river a gradual quality sub-objective to be reached. Results: To demonstrate the applicability of the proposed approach, the new index was used to classify water quality in a number of stations along the basins of Bouregreg-Chaouia and Zizi-Rhéris. The obtained classifications were then compared to the conventional physicochemical water quality index currently in use in Morocco. The results revealed that the fuzzy index provided stringent classifications compared to the conventional index in 41% and 33% of the cases for the two basins respectively. These noted exceptions are mainly due to the big disparities between the different quality thresholds in the two standards, especially for fecal coliform and total phosphorus. Conclusions: These large disparities put forward an argument for the Moroccan water quality legislation to be upgraded to align water and environmental assessment methods with other countries in order to mitigate the risks of failing to achieve a good ecological status. Keywords: Water quality index; Surface water; Fuzzy logic; Bouregreg-chaouia basin; Zizi-rhéris basin
Background Water quality indices aim at turning several complex indicators into a single synthesized value that describes the water quality of a particular source, and which is understandable by a wide audience including non-experts like the public or decision and policy-makers. There exist a number of water quality indices based on different indicators and aggregation methods used today throughout the world, such as the U.S. National Sanitation Foundation Water Quality Index (NSFWQI); the Canadian Council of Ministers of the Environment Water Quality Index (CCMEWQI); the British Columbia Water Quality Index (BCWQI), and the Oregon Water Quality Index (OWQI).
* Correspondence:
[email protected] 1 School of Sciences and Engineering, Al Akhawayn University in Ifrane, PO.Box 2083, Ifrane 53000, Morocco Full list of author information is available at the end of the article
A general flaw with conventional water quality indices is that they depend on human expertise with subjective and ambiguous information, which might raise a number of issues in water quality assessment. Another major problem is that quality indicator concentrations, no matter how far from or close to the limits have the same impact on the final score and might fall within the same classes (Icaga 2007). To deal with ambiguity and uncertainties, fuzzy logic, which was first introduced by (Zadeh 1965) is commonly used as a powerful formalism in environmental evaluation and assessment such as in water or air pollution issues. Ecological impact classification and environmental decision-making using fuzzy logic are discussed in detail by (Shepard 2005; Silvert 1997, 2000). According to the authors, using fuzzy logic is very convenient in the assessment of environmental issues because it can solve properly the ambiguities and subjectivity inherent in these problems. It also helps conciliating conflicting observations due to human expertise, and last but
© 2014 Mourhir et al.; licensee Springer. This is an Open Access article distributed under the terms of the Creative Commons Attribution License (http://creativecommons.org/licenses/by/4.0), which permits unrestricted use, distribution, and reproduction in any medium, provided the original work is properly cited.
Mourhir et al. Environmental Systems Research 2014, 3:21 http://www.environmentalsystemsresearch.com/content/3/1/21
not least, it can provide decision-makers with the ability to make well-informed decisions that are technically sound and legally defensible. Moreover, with fuzzy logic one can describe water quality in a location as being 10% excellent and 90% just good, which is not possible with classical approaches to water quality. Fuzzy logic has shown a good promise in modeling new water quality indices. (Lu et al. 1999; Chang et al. 2001) studied the feasibility of applying Fuzzy Synthetic Evaluation (FSE) to water quality. The Fuzzy Comprehensive Assessment (FCA) method was used by (Shen et al. 2005) to investigate pollution and evaluate the soil environmental quality of the Taihu lake watershed. (Liou et al. 2003) applied a two-stage fuzzy set theory to river quality evaluation in Taiwan. (Ocampo-Duque et al. 2006) used fuzzy logic and a comprehensive multi-attribute decision-aiding method based on the Analytic Hierarchy Process (AHP) to estimate the relative importance of water quality indicators. A 6-step procedure to develop a fuzzy water quality index was described in (Icaga 2007), and was applied to lake water. In another study by (Sadiq and Tesfamariam 2008), a Weighted Averaging Operator (OWA) was used for aggregation in developing the water quality index. (Lermontov et al. 2009; Roveda et al. 2010) developed fuzzy water quality indices for Brazilian rivers, and compared their performance with the conventional WQIs. A different approach was carried out by (Nasiri et al. 2007); the authors proposed a fuzzy multi-attribute decision support system to compute the water quality index and to outline the prioritization of alternative plans based on the extent of improvements in water quality. (Mahapatra et al. 2011) used a Cascaded Fuzzy Inference System (CFS) to design a multi-input, multi-output water quality index. In a recent study, (Gharibi et al. 2012) developed a FWQI for which the water quality indicators were practical and easy to measure, including heavy metals, and used the index to assess water quality in the Mamloo dam for drinking purposes. A different approach based on hybrid fuzzyprobability models was adopted in (Ocampo-Duque et al. 2013; Nikoo et al. 2011). In a recent work, (Wang et al. 2014) used variable fuzzy set and the information entropy theory as an assessment model to evaluate water quality of the Meiliang Bay in Taihu Lake Basin in China. The water quality in Moroccan rivers and streams is becoming more and more of a concern because of the significant amount of pollutants discharged into these ecosystems, in most cases without any treatment. Physicochemical and microbiological measurements and analyses are performed regularly by a number of public administrations. However, these analyses remain insufficient given the diversity of chemicals and the variety of pollution sources. This said; considerable efforts have been deployed recently in Morocco to improve water quality. The adoption of the “10-95” Water Law in 1995, the establishment
Page 2 of 12
of River Basin Management Agencies, the adoption of national plans for integrated water resource management, the adoption of a national program for sewerage and wastewater treatment in 2008, as well as the Water Strategy in 2009 are all actions in favor of better water quality outcomes. However, the application of the “10-95” texts is slow, and there is no improvement worthy to mention as yet in water quality, which remains generally degraded. In addition, the quality indicators used in analysis remain insufficient today, and pesticides intensified by the Maroc Vert plan are not taken into account. Only a simplified set of indicators that are realistic and easy to measure are actually used in the conventional index to estimate river water quality. For the other indicators (like heavy metals); the techniques used to evaluate these indicators are either complicated, time consuming, or costly, which results in discarding them from consideration in the final assessment of water quality. Clearly, from the deficiencies cited above, there is a need to upgrade the Moroccan legislation on water quality to include a new index. Such an index must factor in the use of indicators with direct causes on human and animal health, as well as evaluation thresholds. Our approach is progressive, and consists of providing, through fuzzy logic, a new index that captures the essence of the existing one (the conventional physiochemical index designed by a Decree in 2002 and never revised since), and yet incorporates the benefits of another well standing index. This is an initial step to improve water quality assessment through enhancement of threshold values in order to account for real water pollution, the index still needs to be improved to take into consideration contamination with heavy metals. For this purpose, the overall water quality index of Quebec (IQBP) (Hébert 1997) was chosen. The IQBP is very comparable to the Moroccan conventional water quality index, which will be referred to in the remainder of the text as (IMBP). Both IMBP and IQBP estimate water quality based on a number of physicochemical and bacteriological indicators, and provide water quality classes for multiple usages. They are also similar in terms of the evaluation method used which is based on the “minimum operator” that assigns the lowest indicator quality to the overall water quality in a given location. Moreover, the approach used to design the IQBP index relied on a group of thirty water quality experts and professionals from different horizons (chemists, biologists, managers, etc..) who have been consulted according to the Delphi method (Linstone and Turoff 1975). However, a quick comparison between the Moroccan water quality indicator threshold values and the ones used in Quebec reveals a big disparity between the two standards. In this work, fuzzy methodology is used to come up with a water quality index that we will be referring to as
Mourhir et al. Environmental Systems Research 2014, 3:21 http://www.environmentalsystemsresearch.com/content/3/1/21
MFWQI, by combining the Moroccan and Quebec standards. Membership functions for the different water quality indicators were developed considering boundaries from both water regulatory bodies. A fuzzy inference system was used to assess water quality with a membership grade in a number of stations along the basin under study. In the aforementioned studies about fuzzy indices, the generation of membership functions is usually done based on expert opinions, and hence remains difficult to maintain or update because they require expert consultation every time. In this paper, an easy-to-use method is introduced; it facilitates the generation of suitable membership functions based on a combination of already established standards by merging water quality thresholds in an automatic way. For any given indicator, the quality threshold values are determined in both standards; trapezoidal and triangular membership functions are then derived automatically based on interval intersection and linear interpolation. Furthermore, rules are derived automatically based on the number of variables as well as the number of membership functions, and the aggregation method used. If n is the number of required input variables, each represented with m membership functions, then the total number of rules required to model the system is m^n. Our approach in this work is
Page 3 of 12
to automatically generate the fuzzy index with minimum need for expert involvement. The concepts needed to model an index using fuzzy logic, including membership functions and fuzzy inference steps are described concisely in the Methods section.
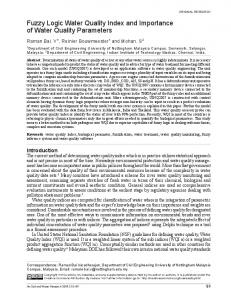
Results and discussion The results of comparison between the MFWQI and the conventional IMBP for each sampling site of the Bouregre-Chaouia basin over the period under study are illustrated in Figure 1. Based on the IMBP simplified quality grid shown in Table 1, the results of the monitoring performed during four campaigns showed that 76% of the sampled surface water points had a poor to very poor quality in January-09, as compared to 23% of good to average quality. However, in July-09 the quality improved to 44% points of good to average quality as compared to 56% points of poor to very poor quality. Based on the MFWQI, the results showed that 88% of the sampled surface water points had a poor to very poor quality in January-09, as compared to only 12% of good to average quality. In July-09 the quality improved to 32% points of good to average quality as compared to 68% points of poor to very poor quality.
Figure 1 Comparison of IMBP and MFWQI indices for the different stations of the Bouregreg-Chaouia basin.
Mourhir et al. Environmental Systems Research 2014, 3:21 http://www.environmentalsystemsresearch.com/content/3/1/21
Page 4 of 12
Table 1 Simplified rating table for the IMBP water quality indicators (Official Bulletin N°. 5062 of 5 December 2002) Sub-index
DO
BOD5
COD
NH4+
TP
FC
(mg/L)
(mg/L)
(mg/L)
(mg/L)
(mg/L)
(cfu/100 ml)1
Index
Excellent
>7
5,00
> 1,50
125 – 130 C
1001 – 2000
3,1 – 4,3
0,051 – 0,100
70 – 79 131 – 140
D
2001 – 3500
4,4 – 5,9
0,101 – 0,200
55 – 69 141 – 150
E
>3500
> 5,9
> 0,200
< 55 > 150
between the Moroccan and Quebec standards. These differences exhibit tougher quality thresholds in the IQBP for all water indicators in common between the two standards, especially for fecal coliform and total phosphorus.
One problem with this type of highly subjective water quality assessment rendered by both the IMBP and IQBP is that the final index does not take into consideration the uncertainty about acceptable threshold values for each indicator. In the next section an alternative to the IMBP
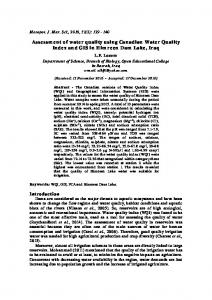
Figure 3 The different components of the fuzzy water quality index inference system.
Mourhir et al. Environmental Systems Research 2014, 3:21 http://www.environmentalsystemsresearch.com/content/3/1/21
Page 9 of 12
index based on fuzzy logic is proposed with more relevance to the type of uncertainties involved in this particular problem. Building a fuzzy water quality index for Morocco (MFWQI)
In order to combine the benefits from the two standards discussed above, fuzzy methodology is used to propose a new water quality index by conciliating quality thresholds from the Moroccan and Quebec legislations. Membership functions for the different water quality indicators were developed considering boundaries from both water regulatory bodies. A fuzzy inference system was designed and built to classify water quality with a membership grade. The components of the fuzzy inference system are depicted in Figure 3. The method used to generate membership functions is very simple. Having two pieces of intervals about the same water quality class, these two pieces of information are fused. It can be concluded that the actual value belongs to the intersection of these intervals. If I and J respectively denote the quality ranges for a given class of water quality in the Moroccan standard and the Quebec one, then I ∩ J is considered as the interval where certainty is the highest, corresponding to a degree of membership equal to 1. Then, a linear interpolation is used for the remaining points not belonging to the intersection by linking the lower and upper bounds of both I and J to the intersection interval, which results in a trapezoidal shape. In cases where the intersection results in a single point, the shape is triangular. For example, for FC to be considered as “good”, FC measurements must fall within [201, 1000] and [20, 2000] for IQBP and IMBP respectively. For the purpose of our fuzzy index, a trapezoidal membership function for the term “good” corresponding to the indicator
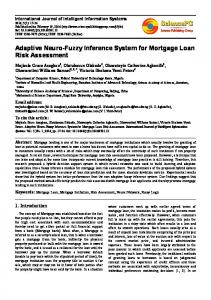
FC is developed from these two intervals according to Eq. 6. 8 0; x < 20 or x > 2000 > > > > ðx − 20Þ > > ; 20 ≤ x ≤ 200 > < ð200 − 20Þ μA ðxÞ ¼ ð6Þ 1 ; 200 ≤ x ≤ 1000 > > > > ð2000 − xÞ > > > : ð2000 – 1000Þ ; 1000 ≤ x ≤ 2000 Similarly, BOD5 is considered “good” when BOD5 measurements fall within intervals [1.8, 3] and [3, 5] for IQBP and IMBP respectively. The intersection of these intervals results in a single point, hence the shape of the membership function “good” for the variable BOD5 is triangular as shown by Eq. 7. 8 0; x < 1:8 or x > 5 > > > ðx − 1:8Þ > > < ; 1:8 ≤ x ≤ 3 ð3 − 1:8Þ ð7Þ μA ðxÞ ¼ > > ð5 − xÞ > > > : ð5 – 3Þ ; 3 ≤ x ≤ 5 Overall, five fuzzy sets, which are “excellent”, “good”, “average”, “poor”, and “very poor” have been considered for this study for both input indicators and for the output water quality index. Depending on the overlap between quality thresholds in the two standards, trapezoidal and triangular membership functions were derived from the parameters as shown in Table 4. Membership curves for input indicators and MFWQI are shown in Figure 4. Using the different fuzzy sets of the considered indicators, if-then rules were then generated automatically. Initially, since the inference methodology used relates the
Table 4 Parameters for membership functions of the different indicators used in the MFWQI DO
BOD5
COD
a
b
c
d
a
b
c
d
a
b
c
d
Excellent
7
7
11
20
0
0
1.8
3
0
0
20
30
Good
4
5
7
7
1.8
3
5
-
20
25
30
35
Average
2
3
4
5
3.1
4.3
5
10
25
35
40
-
Poor
0
1
2
3
4.4
5.9
10
25
40
40
80
80
Very poor
0
0
1
1
5.9
25
200
200
80
81
500
500
NH4+
TP
FC
a
b
c
d
a
b
c
d
a
b
c
d
Excellent
0
0
0.1
0.5
0
0
0.03
0.1
0
0
20
200
Good
0.1
0.5
1
-
0.03
0.05
0.1
0.3
20
200
1000
2000
Average
0.5
1
2
2
0.05
0.1
0.3
0.5
1000
2000
20000
-
Poor
2
2
5
8
0.1
0.2
0.5
3
2000
3500
20000
50000
Very poor
5
8
50
250
0.2
3
20
20
3500
50000
1800000
1800000
Mourhir et al. Environmental Systems Research 2014, 3:21 http://www.environmentalsystemsresearch.com/content/3/1/21
Page 10 of 12
Figure 4 Membership functions for DO, BOD5, COD, FC, NH4+, TP and MFWQI.
relevant subsets of each input universal set to the subsets of the other system inputs through an intersection-rule configuration, a total number of 5^6 rules were generated, representing the model of the water quality assessment system from the set of 6 input indicators and their possible 5 classes. However, as the inference is based on the minimum sub-index, an optimization could be made using a disjunction of inputs by means of the “OR” operator: the MFWQI is considered “very poor” if one of the indicators is “very poor”, and hence the rule used for all possible combinations in that case is Rule#3 as shown below. This optimization reduced the number of rules to 4097. The examples below show three rules for “good”, “poor”, and “very poor” water quality respectively:
Rule #1: If (DO is excellent) and (BOD5 is excellent) and (COD is excellent) and (NH4+ is excellent) and (TP is excellent) and (FC is good) then (MFWQI is good) Rule #2: If (DO is excellent) and (BOD5 is good) and (COD is average) and (NH4+ is poor) and (TP is good) and (FC is excellent) then (MFWQI is poor) Rule #3: If (DO is very poor) or (BOD5 is very poor) or (COD is very poor) or (NH4+ is very poor) or (TP is very poor) or (FC is very poor) then (MFWQI is very poor) In this work, the (Mamdani 1974) approach was used to build the MFWQI fuzzy inference engine. This approach is known for its simple structure and Max–Min inference. The implication method used is the “min” and
Mourhir et al. Environmental Systems Research 2014, 3:21 http://www.environmentalsystemsresearch.com/content/3/1/21
Page 11 of 12
Figure 5 Location of the Bouregreg-Chaouia sampling stations, surface water stations are shown in triangles.
the aggregation method is “max”. The defuzzification method used to determine the output is the center of gravity (COG) as expressed in Eq. (4). The computational tool used in modeling the overall system is the Matlab Fuzzy Logic Toolbox package 7.6. Study area
In order to assess the proposed fuzzy index, a case study of water quality was performed using measured environmental data on each sampling site of the monitoring network of the Bouregreg-Chaouia basin collected during two primary campaigns in December-08 and April-09, and two more full campaigns that took place in January-09 and July-09 on its primary and secondary surface water networks. The total number of analyses performed over the study period for surface waters was up to 979. We also conducted a secondary case study on a less polluted area namely the basin Ziz-Rhéris during the period 2007–2008. All measurements were conducted according to standard methods. Bouregreg-chaouia
The basin of Bouregreg-Chaouia (ABHBC 2000) extends over a surface of 20.470 km2; that is to say nearly 3% of the national territory. Structurally, it is composed of the three following areas: 1) the basin of Bouregreg: which is the most important one; 2) the basin of Coastal rivers between Bouregreg and Oum Er Rbia. The main rivers are Owed Yquem, Cherrat, Nfefikh and Mellah, which flow into the Atlantic Ocean between Rabat and Casablanca; 3) and the Chaouia Plain. The water quality monitoring network in the basin of Bouregreg-Chaouia was introduced in 1991. It tracks the quality status of surface water and groundwater in the region. It consists of 20 sampling stations, distributed as
follows: 1) the primary network, tracked four times a year, and which contains three hydrological stations: Tsalat Grou, Lalla Chafia on Oued Bouregreg and Ras El Oued on Fathia Aguenour; 2) the secondary network, tracked twice a year, consists of fourteen sampling points. The monitoring network is depicted on the map in Figure 5, where the surface water stations are shown in triangles. Ziz-Rhéris
The basin Ziz-Rhéris corresponds to watersheds of the Ziz and Rhéris oueds. The unit extends over a surface of 24.900 km2. The region is bounded on the north by the Moulouya Basin, to the north west by the basin of Oum-Rbia, to the west by the pool Draa, on the east by the watershed Guir and south by Algeria. This unit is located largely in the province of Errachidia, only the top Todgha upstream Tinjdad is part of the province of Ouarzazate. Competing interests The authors declare that they have no competing interests. Authors’ contributions AM designed the study, conducted data analysis and wrote the manuscript. TR revised critically and helped editing and polishing the paper. All authors have read and approved the final manuscript. Acknowledgement The authors would like to express their deep gratitude to the environmentalists who provided water data used in this study besides reports about the state of water quality in the area of the Hydraulic Basin of Bouregreg-Chaouia and Ziz-Rhéis. Author details 1 School of Sciences and Engineering, Al Akhawayn University in Ifrane, PO.Box 2083, Ifrane 53000, Morocco. 2School of Sciences and Engineering, Al Akhawayn University in Ifrane, PO.Box 1881, Ifrane 53000, Morocco. 3Faculté des Sciences, Université Sidi Mohammed Ben Abdellah, Faculté des Sciences Dhar el Mehraz, Fès, Morocco.
Mourhir et al. Environmental Systems Research 2014, 3:21 http://www.environmentalsystemsresearch.com/content/3/1/21
Received: 2 April 2014 Accepted: 29 June 2014 Published: 26 July 2014
References ABHBC (2000) Agence du Bassin Hydraulique du Bouregreg et de la Chaouia., http://www.abhbc.com/index.php/bassin/la-zone-daction-de-lagence. Accessed 08 July 2012 Borja Á, Galparsoro I, Solaun O, Muxika I, Tello EM, Uriarte A, Valencia V (2006) The European Water Framework Directive and the DPSIR, a methodological approach to assess the risk of failing to achieve good ecological status. Estuar Coast Shelf Sci 66(1–2):84–96 Chang N-B, Chen HW, Ning SK (2001) Identification of river water quality using the Fuzzy Synthetic Evaluation approach. J Environ Manage 63(3):293–305 Gharibi H, Mahvi AH, Nabizadeh R, Arabalibeik H, Yunesian M, Sowlat MH (2012) A novel approach in water quality assessment based on fuzzy logic. J Environ Manage 112:87–95 Hébert S (1997) Développement d’un indice de la qualité bactériologique et physico-chimique de l’eau pour les rivières du Québec, Québec. Ministère de l’Environnement et de la Faune, Direction des écosystèmes aquatiques, Quebec Icaga Y (2007) Fuzzy evaluation of water quality classification. Ecol Indic 7(3):710–718 Lermontov A, Yokoyama L, Lermontov M, Machado MAS (2009) River quality analysis using fuzzy water quality index: Ribeira do Iguape river watershed, Brazil. Ecol Indic 9(6):1188–1197 Linstone HA, Turoff M (1975) The Delphi method: techniques and applications. Addison-Wesley Pub. Co., Advanced Book Program, Boston, USA Liou S-M, Lo S-L, Hu C-Y (2003) Application of two-stage fuzzy set theory to river quality evaluation in Taiwan. Water Res 37(6):1406–1416 Lu RS, Lo SL, Hu JY (1999) Analysis of reservoir water quality using fuzzy synthetic evaluation. Stoch Env Res Risk A 13(5):327–336 Mahapatra SS, Nanda SK, Panigrahy BK (2011) A Cascaded Fuzzy Inference System for Indian river water quality prediction. Adv Eng Softw 42(10):787–796 Mamdani EH (1974) Application of fuzzy algorithms for control of simple dynamic plant. Proc Inst Elec Eng 121:1585–1588 Nasiri F, Maqsood I, Huang G, Fuller N (2007) Water Quality Index: A Fuzzy River-Pollution Decision Support Expert System. J Water Resour Plann Manag 133(2):95–105, doi:10.1061/(ASCE)0733-9496(2007)133:2(95) Nikoo M, Kerachian R, Malakpour-Estalaki S, Bashi-Azghadi S, Azimi-Ghadikolaee M (2011) A probabilistic water quality index for river water quality assessment: a case study. Environ Monit Assess 181(1–4):465–478, doi:10.1007/s10661-010-1842-4 Ocampo-Duque W, Ferré-Huguet N, Domingo JL, Schuhmacher M (2006) Assessing water quality in rivers with fuzzy inference systems: A case study. Environ Int 32(6):733–742 Ocampo-Duque W, Osorio C, Piamba C, Schuhmacher M, Domingo JL (2013) Water quality analysis in rivers with non-parametric probability distributions and fuzzy inference systems: Application to the Cauca River, Colombia. Environ Int 52:17–28 Ross TJ (1995) Fuzzy Logic with Engineering Applications. McGraw-Hill, New York, USA Roveda SRMM, Bondança APM, Silva JGS, Roveda JAF, Rosa AH (2010) Development of a water quality index using a fuzzy logic: A case study for the Sorocaba river. In: 2010 IEEE International Conference on Fuzzy Systems (FUZZ) Sadiq R, Tesfamariam S (2008) Developing environmental indices using fuzzy numbers ordered weighted averaging (FN-OWA) operators. Stoch Environ Res Risk Assess 22(4):495–505, 10.1007/s00477-007-0151-0 Shen G, Lu Y, Wang M, Sun Y (2005) Status and fuzzy comprehensive assessment of combined heavy metal and organo-chlorine pesticide pollution in the Taihu Lake region of China. J Environ Manage 76(4):355–362 Shepard RB (2005) Quantifying Environmental Impact Assessments Using Fuzzy Logic. Springer, USA Silvert W (1997) Ecological impact classification with fuzzy sets. Ecol Model 96(1–3):1–10 Silvert W (2000) Fuzzy indices of environmental conditions. Ecol Model 130(1–3):111–119
Page 12 of 12
Smith DG (1990) A better water quality indexing system for rivers and streams. Water Res 24(10):1237–1244 Wang Y, Sheng D, Wang D, Ma H, Wu J, Xu F (2014) Variable fuzzy set theory to assess water quality of the meiliang bay in taihu lake basin. Water Resour Manag 28(3):867–880 Zadeh LA (1965) Fuzzy sets. Inform Control 8:338–353 doi:10.1186/s40068-014-0021-y Cite this article as: Mourhir et al.: River water quality index for Morocco using a fuzzy inference system. Environmental Systems Research 2014 3:21.
Submit your manuscript to a journal and benefit from: 7 Convenient online submission 7 Rigorous peer review 7 Immediate publication on acceptance 7 Open access: articles freely available online 7 High visibility within the field 7 Retaining the copyright to your article
Submit your next manuscript at 7 springeropen.com