as âstepwise selection procedureâ (Cordell &. Claiton, 2002) or âbayesian ... (Ritchie, Hahn, Roodi et al., 2001; Moore, 2004) or support vector machine (SVM) ...
220
Chapter 14
GA-Based Data Mining Applied to Genetic Data for the Diagnosis of Complex Diseases Vanessa Aguiar University of A Coruña, Spain Jose A. Seoane University of A Coruña, Spain Ana Freire University of A Coruña, Spain Ling Guo University of A Coruña, Spain
ABSTRACT A new algorithm is presented for finding genotype-phenotype association rules from data related to complex diseases. The algorithm was based on genetic algorithms, a technique of evolutionary computation. The algorithm was compared to several traditional data mining techniques and it was proved that it obtained better classification scores and found more rules from the data generated artificially. It also obtained similar results when using some UCI Machine Learning datasets. In this chapter it is assumed that several groups of Single Nucleotide Polymorphisms (SNPs) have an impact on the predisposition to develop a complex disease like schizophrenia. It is expected to validate this in a short period of time on real data.
INTRODUCTION Complex diseases are those that result from the interaction of multiple factors, usually including both genetic and environmental factors (Risch, 2000). Due to their nature, it is hard to establish DOI: 10.4018/978-1-61520-893-7.ch014
a relationship between a gene and the disease. In general, this type of disease is caused by combination of effects of several sets of Single Nucleotide Polymorphisms (SNPs) which, separately, have a low effect. There is a high prevalence and impact of complex diseases like cancer, mental disorders and cardiovascular diseases. This situation has a
Copyright © 2010, IGI Global. Copying or distributing in print or electronic forms without written permission of IGI Global is prohibited.
GA-Based Data Mining Applied to Genetic Data for the Diagnosis of Complex Diseases
high repercussion on the costs of hospitals and, therefore, on the costs of the national health system. A SNP (Den Dunnen & Antonarakis, 2000) is a single nucleotide site where two (of four) different nucleotides occur in a high percentage of the population, that is, at least in 1% of the population. Since there exist 14 million of SNPs in human beings then a huge amount of data obtained from DNA genotyping needs to be dealt with, thus many variables have to be taken into account. This data can be analysed carrying out association studies. In a genetic association study, the frequency of a SNP variant in people affected by the same disease is compared to the frequency of a SNP variant in healthy people (control population). There has to be no familiar relationship between these subjects, they have to belong to the same ethnic group and have the same geographic origin. Carrying out such studies is expensive, mostly due to the cost of genotyping. Genotyping is the process of determining the genotype of an individual using a biological test. In Spain, for example, the cost of genotyping 74 SNPs for 720 samples reaches nearly 8.000€. The accuracy rate of the technologies used for this purpose ranges between 85-98%, depending on which one has been chosen. The technology used is chosen depending on the approach and purpose of the study and the number of SNPs to be genotyped. Not having an accuracy rate of 100% will make the analysis of genetic data more difficult as there will be missing data. An important challenge that molecular association study faces in the post genomic era is to understand the inter-connections between networks of genes and their products. These networks are initiated and regulated by a variety of environmental changes. The variety of genotype definitions leads to an increase of the number of tests that need to be run and also involves a large amount of comparisons. Non-reproducibility of many results obtained in several studies has led to criticism of association studies.
SNP data and haplotypes used in association studies of complex diseases have three main characteristics which represent important challenges in data analysis. These characteristics are: complexity, heterogeneity and a constantly evolving nature. In addition to this, this type of data is large, redundant, diverse and distributed. It is heterogeneous in the sense that it involves a large amount of data types, including categorical and continuous data, sequences, as well as temporal data, incomplete and missing data. There is a lot of redundancy in SNP and haplotype databases. This type of data is very dynamic and evolves continuously. Not only the data but also the schema evolves, which means that it requires special knowledge when designing modelling techniques. Finally, SNP and haplotype data is complex and has intrinsic features and subtle patterns, in the sense that it is very rich in associated complex phenotype traits or common multifactor diseases. In complex diseases, in general, the combination of certain genes predisposes to develop a disease and the environmental factors are those which increase the impact of these genes in the disease development. This is known as epistasis or epistatic effect. In addition, environmental factors, which at the population level seem to have only a moderate impact, might have higher risks in subpopulations with certain genetic predispositions. There are major methodological challenges in the study of gene-gene and gene-environment interactions. Another important challenge is to study large datasets in order to identify combinations of SNPs which interact increasing the predisposition to develop a certain complex disease. Thus, there is a need to develop methods capable of performing a massive analysis of SNP data related to complex diseases beyond that of traditional statistical approaches. Hence, the objective of this chapter is to develop an algorithm that will analyse data obtained from genotyping as part of an association study.
221
GA-Based Data Mining Applied to Genetic Data for the Diagnosis of Complex Diseases
This will help reduce the costs of this type of study. The chapter has the following structure: •
•
•
•
•
•
In the Introduction the problem to be solved is described and some basic concepts are explained. The Background section contains a summary of the state of the art of different types of methods used to perform association studies, such as statistical and soft computing methods. Methods describes in detail the algorithm developed and shows the problems other techniques have in this field. In the Results section, results obtained after applying the algorithm developed on different databases are shown. Future research directions describes the possible research lines that could be followed to continue improving the work presented in this chapter. Finally, in the Conclusions section, conclusions obtained after developing this work are explained.
BACKGROUND During recently years, the amount of data generated by association studies has increased remarkably and, due to this, a large number of methods have been developed. Not only statistical methods, but also computational methods have been designed to perform SNP-based genotype-phenotype association study analysis. These methods, as Kelemen et al. proposed in (2009), can be divided in three major groups: statistical methods, supervised and unsupervised data mining methods and soft computing methods.
Statistical Methods There are statistical methods based on measures and on statistical tests (Thomas 2004; Balding,
222
2006). These studies can be divided in preliminary analysis and genotype-phenotype association. The objective of the first group is to check the quality of the data, that is, to check the deviation of the Handy-Weinberg Equilibrium (HWE) (WittkeThompson, Pluzhinikov & Cox, 2005). This may help to choose an adequate set of SNPs or to infer haplotypes from genotypes. The Pearson goodness-of-fit is mainly used to analyse the HWE deviation. Tests for detecting missing (genotype) data are also part of this group (Little & Rubin, 2002). Even though missing data is not a problem when analysing a single SNP, when analysing multiple SNPs this situation can lead to some problems because many subjects could have one or more lost genotypes. The most common solution to this problem is to replace the missing genotypes with values predicted using the neighbours’ genotypes. “Maximum likelihood estimate” or random selection based on a probability distribution are mostly used. The second approach has an advantage over the first one: random selection allows softening the effects caused by the existence of missing data in results. There are three possibilities to perform association analyses. The first one corresponds to a single SNP association test. This type of test is based on proving the following null hypothesis: there is no association between the values of each SNP and the case or control value. The Pearson test and the exact Fisher test are mostly used and especially the last one, even though it is computationally more costly. In complex diseases, there are very few cases in which there exists a clear genotype-phenotype relationship, so the Pearson and the Fisher test may not be powerful enough. In this case, the Cochran-Armitage test (Armitage, 1955), which is more conservative than the previous ones and does not depend on the HWE, can be applied. The second type of analysis refers to continuous result analysis. Linear regression and analysis of variance (ANOVA) are classical methods used in
GA-Based Data Mining Applied to Genetic Data for the Diagnosis of Complex Diseases
studies that involve variables with a continuous outcome. ANOVA is equivalent to the Pearson test and it compares the non-association null hypothesis with the general alternative. Linear regression reduces the degrees of freedom assuming that a linear relationship exists between the outcome value considered in the study and the genotype. In both cases the tests need the genotypes to follow a normal distribution. If case-control studies are taken into account, linear regression is not very powerful due to the non-linear distribution followed by the case and control outcome values. Logistic regression is a more elaborate approach for this type of task, though it is mostly used to apply a score to a prediction instead of being used as a predictive method. Despite this, logistic regression is a flexible tool which can be easily adapted for multiple SNPs and it will allow including environmental interactions and covariates such as age or sex. When tests are applied to multiple SNPs, the aim of the test, given a set of SNPs in case and control subjects, is to find the set of SNPs related to a disease and/or, when an association is given, find the nearest SNPs to the current polymorphism. As mentioned previously, multiple SNP logistic regression is one of the most widely used methods. This method is a logical extension of single SNP analysis. When the number of SNPs is too large, being capable of selecting the most relevant SNPs and deleting those with correlations increases the power of the analysis at the expense of losing some information. Another solution to the problem of having too many correlated SNPs is to use techniques such as “stepwise selection procedure” (Cordell & Claiton, 2002) or “bayesian shrinkage methods” (Wang et al., 2005). One of the major problems of multiple SNP analysis is related to the existence of too many predictors, some of them strongly related. One possible strategy, inspired in the block structure followed by the human genome, is to use haplo-
types to delete the correlation in low recombination regions. This approach allows obtaining analyses with a lower number of degrees of freedom and also highlights the importance of combined effects of these accidental variables.
Data Mining Methods Data mining methods have a number of characteristics which make them very attractive to perform association study analysis. These methods are usually computationally efficient and scalable when high dimensionality data is used, as happens in GWAs (Genome-Wide Association studies). However, the models obtained tend to be considered simple with regard to those obtained by statistical methods. In addition, these methods usually tend to explore and discover. That is, unlike statistical methods, which are hypothesis-driven, data mining methods are hypothesis generators. Results obtained by analyses which use these techniques are often considered as a complement to traditional statistical analyses. Finally, data mining methods usually handle discrete data and use symbolic structures, providing more useful and understandable results and explanations than those provided by statistical methods, which are usually complex. Sometimes data mining is poorly defined as “non-trivial extraction of implicit, previously unknown and potentially useful information from data”. Data mining techniques used in association study analysis can be divided in two groups: classification methods, which try to find markers and other relevant characteristics in order to be able to predict a disease, and clustering techniques, which try to find subsets of subjects based on their genotypic and phenotypic similarity.
Classification Methods As mentioned previously, the aim of classification methods is to find rules or patterns which would help predict the value of a variable according to independent variables. Applied to association
223
GA-Based Data Mining Applied to Genetic Data for the Diagnosis of Complex Diseases
studies, this involves finding a group of patterns of SNPs or haplotypes that, together, form a good phenotype predictor and which may predict the susceptibility of a subject to a disease. Regression/ Classification/Decision trees is one of the most popular techniques. This type of technique is based on data recursive partitioning and it obtains a model with a tree structure. Some examples of the application of these techniques to association study analysis can be found in (Young & Ge, 2005; Cook, Zee & Ridker, 2004). Symbolic discriminant analysis (SDA) is used in large dataset analysis as it performs automatically and simultaneously a variable reduction and the development of the method. Some examples of the application of these techniques to genomics can be found in (Reif, White & Moore, 2004). An example of association analysis using association rules can be found in (Rova, Haataja, Marttila et al., 2004). This method is based on generating rules that describe co-occurrences of sets of characteristics. This classification method will be described in detail later. Other methods such as DICE (an automated method for the Detection of Informative Combined Effects) (Tahri-Daizadeh, Tregouet, Nicaud et al., 2003), multifactor dimensionality reduction (Ritchie, Hahn, Roodi et al., 2001; Moore, 2004) or support vector machine (SVM) (Waddell, Page, Zhan et al., 2005) have also been widely used for association study analysis.
Clustering Methods Clustering methods try to find relatively homogenous subsets in a dataset. Applied to association studies, these techniques try to find subsets of subjects which may share genetic characteristics. This type of clustering can be applied to genotypes and phenotypes. Once clustering has been applied, finding genetic factors in each cluster should be easier. An application of these techniques can be found in (Tzeng, Devlin, Wasserman et al., 2003; Toivonen, Onkamo, Hintsanen et al, 2005; Molitor,
224
Marjoram & Thomas, 2003; Wilcox, Wyszynski, Panhuysen et al., 2003).
Soft Computing Soft computing includes methods such as neural networks, evolutionary computation and fuzzy logic. In this area, there exist two main tasks in association study analysis. The first task is SNP pattern discovery in complex diseases and it includes subtle SNP selection from thousands of SNPs related to a disease. There are two possible approaches. One approach is the use of tagSNPs. TagSNPs are based on unsupervised methods. Methods which follow this approach try to identify the blocks of SNPs related to a disease. The other approach, SNP-disease association, is based on supervised methods which relate sets of SNPs to diseases without taking into account any preestablished blocks. The second task is gene-gene and geneenvironment interaction modelling in complex diseases. Due to the complexity of the problem, there are few research projects that deal with it. Jourdan et al. (2002) developed a genetic algorithm capable of extracting association rules from data obtained from diabetic patients. Later, the algorithm was adapted for use in distributed environments (Vermeulen-Jourdan, Dhaenens & Talbi, 2005). Clark et al. (2005) developed a genetic algorithm which builds logic trees. These trees consist of boolean expressions which group SNPs. This genetic algorithm was applied to studies about genetic variation of candidate genes. In each generation of the genetic algorithm a population of modified logic trees is generated using mutation, crossover and selection operators. The best trees are generated based on the fitness value, which is the outcome of the bayesian regression of the tree. Recent studies show that genetic programming improves the performance of many traditional statistical methods, as well as data mining and
GA-Based Data Mining Applied to Genetic Data for the Diagnosis of Complex Diseases
machine learning methods, such as linear regression and SVM. Ritchie et al. (2003) used an optimized neural network. Genetic programming is used to optimize the architecture of the neural network. This is done to improve the identification of combination of genes related to the risk of developing a disease. Motsinger et al. (2006) also used genetic programming for neural network optimization in order to detect gene-gene relationships in SNP data. Hubley et al. (2003) present an evolutionary algorithm for multiobjective SNP selection, which is able to approximate a set of optimal solutions. This design works well in large studies. They implemented a modified version of the StrengthPareto evolutionary algorithm. This algorithm is especially adequate for solving optimization problems with several objectives or complex search spaces where more exhaustive heuristics cannot be used. Banzhaf et al. (2006) used genetic algorithms, as well as other evolutionary computation techniques, to model gene-gene relationships. They also used evolved trees for haplotype analysis. Moore and White (2006) developed a hybrid method which combines genetic programming with multifactor dimensionality reduction (MDR) to choose SNPs. They found that this method worked better than random search when using simulated data. Several approaches to perform association study analysis have been explained so far. A review of the state of the art of association rule techniques is shown below. Association rules are a very popular structure for expressing patterns in a dataset. These patterns can be useful to understand the general behaviour of the problem generated by the dataset. This way, more information will be available to help solving problems such as decision-making, diagnosis, etcetera. The dataset can be expressed as a table. The rows of the table can be interpreted as samples, whereas the columns can be interpreted as types of characteristics presented by each sample. An
association rule can be defined as a probabilistic proposition about the occurrence of certain states in the data. A typical association rule could be “IF C1=2 AND C2=4 THEN CONSEQUENT”. An association rule can be formally seen as “IF A THEN B”, where A and B are disjoint item sets. Given an association rule, two measures are usually used to calculate the quality of the rule: coverage and confidence. The coverage of a rule can be defined as the number of instances that the rule is able to predict correctly. The confidence measures the percentage of times the rule is satisfied when it can be applied. The different search algorithms used to find association rules are based on searching rules that meet certain coverage and confidence minimum requirements. Several implementations of association rules can be found in (Lucrédio, Almeida & Prado, 2004; Srikant & Agrawal, 1995; Hipp, Guntzer & Nakaeizadeh, 2000).
Usage of Genetic Algorithms for Rule Extraction Evolutionary algorithms have a global search feature which makes them especially adequate for solving problems found along the different stages of a knowledge discovery process. In rule extraction processes, evolutionary algorithms treat interactions between attributes adequately because they evaluate a rule as a whole using a fitness function instead of evaluating the impact due to adding or deleting a condition of a rule. This last part is what local search processes do, including the majority of induction rule algorithms and decision trees. Genetic algorithms and genetic programming are the most used evolutionary algorithms for rule discovery. These two techniques differ mostly in how individuals are represented. In the case of genetic algorithms, individuals are represented as a linear string of conditions. When considering rules, each condition is usually a pair attribute-value. In the case of genetic programming, an individual is usually represented as a tree where the leaf nodes are the values of the
225
GA-Based Data Mining Applied to Genetic Data for the Diagnosis of Complex Diseases
attributes and the intern nodes represent functions. Genetic algorithms can follow two approaches depending on how rules are codified in a population of individuals (De Jong, 1988). The first possibility is to follow the “chromosome = rule” approach, in which each individual represents one rule. The second possibility is to follow the “chromosome = rule base” approach, also known as Pittsburg (Smith, 1980), in which each individual represents a set of rules. If the first approach is followed, there are two possibilities. In the first one, known as “Michigan approach” (Holland & Reitman, 1978), each individual modifies only one rule but the final solution is the final population or a subset of it. In this case, the behaviour of the whole set of rules needs to be evaluated, as well as the contribution of each single rule. The second possibility is to follow the IRL (Iterative Rule Learning) approach (González & Herrera, 1997), in which each chromosome represents a rule but the solution of the genetic algorithm is the best individual, whereas the global solution consists of the best individuals obtained from several consecutive runs. Choosing one approach or another depends on the task the rule search algorithm has to do. If the objective is to obtain a set of classification rules, then the behaviour of the whole set of rules must be evaluated and not only the quality of a single rule. In this case, the most adequate is to follow the “chromosome = rule base” approach, which considers the interactions among rules. Some examples in which genetic algorithms are used for classification and in which the previous approach has been followed can be found in (De Jong, Spears & Gordon, 1993; Janikow, 1993). However, this approach has some problems due to the usage of longer individuals (sometimes the length is even variable), increasing the algorithm’s computational cost, and due to the modification of genetic operators. Because of this, genetic algorithms following the “chromosome = rule” approach have also been designed (Greene & Smith, 1995; Giordana & Neri, 1995). In these
226
examples reduced individuals have been used, simplifying the design of genetic operators. This approach has two drawbacks. On one hand, calculating the fitness function is difficult as each rule is evaluated individually and, due to this, it is hard to determine the quality of the whole set of rules. On the other hand, the algorithm should not converge only to one individual as the objective is to obtain a set of rules. To prevent this from happening, a niche technique (Beasley, Bull & Martin, 1993) is needed to promote the existence of different individuals in the population. For association rule discovery, the best approach is “chromosome = rule” as the objective is usually to find a set of rules in which the quality of each rule is evaluated independently.
METHODS Issues, Controversies, Problems In the Background section, different approaches to the same type of problem have been described. In each case, the drawbacks of each existing method were explained. Thus, to overcome the problems the different methods have, an algorithm based in evolutionary computation (EC) has been developed. Given that this type of technique has been designed to solve optimization problems, an application of genetic algorithms is proposed with the aim of making rule extraction possible. The chromosome of the genetic algorithm (GA) will represent one rule.
Solutions and Recommendations A genetic algorithm was initially developed in order to solve the problem of analysing a large amount of data with the objective of finding association rules. The structure of this algorithm is described as follows.
GA-Based Data Mining Applied to Genetic Data for the Diagnosis of Complex Diseases
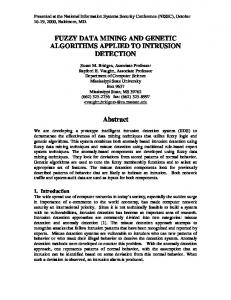
Figure 1. A possible rule
Definitions
Genetic Algorithm
Terms Used When referring to the genetic algorithm, the terms individual, rule and population will be used. Individual represents a GA individual (or chromosome), which is a possible solution for the problem. In this case, the solutions will be rules. The structure of the association rules is explained below. The population of the GA is the set of individuals that will evolve through the iterations. The terms subject, example or sample will be used when we want to refer to the data extracted from a patient (in this case, SNP data) or the data generated simulating real data.
GA Individual As mentioned above, each individual of the population represents a candidate rule. In a genetic algorithm, each individual is considered to be a chromosome. Below, the structure of this chromosome is described. The chromosome of the GA, shown in Figure 1, represents a candidate rule containing n SNPs plus a position for the phenotype. In this case, each SNP consists of two genes. One gene represents if the SNP is part, or not, of the rule (ACT) and the other one represents its real value (VALUE). The value taken by this gene will depend on the problem studied. All the positions of the chromosome, except the last one, represent the genotype. The last position of the chromosome, which represents the phenotype, can take 1 if the subject is a case or 0 if it is a control. Hence, the structure of an individual of the GA consists of 2n+1 genes that represent a chromosome. Each rule represents an individual of the GA population. For example, if the complex disease considered is schizophrenia, we could have the following rule extracted from the data: If SNP1=2 and SNPn=1 then the individual is genetically predisposed (Figure 1). Thus, a subject which has those values in those SNPs, would be considered to be predisposed to develop schizophrenia.
Structure of the Association Rules It is assumed that the influence of SNPs in genetic predisposition to develop a complex disease can be represented as several rules extracted from the data. These rules have the following structure: If the following conditions are met SNP1=X AND SNP2=Y AND … AND SNPn=Z
the individual is genetically predisposed, or not, to develop the complex disease studied. Each rule represents an individual of the GA population.
227
GA-Based Data Mining Applied to Genetic Data for the Diagnosis of Complex Diseases
Table 1. Implementation of the GA operators Operator
Implementation
Selection
Deterministic tournament selection has been used.
Crossover
One point and two point crossover algorithms have been implemented. For each algorithm there are two possible versions: one in which the crossover point (or points) belongs to one of the ancestors, and another one in which that point (or those points) is obtained combining the values the other ancestors had in that point. In this case, the algorithms will be known as one real point crossover and two real point crossover.
Mutation
Random replacement has been used.
If another problem is considered, such as the Breast Cancer problem described in the Results section, we could have the following rule extracted from the data: If the age belongs to the range 60-69 and the tumour size is between 50 and 54, then the subject is likely to develop breast cancer again. In this case, the data presents different attributes and not SNPs. As these attributes have been classified in several categories or ranges, the algorithm proposed in this chapter can be applied to this dataset. Fitness Function The fitness function will depend on the number of examples which is correctly and incorrectly classified. In this way, a GA individual will be penalised if it classifies incorrectly a high number of examples and will be rewarded if it classifies correctly a high number of examples. There is also a penalisation so that the rules obtained do not consist of one attribute (or one SNP) and to avoid obtaining rules with all the attributes (or SNPs) considered. The fitness function used, which has to be minimized, has the following structure: IF the rule doesn’t classify correctly any example THEN fitness = Number of examples of the training set + 0.1 x (Number of SNPs part of the rule / Number of SNPs in the examples) ELSE
228
fitness = Number of examples of the training set – Number of correctly classified examples + Number of incorrectly classified examples In the first part (the IF part) individuals are penalised adding the number of SNPs part of the rule divided by the total number of SNPs and multiplied by a coefficient to the number of examples. This addend is added in order to avoid the tendency of obtaining rules with all the SNPs. It is multiplied by 0.1 so that it will not have too much impact on the fitness value and to avoid obtaining rules with only one SNP. The value used as coefficient has been determined after a large number of experiments. In the second part (the ELSE part) individuals are penalised adding the number of incorrectly classified examples and are rewarded subtracting the number of correctly classified examples (See Table 1). Operators Parameters The parameters in Table 2 can be configured to obtain different results. The GA is executed until the fitness value changes less than a certain threshold (minimum change) or until a maximum number of generations is reached. Deterministic tournament selection has been used, as well as random replacement for mutation. Configuring the GA using a two-real-
GA-Based Data Mining Applied to Genetic Data for the Diagnosis of Complex Diseases
Table 2. Description of the parameters that can be configured Parameter
Description
Maximum number of generations
Represents the number of generations or iterations the GA will be executed.
Minimum change
If the GA population changes less than this threshold, then the GA will stop.
Number of GA individuals
Represents the number of individuals the GA will have in each generation. This parameter is directly proportional to the genotype length.
Genotype length
Represents the length of the GA chromosome, the number of attributes or variables considered for a given problem.
Crossover rate
Represents the percentage of individuals affected by the crossover operator in one iteration of the GA.
Mutation rate
Represents the percentage of individuals affected by the mutation operator in one iteration of the GA.
Crossover algorithm
Represents the type of crossover algorithm chosen. The possible choices are: one point crossover, two point crossover, one real point crossover and two real point crossover.
point crossover algorithm with a crossover rate of 90% and a mutation rate of 10% have proved to obtain the best results. For the problems in which there are, for example, 50 attributes (including the class), an adequate value for the number of GA Individuals would be between 750 and 1000.
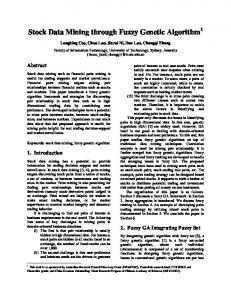
Iterative Algorithm Using only a genetic algorithm has some problems. Firstly, the genetic algorithm can fall in local minimums and can have difficulties in finding a solution when the search space is uniform. What is more, the individuals of the GA population can also become very similar after several generations. In addition to this, the genetic algorithm offers only one solution and, in this type of problem, there could be more than one solution. Moreover, it would be more interesting to obtain several solutions, which could be separated in the search space, as a result. In order to allow obtaining different solutions which meet the previous conditions, the Iterative Rule Learning (Venturini, 1993) approach (explained in the previous section) has been followed. Thus, the final method is capable of extracting several rules and has the advantage of
being able to explore different parts of the search space in one execution. The structure of this algorithm, which will be called iterative algorithm, is described below. This algorithm (Figure 2) consists of a loop that executes, in each iteration, a GA. Every time the GA is executed, a list of candidate rules is obtained. These rules, which correspond to the final population of the GA, are filtered in order to choose the best rule between those which classify a case or a control subject and cover at least a certain percentage of the samples from the training set. This percentage is a parameter set by the user (See Table 3). From the iterations of the iterative algorithm a set of rules covering the search space is obtained. That set will be called rule pool. Once there are enough rules, the rules from the Final Rule Pool are validated using a test set composed of control and case (disease) subjects. This happens when all the search space is covered or when a maximum number of iterations is reached. The algorithm developed is capable of finding logical expressions. These expressions classify a subject based on the values that the alleles of certain SNPs have.
229
GA-Based Data Mining Applied to Genetic Data for the Diagnosis of Complex Diseases
Figure 2. Iterative algorithm structure
The method proposed in this chapter was initially developed with the idea of applying it to problems related to a complex disease, such as schizophrenia. In these problems, each sample of the data consisted of a set of SNPs, which represents the genotype, and a value for the phenotype. This is the reason why the GA individuals were designed simulating this situation. Despite this, this method can be applied to other problems where SNPs would correspond to
different categorical attributes and the phenotype would represent the class.
RESULTS Test Bed Two different groups of datasets have been used. The first one, generated artificially, was used with the objective of observing if the algorithm
Table 3. Parameter Minimum percentage of correctly classified subjects
230
Description Represents the percentage of subjects from the training set that have to be correctly classified by the rule in order to add it to the rule pool.
GA-Based Data Mining Applied to Genetic Data for the Diagnosis of Complex Diseases
was able to find the patterns existing in the data. This dataset was also used to compare the results obtained by the method described in this chapter with those obtained by other traditional data mining techniques. The second one was used in order to compare the results obtained by the method presented to the results obtained by data mining techniques capable of extracting rules using published datasets.
Real Clinical Data This data was obtained as a result of genotyping DNA of patients. These patients can be classified as case (they developed the disease) or control (healthy). This data is presented in a file and each patient is represented as a list of numbers. Except for the first position, which represents the phenotype (case or control), the numbers represent SNPs. SNPs can take different values: homozygous (both copies of a given gene have the same allele) for the first allele (one of a number of alternative forms of the same gene occupying a given position on a chromosome), heterozygous (the patient has two different alleles of a given gene), homozygous for the second allele or unknown. The unknown value appears when there is a genotyping error as these techniques are not 100% accurate (mentioned in the Introduction section). Due to the nature of the data and that it is still under study, artificial data had to be generated. Artificial data, described below, will simulate real clinical data and, in this case, patterns introduced will be known.
Generation of Artificial Input Data In order to observe how the algorithm presented works, datasets have been generated. This is done so that a pattern simulating real clinical data exists in the data created. First of all, 360 random datasets were generated. Each dataset was divided in two groups:
case subjects and control subjects. Each group represents 50% of the dataset. After that, rules with two, three or four SNPs have been randomly generated. Some examples representing case subjects have been modified in different percentages (between 20% and 80%). The datasets can be firstly divided into three groups: sets modified applying one rule, those modified applying two rules and those modified applying three rules. The modification has been done introducing the values of the SNPs of the rules generated previously in the subjects’ corresponding positions. Each subject should be only modified by one rule. This way, it is possible to verify if the algorithm is able to find the rules introduced artificially. Another division can be done according to the percentage of case subjects modified. Thus, four groups of sets will be available for testing the algorithm. In each group 20%, 40%, 60% or 80% of the case subjects has been modified. Also, in each group, one third of the sets have been modified by rules of two SNPs, one third by rules of three SNPs and one third by rules of four SNPs.
UCI Machine Learning Repository Three datasets from the UCI Machine Learning Repository (Asuncion & Newman, 2007) were used. Results obtained from applying the algorithm developed were compared to those obtained by several classification methods that generated rules. The characteristics of each database are detailed below. The first dataset used was the Breast Cancer Dataset. This is one of three domains provided by the Oncology Institute that has repeatedly appeared in the machine learning literature. This breast cancer domain was obtained from the University Medical Centre, Institute of Oncology, Ljubljana, Slovenia. This dataset includes 201 instances of one class and 85 instances of another class, that is, 286
231
GA-Based Data Mining Applied to Genetic Data for the Diagnosis of Complex Diseases
instances in all. The instances are described by 9 attributes, some of which are linear and some are nominal, all of them categorical. This database has 9 missing values, distributed uniformly between case and control subjects. The second dataset which was used was the Breast Cancer Wisconsin (Original) dataset (Wolberg & Mangasarian, 1990; Bennet & Mangasarian, 1992). This breast cancer database was obtained from the University of Wisconsin Hospitals, Madison from Dr. William H. Wolberg. It includes 699 instances. There are 10 attributes represented as integers. There are also missing values. In this case, the 16 missing values appear mostly in control subjects. In fact, only two appear in case subjects, the rest appear in control subjects. The third dataset used is the Chess (King-Rook vs. King-Pawn) Dataset (Holte, Acker & Porter, 1989). This dataset includes 3196 instances. Each instance has 36 categorical attributes. In this case, there is not missing information.
Results To validate the algorithm 10-fold cross validation has been used. Therefore, the original data was divided into 10 subsets. Only one subset was used as test data, while the other 9 subsets were used for training. The cross validation is repeated ten times, using each time, only, each subset. The ten results obtained after doing the 10-fold cross validation have been combined in order to obtain global classification measures. The algorithm proposed has been compared, firstly, to 29 traditional data mining techniques using the artificial data generated. These techniques can be classified in the following categories: decision rule learning, classification trees, bayesian nets and other techniques such as neural networks, metaclassifiers, regression-based techniques… The data mining suite Weka (Witten & Frank, 2005) was used and the 29 techniques were ap-
232
plied to the 360 sets created artificially. After that, the techniques that obtained rules were applied to the three datasets from the UCI Machine Learning Repository described above.
Data mining Techniques The four main categories in which the techniques used for the comparison have been divided are described in the following paragraphs. The objective of decision rule learning techniques is to generate a set of decision rules in order to obtain hypothesis which could explain a concrete system. In a classification problem, the set of rules obtained will follow an IF-THEN-ELSE structure. Some examples of this type of method are the following: conjunctive rule, decision table, JRip, NNge, Ridor, DTNB... Classification trees build trees in which each leaf represents a class. To classify a pattern, this type of method starts in the root node and, depending on the values the variable (attribute) observed has, the instances are distributed along the child nodes. This process is repeated until a leaf node is reached. Some examples of classification trees are the following: J48, REPTree... Bayesian nets are a graphical representation of the dependencies used in probabilistic reasoning in which the nodes stand for random variables and the branches stand for direct dependence relationships among the variables. A bayesian classifier can be considered a special case of a Bayesian net in which there is a special variable, the class, and there are other variables, the attributes. The structure of the net will depend on the type of classifier. Some examples of techniques that use bayesian learning are the following: AODE, Bayes Net, HNB, Naive Bayes... As mentioned previously, some other techniques have been used, such as: Attribute Selected Classifier, LBR, Multilayer Perceptron, VFI, RBF Network, Adaboost M1, Bagging, Classification Via Regression...
GA-Based Data Mining Applied to Genetic Data for the Diagnosis of Complex Diseases
Figure 3. Comparison of classification percentages
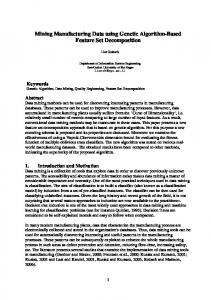
Results Firstly, results of the comparison using the artificial input data are shown. In Figure 3, the evolution of the percentages of correctly classified samples obtained for the different groups can be observed. The algorithm proposed obtains better results than all of the traditional methods used. These results are significantly better when less percentage of the case subjects is modified. Classification scores are shown in Table 4.
Ridor (Gaines & Compton, 1995) is the traditional algorithm that gets the best classification scores most of the times using these datasets. However, when 20% or 40% of the case subjects is modified, the number of rules found by Ridor is clearly less than the number of rules found by the algorithm presented in this chapter. For example, in the left part of Figure 4, it can be observed that while this algorithm extracts nearly 70% of the rules introduced artificially, Ridor is only able to find 30% of them when one rule is introduced in 20% of case subjects. If the
Table 4. Classification scores 20%
40%
60%
80%
Lowest scores of Weka’s algorithms
54.51%
58.00%
62.14%
68.41%
Mean Weka’s algorithm
56.47%
62.30%
68.66%
77.37%
Best scores of Weka’s algorithms
57.84%
64.83%
73.72%
83.81%
Algorithm proposed
60.68%
67.72%
75.86%
84.62%
233
GA-Based Data Mining Applied to Genetic Data for the Diagnosis of Complex Diseases
Figure 4. Comparison of found rules
right part of Figure 4 is observed, when one rule is introduced in 40% of case subjects, again, the algorithm presented obtains better results, finding more than 90% of the rules while Ridor is only able to find half of them. Moreover, in most of the situations where the algorithm presented does not find the exact rule, it finds a part of it (for example, for a rule made
of four SNPs it could find a rule with three SNPs), while Ridor, in many situations, is unable to find any of the rules introduced artificially. Below, results of the comparison using the UCI Machine Learning Repository are shown. In this case, only the methods that obtained rules were considered.
Table 5. Classification scores using UCI datasets Breast Cancer
Wisconsin Breast Cancer
King Rook vs King Pawn
Conjunctive rule
69.30%
91.97%
66.05%
Decision table
73.73%
95.49%
97.32%
DTNB
69.94%
96.85%
96.31%
JRip
71.45%
95.61%
99.21%
NNge
67.80%
96.18%
98.44%
OneR
66.91%
92.01%
66.91%
PART
69.41%
94.69%
99.17%
Ridor
72.50%
95.35%
88.06%
ZeroR
70.30%
65.52%
52.22%
Mean
70.15%
91.52%
84.85%
Method presented
76.07%
93.19%
94.39%
234
GA-Based Data Mining Applied to Genetic Data for the Diagnosis of Complex Diseases
Figure 5. Mean of the classification scores obtained using UCI datasets
As can be observed in Table 5, the method presented obtains better results than any other method capable of extracting rules when there is missing data and there is approximately the same number of case and control subjects with missing values. This is the case of the Breast Cancer Dataset, in which there are 2 attributes with missing values. For the other two datasets, the results obtained by the method presented are still adequate. Figure 5 shows the mean of the classification scores of the different methods. The method presented obtains a higher rate than seven of the nine methods used in this comparison.
FUTURE RESEARCH DIRECTIONS Future work will focus, firstly, on continuing to refine the algorithm. With that purpose, more tests will be run and the fitness function will be modified in order to try to obtain better classification scores. The possibility of using trees instead of rules as the structure which represents the pattern existing in the data will be considered.
Another research direction will be to consider the possibility of modifying the algorithm in order to allow using not only categorical data, but also real data. In addition to this, the option of allowing another type of classification will also be considered. That is, modifying the algorithm in order to add the capacity of classifying in more than two classes. This method has been designed in such a way that it allows changing or adding new modules. Taking this into account, the use of genetic programming instead of using genetic algorithms will be studied. Genetic programming allows obtaining sets of rules structured as trees and opens a broad range of new possibilities. The results of both designs will be compared, and also with the current one, in order to see which one is capable of finding more rules and which one is able to classify with higher accuracy scores. We hope to determine, with this, which approach is better: a tree-based approach or an IF-THEN rule approach; and which technique, genetic programming or genetic algorithms, seems to be better for the current problem.
235
GA-Based Data Mining Applied to Genetic Data for the Diagnosis of Complex Diseases
CONCLUSION In complex diseases, the factors that increase the risk of developing a certain disease do not correspond to the values of one or more genes. There is then a likelihood of several combinations of values of different sets of SNPs affecting the increase of the risk factor. The method described in this chapter is capable of finding several sets of SNPs related to control or case subjects. It is also able to find patterns structured as rules which represent a dataset with categorical attributes and classify new instances presented to the method. When comparing to 29 existing techniques using artificially generated data, it classifies better than all of them and it was able to find a higher percentage of the rules introduced artificially. The more noise the data has, the better classifies the method presented. When using datasets from the UCI Repository, this method achieves better results when there is missing data and it is distributed uniformly between case and control subjects. In addition to this, it obtains better classification scores than 7 of the 9 methods capable of extracting rules used.
ACKNOWLEDGMENT This work was partially supported by the Spanish Ministry of Science and Innovation (Ref TIN200613274) and the European Regional Development Funds (ERDF), grant (Ref. PIO52048 and RD07/0067/0005) funded by the Carlos III Health Institute, grant (Ref. PGDIT 07TMT011CT) and (Ref. PGDIT08SIN010105PR) from the General Directorate of Research, Development and Innovation of the Xunta de Galicia and grant (2007/127 and 2007/144) from the General Directorate of Scientific and Technologic Promotion of the Galician University System of the Xunta de Galicia. The work of Vanessa Aguiar is supported by a grant from the General Directorate of Quality and Management of Galicia’s University System of the
236
Xunta. The work of José A. Seoane is supported by an Isabel Barreto grant from the General Directorate of Research, Development and Innovation of the Xunta. Thanks go to M. Zwitter and M. Soklic for providing the data of the Breast Cancer Dataset, and to Dr. William H. Wolberg from the University of Wisconsin Hospitals for providing the Breast Cancer Wisconsin dataset.
REFERENCES Armitage, P. (1995). Test for linear trends in proportions and frequencies. Biometrics, 11, 375–386. doi:10.2307/3001775 Asuncion, A., & Newman, D. J. (2007). UCI Machine Learning Repository. Irvine, CA: University of California, School of Information and Computer Science. Retrieved from http://www. ics.uci.edu/~mlearn/MLRepository.html Balding, D. (2006). A tutorial on statistical methods for population association Studies. Nature Reviews. Genetics, 7, 781–791. doi:10.1038/nrg1916 Banzhaf, W., Beslon, G., Christensen, S., Foster, J. A., Kepes, F., & Lefort, V. (2006). Guidelines: from artificial evolution to computacional evolution: a research agenda. Nature Reviews. Genetics, 7(9), 729–735. doi:10.1038/nrg1921 Beasley, D., Bull, D. R., & Martin, R. R. (1993). A sequential niche technique for multimodal function optimization. Evolutionary Computation, 1(2), 101–125. doi:10.1162/evco.1993.1.2.101 Bennett, K. P., & Mangasarian, O. L. (1992). Robust linear programming discrimination of two linearly inseparable sets. Optimization Methods and Software, 1, 23–34. doi:10.1080/10556789208805504 Clark, T. G., De Iorio, M., Griffiths, R. C., & Farrall, M. (2005). Finding associations in dense genetic maps: a genetic algorithm approach. Human Heredity, 60, 97–108. doi:10.1159/000088845
GA-Based Data Mining Applied to Genetic Data for the Diagnosis of Complex Diseases
Cook, N. R., Zee, R. Y. L., & Ridker, P. M. (2004). Tree and spline based association analysis of gene-gene interaction models for ischemic stroke. Statistics in Medicine, 23, 1439–1453. doi:10.1002/sim.1749 Cordell, H. J., & Clayton, D. G. (2002). A unified stepwise regression approach for evaluating the relative effects of polymorphisms within a gene using case/control or family data: application to HLA in type 1 diabetes. American Journal of Human Genetics, 70, 124–141. doi:10.1086/338007 De Jong, K. A. (1988). Learning with genetic algorithms: an overview. Machine Learning, 3(2/3), 121–138. doi:10.1023/A:1022606120092 De Jong, K. A., Spears, W. M., & Gordon, D. F. (1993). Using genetic algorithms for concept learning. Machine Learning, 13(2/3), 161–188. doi:10.1023/A:1022617912649 Den Dunnen, J. T., & Antonarakis, S. E. (2000). Mutation Nomenclature Extensions and Suggestions to Describe Complex Mutations: A Discussion. Human Mutation, 15, 7–12. doi:10.1002/ (SICI)1098-1004(200001)15:13.0.CO;2-N Gaines, B. R., & Compton, P. (1995). Induction of Ripple-Down Rules Applied to Modeling Large Databases. Journal of Intelligent Information Systems, 5(3), 211–228. doi:10.1007/BF00962234 Giordana, A., & Neri, F. (1995). Search intensive concept induction. Evolutionary Computation, 3(4), 375–416. doi:10.1162/evco.1995.3.4.375 González, A., & Herrera, F. (1997). Multi-stage genetic fuzzy systems based on the iterative rule learning approach. Mathware & Soft Computing, 4(3), 233–249. Greene, D. P., & Smith, S. F. (1993). Competition based induction of decision models from examples. Machine Learning, 13(2), 229–257. doi:10.1023/A:1022622013558
Hipp, J., Guntzer, U., & Nakaeizadeh, G. (2000) Algorithms for Association Rule Mining - a General Survey and Comparison. In U. Fayyad (Ed.), Sixth ACM SIGKDD International Conference on Knowledge Discovery and Data Mining (Vol. 2, pp. 58 - 64). Boston: ACM. Holland, J. H., & Reitman, J. S. (1978). Cognitive Systems Based on Adaptive Algorithms. In D. A. Waterman & F. Hayes-Roth (Eds.), PatternDirected Inference Systems (pp. 313-329). New York: Academic Press. Holte, R. C., Acker, L., & Porter, B. W. (1989). Concept Learning and the Problem of Small Disjuncts (Tech. Rep. AI89-106). Austin, TX: University of Texas at Austin, Computer Sciences Department. Hubley, R. M., Zitzler, E., & Roach, J. C. (2003). Evolutionary algorithms for the selection of single nucleotide polymorphisms. BMC Bioinformatics, 4(30), 30–39. doi:10.1186/14712105-4-30 Janikow, C. Z. (1993). A knowledge-intensive genetic algorithm for supervised learning. Machine Learning, 13(2/3), 189–228. doi:10.1023/A:1022669929488 Jourdan, L., Dhaenens, C., Talbi, E.-G., & Gallina, S. (2002). A Data Mining Approach to Discover Genetic and Environmental Factors involved in Multifactorial Diseases. KnowledgeBased Systems, 15(4), 235–242. doi:10.1016/ S0950-7051(01)00145-9 Kelemen, A., Vasilakos, A. V., & Liang, Y. (2009). Computational Intelligence for genetic association study in complex diseases: review of theory and applications. International Journal of Computational Intelligence in Bioinformatics and System Biology, 1(1), 15–31. doi:10.1504/IJCIBSB.2009.024041 Little, R. J. A., & Rubin, D. B. (2002). Statistical Analysis with Missing Data. New York: John Wiley.
237
GA-Based Data Mining Applied to Genetic Data for the Diagnosis of Complex Diseases
Lucrédio, D., Almeida, E. S., & Prado, A. F. (2004). A Survey on Software Components Search and Retrieval. In R. Steinmetz & A. Mauthe (Eds.), 30th IEEE EUROMICRO Conference. Component-Based Software Engineering Track (pp. 152-159). Rennes, France: IEEE Press. Molitor, J., Marjoram, P., & Thomas, D. (2003). Fine-scale mapping of disease genes with multiple mutations via spatial clustering techniques. American Journal of Human Genetics, 73, 1368–1384. doi:10.1086/380415 Moore, J. H. (2004). Computational analysis of gene – gene interactions using multifactor dimensionality reduction. Expert Review of Molecular Diagnostics, 4, 795–803. doi:10.1586/14737159.4.6.795 Moore, J. H., & White, B. C. (2006). Exploiting expert knowledge for genome-wide genetic analysis using genetic programming. In T. P. Runarsson, H-G. Beyer, E. Burke, J. J. Merelo-Guervos, L. D. Whitley & X. Yao (Eds.), Parallel Problem Solving from Nature – PPSN IX (Vol. 4193, pp.969-977). Reykjavik, Iceland: Springer. Motsinger, A. A., Lee, S. L., Mellick, G., & Ritchie, M. D. (2006). GPNN: power studies and applications of a neural network method for detecting gene-gene interactions in studies of human disease. BMC Bioinformatics, 7(39). Reif, D. M., White, B. C., & Moore, J. H. (2004). Integrated analysis of genetic, genomic and proteomic data. Expert Review of Proteomics, 1, 67–75. doi:10.1586/14789450.1.1.67 Risch, N. (2000). Searching for genetic determinants in the new millennium. Nature, 405, 847–856. doi:10.1038/35015718 Ritchie, M. D., Hahn, L. W., & Roodi, N. (2001). Multifactor dimensionality reduction reveals highorder interactions among estrogen metabolism genes in sporadic breast cancer. American Journal of Human Genetics, 69, 138–147. doi:10.1086/321276
238
Ritchie, M. D., White, B. C., Parker, J. S., Hahn, L. W., & Moore, J. H. (2003). Optimization of neural network architecture using genetic programming improves detection and modelling of gene-gene interactions in studies of human diseases. BMC Bioinformatics, 4(28). Rova, M., Haataja, R., & Marttila, R. (2004). Data mining and multiparameter analysis of lung surfactant protein genes in bronchopulmonarydysplasia. Human Molecular Genetics, 13, 1095–1104. doi:10.1093/ hmg/ddh132 Smith, S. F. (1980). A learning system based on genetic adaptive Algorithms. Doctoral dissertation, University of Pittsburgh. Srikant, R., &Agrawal, R. (1995). Mining generalized association rules. In U. Dayal, P. Gray & S. Nishio (Eds.), 21st International Conference on Very Large Data Bases (pp. 407-419). Zurich, Germany: Morgan Kaufmann. Tahri-Daizadeh, N., Tregouet, D. A., & Nicaud, V. (2003).Automated detection of informative combined effects in genetics association Studies of complex traits. Genome Research, 13, 1952–1960. Thomas, D. C. (2004). Statistical Methods in Genetic Epidemiology. Oxford, UK: Oxford University Press. Toivonen, H., Onkamo, P., Hintsanen, P., et al. (2005). Data mining for gene mapping. In M. M. Kantardzic & J. Zurada (Eds.), New Generation of Data Mining Applications (pp. 263-293). Hoboken, NJ: IEEE Press. Tzeng, J. Y., Devlin, B., & Wasserman, L. (2003). On the identification of disease mutations by the analysis of haplotype similarity and goodness of fit. American Journal of Human Genetics, 72, 891–902. doi:10.1086/373881 Venturini, G. (1993). SIA: A supervised inductive algorithm with genetic search for learning attributes based concepts. In P. Brazdil (Ed.), Machine Learning: ECML-93: Vol. 667. European Conference on Machine Learning (pp. 280-296). Vienna: Springer.
GA-Based Data Mining Applied to Genetic Data for the Diagnosis of Complex Diseases
Vermeulen-Jourdan, L., Dhaenens, C., & Talbi, E.-G. (2005). Linkage disequilibrium study with a parallel adaptive GA. International Journal of Foundations of Computer Science, 16(2), 241–260. doi:10.1142/S0129054105002978 Waddell, M., Page, D., Zhan, F., et al. (2005). Predicting cancer susceptibility from singlenucleotide polymorphism data: A case study in multiple myeloma. In S. Parthasarathy, W. Wang & M.J. Zaki (Eds.), Fifth ACM SIGKDD Workshop on Data Mining in Bioinformatics (BIOKDD) (pp. 21-28). Chicago: ACM. Wang, H. (2005). Bayesian shrinkage estimation of quantitative trait loci parameters. Genetics, 170, 465–480. doi:10.1534/genetics.104.039354 Wilcox, M. A., Wyszynski, D. F., & Panhuysen, C. I. (2003). Empirically derived phenotypic subgroups - qualitative and quantitative trait analyses. BMC Genetics, 4(1), S15. doi:10.1186/14712156-4-S1-S15 Witten, I. H., & Frank, E. (2005). Data Mining: Practical machine learning tools and techniques (2nd Ed.). San Francisco, CA: Morgan Kaufmann. Wittke-Thompson, J. K., Pluzhinikov, A., & Cox, N. J. (2005). Rational Inferences about departures from Hardy-Weinberg equilibrium. American Journal of Human Genetics, 76, 967–986. doi:10.1086/430507 Wolberg, W. H., & Mangasarian, O. L. (1990). Multisurface method of pattern separation for medical diagnosis applied to breast cytology. Proceedings of the National Academy of Sciences of the United States of America, 87(23), 9193–9196. doi:10.1073/pnas.87.23.9193 Young, S. S., & Ge, N. (2005). Recursive partitioning analysis of complex disease pharmacogenetic studies I. Motivation and overview. Pharmacogenetics, 6, 65–75.
ADDITIONAL READING Banzhaf, W., Beslon, G., Christensen, S., Foster, J. A., Képès, F., & Lefort, V. (2006). Guidelines: From artificial evolution to computational evolution: a research agenda. Nature Reviews. Genetics, 7, 729–735. doi:10.1038/nrg1921 Bishop, C. M. (2006). Pattern Recognition and Machine Learning. Second Edition. New York: Springer. Cardon, L. R., & Bell, J. I. (2001). Association study designs for complex diseases. Nature Reviews. Genetics, 2, 91–99. doi:10.1038/35052543 Coello Coello, C. A., Lamont, G. B., & Van Veldhuizen, D. A. (2007). Evolutionary algorithms for solving multi-objective problems (2nd Ed.). New York: Springer. Craig, J. (2008). Complex diseases: Research and applications. Nature Education, 1(1). Dunham, H. (2003). Data mining: introductory and advanced topics. Upper Saddle River, NJ: Prentice Hall. Engelbrecht, A. P. (2007). Computational intelligence: an introduction (2nd Ed.). New York: Wiley. Foster, J. A. (2001). Computational genetics: Evolutionary computation. Nature Reviews. Genetics, 2, 428–436. doi:10.1038/35076523 Halldórsson, B. V., Istrail, S., & De La Vega, F. M. (2004)... Human Heredity, 58, 190–202. doi:10.1159/000083546 Han, J., & Kamber, M. (2006). Data mining: concepts and techniques (2nd Ed.). San Francisco, CA: Morgan Kaufmann. Hastie, T., Tibshirani, R., & Friedman, J. (2009). The elements of statistical learning: data mining, inference and prediction (2nd Ed.). New York: Springer.
239
GA-Based Data Mining Applied to Genetic Data for the Diagnosis of Complex Diseases
Haupt, R. L. (2004). Practical genetic algorithms (2nd Ed.). Hoboken, NJ: Wiley-Interscience. Hernández Orallo, J., Ramírez Quintana, M. J., & Ferri Ramírez, C. (2008). Introducción a la Minería de Datos. Madrid: Pearson Prentice Hall. Kantardzic, M. (2003). Data mining: concepts, models, methods, and algorithms. Totowa, NJ: Wiley-IEEE. Kiberstis, P., & Roberts, L. (2002). It’s not just the genes. Science, 296(5568), 685. doi:10.1126/science.296.5568.685 Lewis, C. M. (2002). Genetic association studies: Design, analysis and interpretation. Briefings in Bioinformatics, 3(2), 146–153. doi:10.1093/bib/3.2.146 Man, K. F., Tang, K. S., & Kwong, S. (1999). Genetic algorithms: concepts and designs. (Advanced textbooks in control and signal processing). London: Springer. Molitor, J., Marjoram, P., Conti, D., & Thomas, D. (2004). A survey of current Bayesian gene mapping methods. Human Genomics, 1(5), 371–374. Ott, J. (2001). Neural networks and disease association studies. [Neuropsychiatric Genetics]. American Journal of Medical Genetics, 105, 60–61. doi:10.1002/1096-8628(20010108)105:13.0.CO;2-L
240
Reeves, C. R., & Rowe, J. E. (2003). Genetic algorithms: principles and perspectives: A Guide to GA theory. Boston, MA: Kluwer. Rothlauf, F. (2006). Representations for genetic and evolutionary algorithms (2nd Ed.). Berlin: Springer. Sierra, B. (2006). Aprendizaje Automático: Conceptos básicos y avanzados. Aspectos prácticos utilizando el software Weka. Madrid: Pearson Prentice Hall. Tan, P.-N., Steinbach, M., & Kumar, V. (2006). Introduction to Data Mining. Boston, MA: Pearson Addition Wesley. Thomas, D. C., Stram, D. O., Conti, D., Molitor, J., & Marjoram, P. (2003). Bayesian spatial modeling of haplotype associations. Human Heredity, 56, 32–40. doi:10.1159/000073730 Todd, J. A. (2001). Human genetics: Tackling common disease. Nature, 411, 537–539. doi:10.1038/35079223 Willard, H. F., Angrist, M., & Ginsburg, G. S. (2005). Genomic medicine: genetic variation and its impact on the future of health care. Philosophical Transactions of the Royal Society B, 360, 1543–1550. doi:10.1098/rstb.2005.1683