arXiv:1002.4802v2 [cs.LG] 12 Mar 2010
Gaussian Process Structural Equation Models with Latent Variables
Ricardo Silva Department of Statistical Science University College London
[email protected]
Abstract In a variety of disciplines such as social sciences, psychology, medicine and economics, the recorded data are considered to be noisy measurements of latent variables connected by some causal structure. This corresponds to a family of graphical models known as the structural equation model with latent variables. While linear non-Gaussian variants have been wellstudied, inference in nonparametric structural equation models is still underdeveloped. We introduce a sparse Gaussian process parameterization that defines a non-linear structure connecting latent variables, unlike common formulations of Gaussian process latent variable models. The sparse parameterization is given a full Bayesian treatment without compromising Markov chain Monte Carlo efficiency. We compare the stability of the sampling procedure and the predictive ability of the model against the current practice.
1 CONTRIBUTION A cornerstone principle of many disciplines is that observations are noisy measurements of hidden variables of interest. This is particularly prominent in fields such as social sciences, psychology, marketing and medicine. For instance, data can come in the form of social and economical indicators, answers to questionnaires in a medical exam or marketing survey, and instrument readings such as fMRI scans. Such indicators are treated as measures of latent factors such as the latent ability levels of a subject in a psychological study, or the abstract level of democratization of a country. The literature on structural equation models (SEMs) (Bartholomew et al., 2008; Bollen, 1989) approaches such problems with directed graphical models, where each node in the graph is a noisy function of its parents. The goals of the analysis include typical applications of latent variable models, such as projecting points in a la-
Robert B. Gramacy Statistical Laboratory University of Cambridge
[email protected]
tent space (with confidence regions) for ranking, clustering and visualization; density estimation; missing data imputation; and causal inference (Pearl, 2000; Spirtes et al., 2000). This paper introduces a nonparametric formulation of SEMs with hidden nodes, where functions connecting latent variables are given a Gaussian process prior. An efficient but flexible sparse formulation is adopted. To the best of our knowledge, our contribution is the first full Gaussian process treatment of SEMs with latent variables. We assume that the model graphical structure is given. Structural model selection with latent variables is a complex topic which we will not pursue here: a detailed discussion of model selection is left as future work. Asparouhov and Muth´en (2009) and Silva et al. (2006) discuss relevant issues. Our goal is to be able to generate posterior distributions over parameters and latent variables with scalable sampling procedures with good mixing properties, while being competitive against non-sparse Gaussian process models. In Section 2, we specify the likelihood function for our structural equation models and its implications. In Section 3, we elaborate on priors, Bayesian learning, and a sparse variation of the basic model which is able to handle larger datasets. Section 4 describes a Markov chain Monte Carlo (MCMC) procedure. Section 5 evaluates the usefulness of the model and the stability of the sampler in a set of real-world SEM applications with comparisons to modern alternatives. Finally, in Section 6 we discuss related work.
2 THE MODEL: LIKELIHOOD Let G be a given directed acyclic graph (DAG). For simplicity, in this paper we assume that no observed variable is a parent in G of any latent variable. Many SEM applications are of this type (Bollen, 1989; Silva et al., 2006), and this will simplify our presentation. Likewise, we will treat models for continuous variables only. Although cyclic SEMs are also well-defined for the linear case (Bollen,
IL
PDL
Y1
Y2
Y3
ε1
ε2
ε3
ζ
ζ
IL
Y4
Y5
Y6
Y7
Y1
Y2
Y3
ε4
ε5
ε6
ε7
ε1
ε2
ε3
(a)
Y4
Y5
Y6
Y7
ε4
ε5
ε6
ε7
(b)
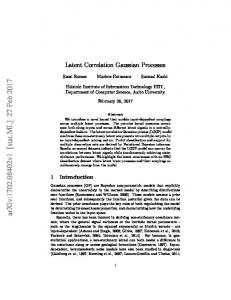
Figure 1: (a) An example adapted from Palomo et al. (2007): latent variable IL corresponds to a scalar labeled as the industrialization level of a country. P DL is the corresponding political democratization level. Variables Y1 , Y2 , Y3 are indicators of industrialization (e.g., gross national product) while Y4 , . . . , Y7 are indicators of democratization (e.g., expert assessements of freedom of press). Each variable is a function of its parents with a corresponding additive error term: ǫi for each Yi , and ζ for democratization levels. For instance, P DL = f (IL) + ζ for some function f (·). (b) Dependence among latent variables is essential to obtain sparsity in the measurement structure. Here we depict how the graphical dependence structure would look like if we regressed the observed variables on the independent latent variables of (a). 1989), non-linear cyclic models are not trivial to define and as such we will exclude them from this paper. Let X be our set of latent variables and Xi ∈ X be a particular latent variable. Let XPi be the set of parents of Xi in G. The latent structure in our SEM is given by the following generative model: if the parent set of Xi is not empty, Xi = fi (XPi ) + ζi , where ζi ∼ N (0, vζi )
(1)
N (m, v) is the Gaussian distribution with mean m and variance v. If Xi has no parents (i.e., it is an exogenous latent variable, in SEM terminology), it is given a mixture of Gaussians marginal1. The measurement model, i.e., the model that describes the distribution of observations Y given latent variables X , is as follows. For each Yj ∈ Y with parent set XPj , we have Yj = λj0 + XT Pj Λj + ǫj , where ǫj ∼ N (0, vǫj )
(2)
Error terms {ǫj } are assumed to be mutually independent and independent of all latent variables in X . Moreover, Λj is a vector of linear coefficients Λj = [λj1 . . . λj|XPj | ]T . Following SEM terminology, we say that Yj is an indicator of the latent variables in XPj . An example is shown in Figure 1(a). Following the notation of Bollen (1989), squares represent observed variables and circles, latent variables. SEMs are graphical models with an emphasis on sparse models where: 1. latent variables are dependent according to a directed graph model; 2. observed variables measure (i.e., are children of) very few latent variables. Although sparse latent variable models have been the object of study in machine learning and 1 For simplicity of presentation, in this paper we adopt a finite mixture of Gaussians marginal for the exogenous variables. However, introducing a Dirichlet process mixture of Gaussians marginal is conceptually straightforward.
statistics (e.g., Wood et al. (2006); Zou et al. (2006)), not much has been done on exploring nonparametric models with dependent latent structure (a loosely related exception being dynamic systems, where filtering is the typical application). Figure 1(b) illustrates how modeling can be affected by discarding the structure among latents2 . 2.1 Identifiability Conditions Latent variable models might be unidentifiable. In the context of Bayesian inference, this is less of a theoretical issue than a computational one: unidentifiable models might lead to poor mixing in MCMC, as discussed in Section 5. Moreover, in many applications, the latent embedding of the data points is of interest itself, or the latent regression functions are relevant for causal inference purposes. In such applications, an unidentifiable model is of limited interest. In this Section, we show how to derive sufficient conditions for identifiability. Consider the case where a latent variable Xi has at least three unique indicators Yi ≡ {Yiα , Yiβ , Yiγ }, in the sense that no element in Yi has any other parent in G but Xi . It is known that in this case (Bollen, 1989) the parameters of the structural equations for each element of Yi are identifiable (i.e., the linear coefficients and the error term variance) up to a scale and sign of the latent variable. This can be resolved by setting the linear structural equation of (say) Yiα to Yiα = Xi + ǫiα . The distribution of the error terms is then identifiable. The distribution of Xi follows from a 2 Another consequence of modeling latent dependencies is reducing the number of parameters of the model: a SEM with a linear measurement model can be seen as a type of module network (Segal et al., 2005) where the observed children of a particular latent Xi share the same nonlinearities propagated from XPi : in the context of Figure 1, each indicator Yi ∈ {Y4 , . . . , Y7 } has a conditional expected value of λi0 + λi1 f2 (X1 ) for a given X1 : function f2 (·) is shared among the indicators of X2 .
deconvolution between the observed distribution of an element of Yi and the identified distribution of the error term. Identifiability of the joint of X can be resolved by multivariate deconvolution under extra assumptions. For instance, Masry (2003) describes the problem in the context of kernel density estimation (with known joint distribution of error terms, but unknown joint of Y). Assumptions for the identifiability of functions fi (·), given the identifiability of the joint of X , have been discussed in the literature of error-in-variables regression (Fan and Truong, 1993; Carroll et al., 2004). Error-invariables regression is a special case of our problem, where Xi is observed but XPi is not. However, since we have Yiα = Xi + ǫi , this is equivalent to a error-in-variables regression Yiα = fi (XPi ) + ǫiα + ζi , where the compound error term ǫiα + ζi is still independent of XPi .
size N is represented as {Z(1) , . . . , Z(N ) }, where Z is the set of all variables. Lower case x represents fixed values of latent variables, and x1:N represents a whole set {x(1) , . . . , x(N ) }. For each xPi , the corresponding Gaussian process prior for (N ) (1) function values fi1:N ≡ {fi , . . . , fi } is fi1:N | x1:N Pi ∼ N (0, Ki ) where Ki is a N × N kernel matrix (Rasmussen and Williams, 2006), as determined by (d) (d) (d) 1:N xP . Each corresponding xi is given by fi + ζi , as i in Equation (1).
It can be shown that such identifiability conditions can be exploited in order to identify causal directionality among latent variables under additional assumptions, as discussed by Hoyer et al. (2008a) for the fully observed case3 . A brief discussion is presented in the Appendix. In our context, we focus on the implications of identifiabilty on MCMC (Section 5).
MCMC can be used to sample from the posterior distribution over latent variables and functions. However, each sampling step in this model costs O(N 3 ), making sampling very slow when N is at the order of hundreds, and essentially undoable when N is in the thousands. As an alternative, we introduce a multilayered representation adapted from the pseudo-inputs model of Snelson and Ghahramani (2006). The goal is to reduce the sampling cost down to O(M 2 N ), M < N . M can be chosen according to the available computational resources.
3 THE MODEL: PRIORS
3.2 Pseudo-inputs Review
Each fi (·) can be given a Gaussian process prior (Rasmussen and Williams, 2006). In this case, we call this class of models the GPSEM-LV family, standing for Gaussian Process Structural Equation Model with Latent Variables. Models without latent variables and measurement models have been discussed by Friedman and Nachman (2000)4 . 3.1 Gaussian Process Prior and Notation Let Xi be an arbitrary latent variable in the graph, with latent parents XPi . We will use X(d) to represent the dth X sampled from the distribution of random vector X, (d) (d) and Xi indexes its ith component. For instance, XPi is the dth sample of the parents of Xi . A training set of 3
Notice that if the distribution of the error terms is nonGaussian, identification is easier: we only need two unique indicators Yiα and Yiβ : since ǫiα , ǫiβ and Xi are mutually independent, identification follows from known results derived in the literature of overcomplete independent component analysis (Hoyer et al., 2008b). 4 To see how the Gaussian process networks of Friedman and Nachman (2000) are a special case of GPSEM-LV, imagine a model where each latent variable is measured without error. That is, each Xi has at least one observed child Yi such that Yi = Xi . The measurement model is still linear, but each structural equation among latent variables can be equivalently written in terms of the observed variables: i.e., Xi = fi (XPi ) + ζi is equivalent to Yi = fi (YPi ) + ζi , as in Friedman and Nachman.
We briefly review the pseudo-inputs model (Snelson and Ghahramani, 2006) in our notation. As before, let X(d) represent the dth data point for some X. (N ) (1) For a set X1:N ≡ {Xi , . . . , Xi } with corresponding i (N ) (1) parent set X1:N ≡ {XPi , . . . , XPi } and corresponding Pi latent function values fi1:N , we define a pseudo-input set ¯ 1:M ≡ {X ¯ (1) , . . . , X ¯ (M) } such that X i i i ¯ ¯ 1:M ∼ N (Ki;N M K−1 ¯fi , Vi ) fi1:N | x1:N i Pi , fi , x i;M ¯ 1:M f¯i | x ∼ N (0, K ) (3) i;M i where Ki;N M is a N × M matrix with each (j, k) ele(k) (j) ¯i ). Simiment given by the kernel function ki (xPi , x larly, Ki;M is a M × M matrix where element (j, k) is (k) (j) ¯i ). It is important to notice that each pseudoki (¯ xi , x ¯ (d) , d = 1, . . . , M , has the same dimensionality as input X i ¯ i works as an alterXPi . The motivation for this is that X native training set, with the original prior predictive means ¯ i = XPi . and variances being recovered if M = N and X Let ki;dM be the dth row of Ki;N M . Matrix Vi is a diagonal matrix with entry vi;dd given by vi;dd = (d) (d) −1 ki (xPi , xPi ) − kT i;dM Ki;M ki;dM . This implies that all la(1)
(N )
tent function values {fi , . . . , fi dependent.
} are conditionally in-
(1)
X1
(1)
f2
(1)
X2
(1)
X1
(1)
(1)
X2 (2)
X1
(2)
f2
(2)
X2
(2)
X1
f2 (2)
(3)
(3)
f2
(3)
X2
(2)
X2
(2)
f2
(3)
(3)
X1
(a)
(1)
X2
f2
(2)
X2
X1
f2
(1)
f2
(3)
X2
(b)
Figure 2: (a) This figure depicts a model for the latent structure X1 → X2 with N = 3 (edges into latent functions are lighter for visualization purposes only) using a standard Gaussian process prior. Dashed arrows represent that function val(1) (2) (3) (1) (2) (3) ues {f2 , f2 , f2 } are mutually dependent even after conditioning on {X1 , X1 , X1 }. In (b), we have the graphical depiction of the respective Bayesian pseudo-inputs model with M = 2. Althought the model is seemingly more complex, it scales much better: mutual dependencies are confined to the clique of pseudo-functions, which scales by M instead. 3.3 Pseudo-inputs: A Fully Bayesian Formulation The density function implied by (3) replaces the standard Gaussian process prior. In the context of Snelson and Ghahramani (2006), input and output variables are observed, and as such Snelson and Ghahramani optimize x ¯1:M by maximizing the marginal likelihood of i the model. This is practical but sometimes prone to overfitting, since pseudo-inputs are in fact free parameters, and the pseudo-inputs model is best seen as a variation of the Gaussian process prior rather than an approximation to it (Titsias, 2009). In our setup, there is limited motivation to optimize the pseudo-inputs since the inputs themselves are random variables. For instance, we show in the next section that the cost of sampling pseudo-inputs is no greater than the cost of sampling latent variables, while avoiding cumbersome optimization techniques to choose pseudo-input values. Instead we put a prior on the pseudo-inputs and extend the sampling procedure. By conditioning on the data, a good placement for the pseudo-inputs can be learned, since XPi ¯ (d) are dependent in the posterior. This is illustrated and X i by Figure 2. Moreover, it naturally provides a protection against overfitting. A simple choice of priors for pseudo-inputs is as fol¯ (d) , d = 1, . . . , M , is given lows: each pseudo-input X i a N (µdi , Σdi ) prior, independent of all other random variables. A partially informative (empirical) prior can be easily defined in the case where, for each Xk , we have the freedom of choosing a particular indicator Yq with fixed structural equation Yq = Xk + ǫq (see Section 2.1), implying E[Xk ] = E[Yq ]. This means if Xk is a parent Xi , we set the respective entry in µdi (recall µdi is a vector with an entry for every parent of Xi ) to the empirical mean of Yq . Each prior covariance matrix Σdi is set to be diagonal with a common variance. Alternatively, we would like to spread the pseudo-inputs a
priori: other things being equal, pseudo-inputs that are too close to each can be wasteful given their limited number. One prior, inspired by space-filling designs from the experimental design literature (Santner et al., 2003), is p(¯ x1:M ) ∝ det(Di ) i the determinant of a kernel matrix Di . We use a squared exponential covariance function with characteristic length scale of 0.1 (Rasmussen and Williams, 2006), and a “nugget” constant that adds 10−4 to each diagonal term. This prior has support over a [−L, L]|XPi | hypercube. We set L to be three times the largest standard deviation of observed variables in the training data. This is the pseudoinput prior we adopt in our experiments, where we center all observed variables at their empirical means. 3.4 Other Priors We adopt standard priors for the parametric components of this model: independent Gaussians for each coefficient λij , inverse gamma priors for the variances of the error terms and a Dirichlet prior for the distribution of the mixture indicators of the exogenous variables.
4 INFERENCE We use a Metropolis-Hastings scheme to sample from our space of latent variables and parameters. Similarly to Gibbs sampling, we sample blocks of random variables while conditioning on the remaining variables. When the corresponding conditional distributions are canonical, we sample directly from them. Otherwise, we use mostly standard random walk proposals. Conditioned on the latent variables, sampling the parameters of the measurement model is identical to the case of classical Bayesian linear regression. The same can be said of the sampling scheme for the posterior variances of each ζi . Sampling the mixture distribution parameters for the exogenous variables is also identical to the standard Bayesian
case of Gaussian mixture models. Details are described in the Appendix. We describe the central stages of the sampler for the sparse model. The sampler for the model with full Gaussian process priors is simpler and analogous, and also described in the Appendix. 4.1 Sampling Latent Functions In principle, one can analytically marginalize the pseudofunctions ¯fi1:M . However, keeping an explicit sample of the pseudo-functions is advantageous when sampling la(d) tent variables Xi , d = 1, . . . , N : for each child Xc of Xi , only the corresponding factor for the conditional den(d) sity of fc needs to be computed (at a O(M ) cost), since function values are independent given latent parents and pseudo-functions. This issue does not arise in the fullyobserved case of Snelson and Ghahramani (2006), who do marginalize the pseudo-functions. Pseudo-functions and functions {¯fi1:M , fi1:N } are jointly Gaussian given all other random variables and data. The conditional distribution of ¯fi1:M given everything, except (N ) (1) itself and {fi , . . . , fi }, is Gaussian with covariance matrix −1 −1 −1 ¯ i ≡ (K−1 +K−1 KT S i;M i;M i;N M (Vi +I/υζi )Ki;N M Ki;M )
where Vi is defined in Section 3.2 and I is a M × M identity matrix. The total cost of computing this matrix is O(N M 2 + M 3 ) = O(N M 2 ). The corresponding mean is −1 1:N ¯ i × K−1 KT S i;M i;N M (Vi + I/υζi )xi where x1:N is a column vector of length N . i ¯f 1:M i
Given that is sampled according to this multivariate (N ) (1) Gaussian, we can now sample {fi , . . . , fi } in parallel, since this becomes a mutually independent set with univari(d) ate Gaussian marginals. The conditional variance of fi is ′ vi ≡ 1/(1/vi;dd + 1/υζi ), where vi;dd is defined in Section (d) (d) 3.2. The corresponding mean is vi′ (fµ /vi;dd + xi /υζi ), (d) ¯ where fµ = ki;dM K−1 i;M fi . In Section 5, we also sample from the posterior distribution of the hyperparameters Θi of the kernel function used by Ki;M and Ki;N M . Plain Metropolis-Hastings is used to sample these hyperparameters, using an uniform proposal in [αΘi , (1/α)Θi ] for 0 < α < 1. 4.2 Sampling Pseudo-inputs and Latent Variables (d)
¯ i one at a time, d = We sample each pseudo-input x (d) ¯ i is a vector, with as many 1, 2, . . . , M . Recall that x entries as the number of parents of Xi . In our implementa(d)′ ¯ i simultaneously tion, we propose all entries of the new x
(d)′
¯i using a Gaussian random walk proposal centered at x with the same variance in each dimension and no correlation structure. For problems where the number of parents of Xi is larger than in our examples (i.e., four or more parents), other proposals might be justified. (d)
(d)
(\d)
¯ i given xi ) be the conditional prior for x Let π ¯i (¯ (\d) ¯ i , where (\d) ≡ {1, 2, . . . , d−1, d+1, . . . , M }. Given x (d)′ ¯ i , we accept a proposed x o the new value with probability n (d)′
min 1, li (¯ xi
(d)
)/li (¯ xi ) where (\d)
(d)
(d)′
(d)
(\d)
¯i) xi ) × p(f¯i | ¯fi , x = π ¯i (¯ QN ¯ 2 −1/2 −(fi(d) −ki;dM K−1 i;M fi ) /(2vi;dd ) × d=1 vi;dd e
li (¯ xi )
(\d)
(d)
¯ i ) is the conditional density that foland p(f¯i | ¯fi , x lows from Equation (3). Row vector ki;dM is the dth row of matrix Ki;N M . Fast submatrix updates of K−1 i;M and Ki;N M K−1 are required in order to calculate l (·) at a i i;M O(N M ) cost, which can be done by standard Cholesky updates (Seeger, 2004). The total cost is therefore O(N M 2 ) for a full sweep over all pseudo-inputs. (\d) (d) ¯ i ) is known to be The conditional density p(f¯i | ¯fi , x sharply peaked for moderate sizes of M (at the order of hundreds) (Titsias et al., 2009), which may cause mixing problems for the Markov chain. One way to mitigate this (d)′ (d)′ ¯i , jointly with x effect is to also propose a value f¯i which is possible at no additional cost. We propose the (\d) (d) ¯ i ). pseudo-function using the conditional p(f¯i | ¯fi , x The Metropolis-Hastings acceptance probability for this o n (d) (d)′ xi ) , xi )/li (¯ variation is then simplified to min 1, li0 (¯ where (d)
li0 (¯ xi )
(\d)
(d)′
xi ) = π ¯i (¯ QN ¯ 2 −1/2 −(fi(d) −ki;dM K−1 i;M fi ) /(2vi;dd ) × d=1 vi;dd e (d)
Finally, consider the proposal for latent variables Xi . For each latent variable Xi , the set of latent variable instan(N ) (2) (1) tiations {Xi , Xi , . . . , Xi } is mutually independent given the remaining variables. We propose each new la(d)′ tent variable value xi in parallel, and accept or reject it based on a Gaussian random walk proposal centered at the (d) current n value xi . We acceptothe move with probability (d)′
(d)
min 1, hXi (xi )/hXi (xi ) where, if Xi is not an exogenous variable in the graph, (d)
hXi (xi )
(d)
(d) 2
= e−(xi −fi ) /(2υζi ) Q (d) (d) ¯ c , xi ) × Xc ∈XC p(fc | ¯fc , x i Q (d) (d) × Yc ∈YC p(yc | xPc ) i
where XCi is the set of latent children of Xi in the graph, and YCi is the corresponding set of observed children.
(d) (d) ¯ c , xi ), which follows from The conditional p(fc | ¯fc , x (d) (3), is a non-linear function of xi , but crucially does not (·) depend on any xi variable except point d. The evaluation of this factor costs O(M 2 ). As such, sampling all latent values for Xi takes O(N M 2 ).
The case where Xi is an exogenous variable is analogous, given that we also sample the mixture component indicators of such variables.
5 EXPERIMENTS In this evaluation Section5 , we briefly illustrate the algorithm in a synthetic study, followed by an empirical evaluation on how identifiability matters in order to obtain an interpretable distribution of latent variables. We end this section with a study comparing the performance our model in predictive tasks against common alternatives6 . 5.1 An Illustrative Synthetic Study We generated data from a model of two latent variables (X1 , X2 ) where X2 = 4X12 + ζ2 , Yi = X1 + ǫi for i = 1, 2, 3 and Yi = X2 + ǫi , for i = 4, 5, 6. X1 and all error terms follow standard Gaussians. Given a sample of 150 points from this model, we set the structural equations for Y1 and Y4 to have a zero intercept and unit slope for identifiability purposes. Observed data for Y1 against Y4 is shown in Figure 3(a), which suggests a noisy quadratic relationship (plotted in 3(b), but unknown to the model). We run a GPSEM-LV model with 50 pseudo-inputs. The ex(d) (d) pected posterior value of each latent pair {X1 , X2 } for d = 1, . . . , 150 is plotted in Figure 3(c). It is clear that we were able to reproduce the original non-linear functional relationship given noisy data using a pseudo-inputs model. 5
MATLAB code to run all of our experiments is available at http://www.homepages.ucl.ac.uk/∼ucgtrbd/ code/gpsem.zip 6 Some implementation details: we used the squared expo1 |xp − xq |2 ) + nential kernel function k(xp , xq ) = a exp(− 2b −4 10 δpq , where δpq = 1 is p = q and 0 otherwise. The hyperprior for a is a mixture of a gamma (1, 20) and a gamma (10, 10) with equal probability each. The same (independent) prior is given to b. Variance parameters were given inverse gamma (2, 1) priors, and the linear coefficients were given Gaussian priors with a common large variance of 5. Exogenous latent variables were modeled as a mixture of five Gaussians where the mixture distribution is given a Dirichlet prior with parameter 10. Finally, for each latent Xi variable we choose one of its indicators Yj and fix the corresponding edge coefficient to 1 and intercept to 0 to make the model identifiable. We perform 20, 000 MCMC iterations with a burn-in period of 2000 (only 6000 iterations with 1000 of burn-in for the non-sparse GPSEM-LV due to its high computational cost). Small variations in the priors for coefficients (using a variance of 10) and variance parameters (using an inverse gamma (2, 2)), and a mixture of 3 Gaussians instead of 5, were attempted with no significant differences between models.
For comparison, the output of the Gaussian process latent variable model (GPLVM, Lawrence, 2005) with two hidden variables is shown in Figure 3(d). GPLVM here assumes that the marginal distribution of each latent variable is a standard Gaussian, but the measurement model is nonparametric. In theory, GPLVM is as flexible as GPSEMLV in terms of representing observed joints. However, it does not learn functional relationships among latent variables, which is often of central interest in SEM applications (Bollen, 1989). Moreover, since no marginal dependence among latent variables is allowed, the model adapts itself to find (unidentifiable) functional relationships between the exogenous latent variables of the true model and the observables, analogous to the case illustrated by Figure 1(b). As a result, despite GPLVM being able to depict, as expected, some quadratic relationship (up to a rotation), it is noisier than the one given by GPSEM-LV. 5.2 MCMC and Identifiability We now explore the effect of enforcing identifiability constraints on the MCMC procedure. We consider the dataset Consumer, a study7 with 333 university students in Greece (Bartholomew et al., 2008). The aim of the study was to identify the factors that affect willingness to pay more to consume environmentally friendly products. We selected 16 indicators of environmental beliefs and attitudes, measuring a total of 4 hidden variables. For simplicity, we will call these variables X1 , . . . , X4 . The structure among latents is X1 → X2 , X1 → X3 , X2 → X3 , X2 → X4 . Full details are given by Bartholomew et al. (2008). All observed variables have a single latent parent in the corresponding DAG. As discussed in Section 2.1, the corresponding measurement model is identifiable by fixing the structural equation for one indicator of each variable to have a zero intercept and unit slope (Bartholomew et al., 2008). If the assumptions described in the references of Section 2.1 hold, then the latent functions are also identifiable. We normalized the dataset before running the MCMC inference algorithm. An evaluation of the MCMC procedure is done by running and comparing 5 independent chains, each starting from a different point. Following Lee (2007), we evaluate convergence using the EPSR statistic (Gelman and Rubin, 1992), which compares the variability of a given marginal posterior within each chain and between chains. We calculate this statistic for all latent variables {X1 , X2 , X3 , X4 } across all 333 data points. A comparison is done against a variant of the model where the measurement model is not sparse: instead, each observed variable has all latent variables as parents, and no 7
There was one latent variable marginally independent of everything else. We eliminated it and its two indicators, as well as the REC latent variable that had only 1 indicator.
Observed data (normalized)
Latent data (normalized)
GPSEM−LV
GPLVM
5
5
4
4
4
4
3
3
3
2
2
2
1
1
0
0
0
−1
−1
−1
−2 −3
−2 −3
−2
−1
0
1
2
3
−2
−1
Y1
0
1
2
3
3
mode(X2)
X2
E[X2]
5
Y4
5
1
−2 −2.5
1 0 −1 −2
−2
−1.5
−1
−0.5
X1
(a)
2
0
0.5
1
1.5
2
−3 −2
2.5
−1
0
E[X1]
(b)
1
2
3
4
5
mode(X1)
(c)
(d)
Figure 3: (a) Plot of observed variables Y1 and Y4 generated by adding standard Gaussian noise to two latent variables X1 and X2 , where X2 = 4X12 + ζ2 , ζ2 also a standard Gaussian. 150 data points were generated. (b) Plot of the corresponding latent variables, which are not recorded in the data. (c) The posterior expected values of the 150 latent variable pairs according to GPSEM-LV. (d) The posterior modes of the 150 pairs according to GPLVM. 5 independent chains, sparse model
5 chains, unidentifiable model
5 independent chains, sparse model 3.5
5
4
3
4
2.5
3
3
1
0
X4, Data point:200
X2, Data point:10
X2, Data point:10
3 2
2 1 0 −1 −2 −3
0
500
1000
1500
Iteration
2000
2500
−4
2 1.5 1 0.5 0 −0.5
−1
−2
5 chains, unidentifiable model
5
X4, Data point:200
4
2000
4000
6000
8000
10000
−1.5
1 0 −1 −2 −3
−1 0
2
−4 0
500
1000
Iteration
1500
2000
Iteration
(10)
2500
−5
0
2000
4000
6000
8000
10000
Iteration
(200)
Figure 4: An illustration of the behavior of independent chains for X2 and X4 using two models for the Consumer data: the original (sparse) model (Bartholomew et al., 2008); an (unidentifiable) alternative where the each observed variable is an indicator of all latent variables. In the unidentifiable model, there is no clear pattern across the independent chains. Our model is robust to initialization, while the alternative unidentifiable approach cannot be easily interpreted. coefficients are fixed. The differences are noticeable and illustrated in Figure 4. Box-plots of EPSR for the 4 latent variables are shown in Figure 5. It is difficult to interpret or trust an embedding that is strongly dependent on the initialization procedure, as it is the case for the unidentifiable model. As discussed by Palomo et al. (2007), identifiability might not be a fundamental issue for Bayesian inference, but it is an important practical issue in SEMs. 5.3 Predictive Verification of the Sparse Model We evaluate how well the sparse GPSEM-LV model performs compared against two parametric SEMs and GPLVM. The linear structural equation model is the SEM, where each latent variable is given by a linear combination of its parents with additive Gaussian noise. Latent variables without parents are given the same mixture of Gaussians model as our GPSEM-LV implementation. The quadratic model includes all quadratic and linear terms, plus first-order interactions, among the parents of any given latent variable. This is perhaps the most common nonlinear SEM used in practice (Bollen and Paxton, 1998; Lee, 2007). GPLVM is fit with 50 active points and the rbf kernel with automatic relevance determination (Lawrence,
2005). Each sparse GPSEM model uses 50 pseudo-points. We performed a 5-fold cross-validation study where the average predictive log-likelihood on the respective test sets is reported. Three datasets are used. The first is the Consumer dataset, described in the previous section. The second is the Abalone data (Asuncion and Newman, 2007), where we postulate two latent variables, “Size” and “Weight.” Size has as indicators the length, diameter and height of each abalone specimen, while Weight has as indicators the four weight variables. We direct the relationship among latent variables as Size → W eight. The third is the Housing dataset (Asuncion and Newman, 2007; Harrison and Rubinfeld, 1978), which includes indicators about features of suburbs in Boston that are relevant for the housing market. Following the original study (Harrison and Rubinfeld, 1978, Table IV), we postulate three latent variables: “Structural,” corresponding to the structure of each residence; “Neighborhood,” corresponding to an index of neighborhood attractiveness; and “Accessibility,” corresponding to an index of accessibility within Boston8 . The corresponding 11 non-binary ob8
The analysis by (Harrison and Rubinfeld, 1978, Table IV)
EPSR distribution, consumer data
Abalone: Predictive Latent Variables
Housing: Predictive Latent Variables
4
14 12
Neighborhood I
3
3
Weight
EPSR, 333 points
2
2.5
1
0
2
10 8 6 4 2
−1 0 −2 −4
−3
−2
−1
0
Size
1.5
1 1
2
3
4
X
Figure 5: Boxplots for the EPSR distribution across each of the 333 datapoints of each latent variable. Boxes represent the distribution for the non-sparse model. A value less than 1.1 is considered acceptable evidence of convergence (Lee, 2007), but this essentially never happens. For the sparse model, all EPSR statistics were under 1.03. served variables that are associated with the given latent concepts are used as indicators. The “Neighborhood” concept was refined into two, “Neighborhood I” and “Neighborhood II” due to the fact that three of its original indicators have very similar (and highly skewed) marginal distributions, which were very dissimilar from the others9 . The structure among latent variables is given by a fully connected network directed according to the order {Accessibility, Structural, Neighborhood II, Neighborhood I}. Harrison and Rubinfeld (1978) provide full details on the meaning of the indicators. We note that it is well known that the Housing dataset poses stability problems to density estimation due to discontinuities in the variable RAD, one of the indicators of accessibility (Friedman and Nachman, 2000). In order to get more stable results, we use a subset of the data (374 points) where RAD < 24. The need for non-linear SEMs is well-illustrated by Figure 6, where fantasy samples of latent variables are generated from the predictive distributions of two models. We also evaluate how the non-sparse GPSEM-LV behaves compared to the sparse alternative. Notice that while Consumer and Housing have each approximately 300 training points in each cross-validation fold, Abalone has over 3000 points. For the non-sparse GPSEM, we subsampled all of also included a fourth latent concept of “Air pollution,” which we removed due to the absence of one of its indicators in the electronic data file that is available. 9 The final set of indicators, using the nomenclature of the UCI repository documentation file, is as follows: “Structural” has as indicators RM and AGE; “Neighborhood I” has as indicators CRIM , ZN and B; “Neighborhood II” has as indicators IN DU S, T AX, P T RAT IO and LST AT ; “Accessibility” has as indicators DIS and RAD. See (Asuncion and Newman, 2007) for detailed information about these indicators. Following Harrison and Rubinfield, we log-transformed some of the variables: IN DU S, DIS, RAD and T AX.
1
2
3
−2 −3
−2
−1
0
1
2
3
Accessibility
Figure 6: Scatterplots of 2000 fantasy samples taken from the predictive distributions of sparse GPSEM-LV models. In contrast, GPLVM would generate spherical Gaussians.
Abalone training folds down to 300 samples. Results are presented in Table 1. Each dataset was chosen to represent a particular type of problem. The data in Consumer is highly linear. In particular, it is important to point out that the GPSEM-LV model is able to behave as a standard structural equation model if necessary, while the quadratic polynomial model shows some overfitting. The Abalone study is known for having clear functional relationships among variables, as also discussed by Friedman and Nachman (2000). In this case, there is a substantial difference between the non-linear models and the linear one, although GPLVM seems suboptimal in this scenario where observed variables can be easily clustered into groups. Finally, functional relationships among variables in Housing are not as clear (Friedman and Nachman, 2000), with multimodal residuals. GPSEM still shows an advantage, but all SEMs are suboptimal compared to GPLVM. One explanation is that the DAG on which the models rely is not adequate. Structure learning might be necessary to make the most out of nonparametric SEMs. Although results suggest that the sparse model behaved better that the non-sparse one (which was true of some cases found by Snelson and Ghahramani, 2006, due to heteroscedasticity effects), such results should be interpreted with care. Abalone had to be subsampled in the non-sparse case. Mixing is harder in the non-sparse model since all (N ) (1) datapoints {Xi , . . . , Xi } are dependent. While we believe that with larger sample sizes and denser latent structures the non-sparse model should be the best, large sample sizes are too expensive to process and, in many SEM applications, latent variables have very few parents. It is also important to emphasize that the wallclock sampling time for the non-sparse model was an order of magnitude larger than the sparse case with M = 50 − even considering that 3000 training points were used by the sparse model in the Abalone experiment, against 300 points by the non-sparse alternative.
Fold 1 Fold 2 Fold 3 Fold 4 Fold 5
GPS -20.66 -21.03 -20.86 -20.79 -21.26
GP -21.17 -21.15 -20.88 -21.09 -21.76
Consumer LIN QDR -20.67 -21.20 -21.06 -21.08 -20.84 -20.90 -20.78 -20.93 -21.27 -21.75
GPL -22.11 -22.22 -22.33 -22.03 -22.72
GPS -1.96 -1.90 -1.91 -1.77 -3.85
GP -2.08 -2.97 -5.50 -2.96 -4.56
Abalone LIN QDR -2.75 -2.00 -2.52 -1.92 -2.54 -1.93 -2.30 -1.80 -4.67 -3.84
GPL -3.04 -3.41 -3.65 -3.40 -4.80
GPS -13.92 -15.07 -13.66 -13.30 -13.80
GP -14.10 -17.70 -15.75 -15.98 -14.46
Housing LIN QDR -14.46 -14.11 -16.20 -15.12 -14.86 -14.69 -14.05 -13.90 -14.67 -13.71
GPL -11.94 -12.98 -12.58 -12.84 -11.87
Table 1: Average predictive log-likelihood in a 5-fold cross-validation setup. The five methods are the GPSEM-LV model with 50 pseudo-inputs (GPS), GPSEM-LV with standard Gaussian process priors (GP), the linear and quadratic structural equation models (LIN and QDR) and the Gaussian process latent variable model (GPL) of Lawrence (2005), a nonparametric factor analysis model. For Abalone, GP uses a subsample of the training data. The p-values given by a paired Wilcoxon signed-rank test, measuring the significance of positive differences between sparse GPSEM-LV and the quadratic model, are 0.03 (for Consumer), 0.34 (Abalone) and 0.09 (Housing).
6 RELATED WORK Non-linear factor analysis has been studied for decades in the psychometrics literature10 . A review is provided by Yalcin and Amemiya (2001). However, most of the classic work is based on simple parametric models. A modern approach based on Gaussian processes is the Gaussian process latent variable model of Lawrence (2005). By construction, factor analysis cannot be used in applications where one is interested in learning functions relating latent variables, such as in causal inference. For embedding, factor analysis is easier to use and more robust to model misspecification than SEM analysis. Conversely, it does not benefit from well-specified structures and might be harder to interpret. Bollen (1989) discusses the interplay between factor analysis and SEM. Practical non-linear structural equation models are discussed by Lee (2007), but none of such approaches rely on nonparametric methods. Gaussian processes latent structures appear mostly in the context of dynamical systems (e.g., Ko and Fox (2009)). However, the connection is typically among data points only, not among variables within a data point, where online filtering is the target application.
sampling of the pseudo-inputs, one might consider a hybrid approach where a subset of the pseudo-inputs is fixed and determined prior to sampling using a cheap heuristic. New ways of deciding pseudo-input locations based on a given measurement model will be required. Evaluation with larger datasets (at least a few hundred variables) remains an open problem. Finally, finding ways of determining the graphical structure is also a promising area of research.
Acknowledgements We thank Patrick Hoyer for several relevant discussions concerning the results of Section 2.1, and Irini Moustaki for the consumer data.
References T. Asparouhov and Bengt Muth´en. Exploratory structural equation modeling. Structural Equation Modeling, 16, 2009. A. Asuncion and D.J. Newman. UCI machine learning repository, 2007. D. Bartholomew, F. Steele, I. Moustaki, and J. Galbraith. Analysis of Multivariate Social Science Data. Chapman & Hall, 2008.
7 CONCLUSION
K. Bollen. Structural Equations with Latent Variables. John Wiley & Sons, 1989.
The goal of graphical modeling is to exploit the structure of real-world problems, but the latent structure is often ignored. We introduced a new nonparametric approach for SEMs by extending a sparse Gaussian process prior as a fully Bayesian procedure. Although a standard MCMC algorithm worked reasonably well, it is possible as future work to study ways of improving mixing times. This can be particularly relevant in extensions to ordinal variables, where the sampling of thresholds will likely make mixing more difficult. Since the bottleneck of the procedure is the
K. Bollen and P. Paxton. Interactions of latent variables in structural equation models. Structural Equation Modeling, 5:267– 293, 1998.
10
Another instance of the “whatever you do, somebody in psychometrics already did it long before” law: http://www.stat.columbia.edu/∼cook/movabletype/archives/ 2009/01/a longstanding.html
R. Carroll, D. Ruppert, C. Crainiceanu, T. Tosteson, and M. Karagas. Nonlinear and nonparametric regression and instrumental variables. JASA, 99, 2004. J. Fan and Y. Truong. Nonparametric regression with errors-invariables. Annals of Statistics, 21:1900–1925, 1993. N. Friedman and I. Nachman. Gaussian process networks. Uncertainty in Artificial Intelligence, 2000. A. Gelman and D. Rubin. Inference from iterative simulation using multiple sequences. Statistical Science, 7:457–472, 1992. A. Gretton, K. Fukumizu, C. Teo, L. Song, B. Sch¨olkopf, and A. Smola. A kernel statistical test of independence. Neural Information Processing Systems, 2007.
D. Harrison and D. Rubinfeld. Hedonic prices and the demand for clean air. Journal of Environmental Economics & Management, 5:81–102, 1978. P. Hoyer, D. Janzing, J. Mooij, J. Peters, and B. Sch¨olkopf. Nonlinear causal discovery with additive noise models. Neural Information Processing Systems, 2008a. P. Hoyer, S. Shimizu, A. Kerminen, and M. Palviainen. Estimation of causal effects using linear non-Gaussian causal models with hidden variables. IJAR, 49, 2008b. J. Ko and D. Fox. GP-BayesFilters: Bayesian filtering using Gaussian process prediction and observation models. Autonomous Robots, 2009. N. D. Lawrence. Probabilistic non-linear principal component analysis with Gaussian process latent variable models. Journal of Machine Learning Research, 6:1783–1816, 2005. S.-Y. Lee. Structural Equation Modeling: a Bayesian Approach. Wiley, 2007. E. Masry. Deconvolving multivariate kernel density estimates from contaminated associated observations. IEEE Transactions on Information Theory, 49:2941–2952, 2003. J. Palomo, D. Dunson, and K. Bollen. Bayesian structural equation modeling. In Sik-Yum Lee (ed.), Handbook of Latent Variable and Related Models, pages 163–188, 2007. J. Pearl. Causality: Models, Reasoning and Inference. Cambridge University Press, 2000. C. Rasmussen and C. Williams. Gaussian Processes for Machine Learning. MIT Press, 2006. T. Santner, B. Williams, and W. Notz. The Design and Analysis of Computer Experiments. Springer-Verlag, 2003. M. Seeger. Low rank updates for the Cholesky decomposition. Technical Report, 2004. E. Segal, D. Pe’er, A. Regev, D. Koller, and N. Friedman. Learning module networks. JMLR, 6, 2005. R. Silva, R. Scheines, C. Glymour, and P. Spirtes. Learning the structure of linear latent variable models. JMLR, 7, 2006. E. Snelson and Z. Ghahramani. Sparse Gaussian processes using pseudo-inputs. NIPS, 18, 2006. P. Spirtes, C. Glymour, and R. Scheines. Causation, Prediction and Search. Cambridge University Press, 2000. M. Titsias. Variational learning of inducing variables in sparse Gaussian processes. AISTATS, 2009. M. Titsias, N. Lawrence, and M. Rattray. Efficient sampling for Gaussian process inference using control variables. Neural Information Processing Systems, 2009. F. Wood, T. Griffiths, and Z. Ghahramani. A non-parametric Bayesian method for inferring hidden causes. UAI, 2006. I. Yalcin and Y. Amemiya. Nonlinear factor analysis as a statistical method. Statistical Science, 16:275–294, 2001. H. Zou, T. Hastie, and R. Tibshirani. Sparse principal component analysis. J. of Comp. and Graph. Stats., pages 265–286, 2006.
APPENDIX A: FURTHER MCMC DETAILS We use a MCMC sampler to draw all variables of interest from the posterior distribution of a GPSEM model. Let M denote the
number of pseudo-inputs per latent function fi (·), N be the sample size, V the number of latent variables and K the common number of Gaussian mixture components for each exogenous latent variable. The sampler is a standard Metropolis-Hastings procedure with block sampling: random variables are divided into blocks, where we sample each block conditioning on the current values of the remaining blocks. We consider both the non-sparse and sparse variations of GPSEM. The blocks are as follows for the non-sparse GPSEM: • the linear coefficients for the structural equation of each observed variable Yj : {λj0 } ∪ Λj • the conditional variance for the structural equation of each observed variable Yj : υǫj (d)
• the d-th instantiation of each latent variable Xi , xi ; (1)
(N)
• the set of latent function values {fi , . . . , fi particular endogenous latent variable Xi
} for each
• the conditional variance for the structural equation of each latent variable Xi : υζi • the set of latent mixture component indicators (1) (N) {zi , . . . zi } for each particular exogenous latent variable Xi • the set of means {µi1 , . . . , µiK } for the mixture components of each particular exogenous latent variable Xi • the set of variances {vi1 , . . . , viK } for the mixture components of each particular exogenous latent variable Xi • mixture distribution πi corresponding to the probability over mixture components for exogenous latent variable Xi The blocks for the sparse model are similar, except that (d)
• all instantiations of a given latent variable xi , for d = 1, 2, . . . , N , are mutually independent conditioned on the functions, pseudo-inputs and pseudo-functions. As such, they can be treated as a single block of size N , where all elements are sampled in parallel; (d)
¯i • the d-th instantiation of each pseudo-input x 1, 2, . . . , M
for d =
• all instantiations of latent functions and pseudo-latents func(1) (N) (1) (M ) tions {fi , . . . , fi , f¯i , . . . , f¯i } for any particular Xi are conditionally multivariate Gaussian and can be sampled together We adopt the convention that, for any particular step described in the following procedure, any random variable that is not explicitly mentioned should be considered fixed at the current sampled value. Moreover, any density function that depends on such implicit variables uses the respective implicit values. Our implementation uses code for submatrix Cholesky updates from the library provided by Seeger (2004).
The measurement model can be integrated out in principle, if we adopt a conjugate normal-inverse gamma prior for the linear regression of observed variables Y on X. However, we opted for a non-conjugate prior in order to evaluate the convergence of the sampler when this marginalization cannot be done (as in alternative models with non-Gaussian error terms). Given the latent variables, the corresponding conditional distributions for the measurement model parameters boil down to standard Bayesian linear regression posteriors. In our MetropolisHastings scheme, our proposals correspond to such conditionals, as in Gibbs sampling (and therefore have an acceptance probability of 1). Let XPj be the parents of observed variable Yj in the graph and let the d-th instantiation of the corresponding regression input T T ˜ (d) be x Pj ≡ [xPj 1] . Let each cofficient λjk have an independent Gaussian prior with mean zero and variance u. Conditioned on the error variance υǫj , the posterior distribution of the vector [λj1 , . . . , λj|XPj | , λj0 ]T is multivariate Gaussian with covariance P P (d) −1 ˜ (d) ˜ (d)T ˜ (d) and mean Sj N Sj ≡ ( N Pj yj , Pj + I/u) Pj x d=1 x d=1 x where I is a (|XPj | + 1) × (|XPj | + 1) identity matrix. The derivation for the case where some coefficients λjk are fixed to constants is analogous. For a fixed set of linear coefficients {λj0 } ∪ Λj , we now sample the conditional variance υǫj . Let this variance have a inverse gamma prior (a, b). Its conditional distribution is an inverse P (d) gamma (a′ , b′ ), where a′ = a + N/2, b′ = b + N ej )2 /2, d=1 (ˆ (d)
and eˆj
(d)
≡ yj
(d)
− λj0 − ΛTj xPj .
The structural model: non-sparse GPSEM For all i = 1, 2, . . . , V and d = 1, 2, . . . , N , we propose each (d)′ new latent variable value xi individually, and accept or reject it based on a Gaussian random walk proposal centered at the current (d) value xi . We accept the move with probability ( ) (d)′ gXi (xi ) min 1, (d) gXi (xi )
(d)
= × ×
(d)
e−(xi Q
(d) 2
−fi
Xc ∈XCi
Q
Yc ∈XYi
) /(2υζ ) i
(d)
p(fc
(d) p(yc
|
(\d)
| fc
)
evaluated at yc , given its parents (which includes Xi ) and (implicit) measurement model parameters. This factor can be (d) dropped if yc is missing. If variable Xi is an exogenous variable, then the factor (d)
e−(xi
(d) 2
−fi
) /(2υζ ) i
e
gets substituted by
1 −2
(d)
xi
−µ
(d) iz i
!2
/v
iz
(d) i
(d)
where zi is the latent mixture indicator for the marginal mixture of Gaussians model for Xi , with means {µi1 , . . . , µiK } and variances {vi1 , . . . , viK }. (1)
(N)
Given all latent variables, latent function values {fi , . . . , fi are multivariate Gaussian with covariance matrix
}
Sfi ≡ (K−1 + I/υζi )−1 i where Ki is the corresponding kernel matrix and I is a N × N (1:N) identity matrix. The respective mean is given by Sfi xi /υζi , (1:N) (1) (N) T where xi ≡ [xi . . . xi ] . This operation costs O(N 3 ). We sample from this conditional as in a standard Gibbs update. Sampling each latent conditional variance υζi can also be done by sampling from its conditional. Let υζi have an inverse gamma prior (aζ , bζ ). The conditional distribution for this variance given all other random variables is inverse gamma (a′ζ , b′ζ ), where a′ζ = P (d) (d) aζ + N/2 and b′ζ = bζ + N − fi )2 /2. d=1 (xi
We are left with sampling the mixture model parameters that correspond to the marginal distributions of the exogenous latent variables. Once we condition on the latent variables, this is completely standard. If each mixture mean parameter µij is given an independent Gaussian prior with mean zero and variance vπ , its conditional given the remaining variables is also Gaussian with variance vπ′ ≡ 1/(1/vπ + |Zij |/vij ), where Zij is the subset of (d) 1, 2, . . . , N such that d ∈ Zij if and only if zi = j. The corre(d) ′ P sponding mean is given by vπ d∈Zij xi /vij . If each mixture variance parameter vij is given an inverse gamma prior (aπ , bπ ), its conditional is an inverse gamma (a′π , b′π ), where a′π = aπ + P (d) |Zij |/2, and b′π = bπ + d∈Zij (xi − µij )2 /2. The condi(d)
where, if Xi is not an exogenous variable in the graph, gXi (xi )
(d)
(d)
The measurement model
(4)
tional probability P (zi = j | everything else) is proportional PN −1/2 −(x(t) −µij )2 /(2vij ) to e i . Finally, given a Dirichlet t=1 vij prior distribution (α1 , . . . , αK ) for each πi , its conditional is also Dirichlet with parameter vector (α1 + |Zi1 |, . . . , αK + |ZiK |).
(d) X Pc )
Recall that fi (·) is a function of the parents XPi of Xi in the graph. The d-th instantiation of such parents assume the value (d) (d) (d) xPi . We use fi as a shorthand notation for fi (xPi ). Morever, let XCi denote the latent children of Xi in the graph. The symbol (\d) refers to the respective function values taken by fc in data fc (\d) (d) points {1, 2, . . . , d − 1, d + 1, . . . , N }. Function p(fc | fc ) (\d) (d) is the conditional density of fc given fc , according to the Gaussian process prior. The evaluation of this factor costs O(N 2 ) using standard submatrix Cholesky updates (Seeger, 2004). As such, sampling all latent values for Xi takes O(N 3 ). Finally, XYi denotes the observed children of Xi , and function (d) (d) p(yc | XPc ) is the corresponding density of observed child Yc
APPENDIX B: A NOTE ON DIRECTIONALITY DETECTION The assumption of linearity of the measurement model is not only a matter of convenience. In SEM applications, observed variables are carefully chosen to represent different aspects of latent concepts of interest and often have a single latent parent. As such, it is plausible that children of a particular latent variable are different noisy linear transformations of the target latent variable. This differs from other applications of latent variable Gaussian process models such as those introduced by Lawrence (2005), where measurements are not designed to explicitly account for target latent variables of interest. Moreover, this linearity condition has important implications on distinguishing among candidate models.
Implications for Model Selection We assumed that the DAG G is given. A detailed discussion of model selection is left as future work. Instead, we discuss some theoretical aspects of a very particular but important structural feature that will serve as a building block to more general model selection procedures, in the spirit of Hoyer et al. (2008a): determining sufficient conditions for the subproblem of detecting edge directionality from the data. Given a measurement model for two latent variables X1 and X2 , we need to establish conditions in which we can test whether the only correct latent structure is X1 → X2 , X2 → X1 , the disconnected structure, or either directionality. The results of Hoyer et al. (2008a) can be extended to the latent variable case by exploiting the conditions of identifiability discussed in Section 2.1 as follows. Our sufficient conditions are a weaker set of assumptions than that of Silva et al. (2006). We assume that X1 has at least two observable children which are not children of X2 and vice-versa. Call these sets {Y1 , Y1′ } and {Y2 , Y2′ }, respectively. Assume all error terms ({ǫi } ∪ {ζi }) are non-Gaussian11 . The variance of all error terms is assumed to be nonzero. As in Hoyer et al. (2008a), we also assume X1 and X2 are unconfounded. To test whether the model where X1 and X2 are independent becomes easy in this case: the independence model entails that (say) Y1 and Y2 are marginally independent. This can be tested using the nonparametric marginal independence test of Gretton et al. (2007). For the nontrivial case where latent variables are dependent, the results of Section 2.1 imply that the measurement model of {X1 → Y1 , X1 → Y1′ } is identifiable up to the scale and sign of the latent variables, including the marginal distributions of ǫ1 and ǫ1′ . An analogous result applies to {X2 , Y2 , Y2′ }. Since the measurement model {Y1 , Y1′ , Y2 , Y2′ } of {X1 , X2 } is identifiable, assume without loss of generality that the linear coefficients corresponding to X1 → Y1 and X2 → Y2 are fixed to 1, i.e., Y1 = X1 + ǫi and Y2 = X2 + ǫ2 . Also from Section 2.1, it follows that the distribution of {X1 , X2 } can be identified under very general conditions. The main result of Hoyer et al. (2008a) can then be directly applied. That is, data generated by a model X2 = f (X1 ) + η2 , with η2 being non-Gaussian and independent of X1 , cannot be represented by an analogous generative model X1 = g(X2 ) + η1 except in some particular cases that are ruled out as implausible.
Practical Testing The test for comparing X1 → X2 against X2 → X1 in Hoyer et al. (2008a) can be modified to our context as follows: we cannot regress X2 on X1 and estimate the residuals ζ2 since X1 and X2 are latent. However, we can do a error-in-variables regression of Y2 on Y1 using Y1′ and Y2′ as instrumental variables (Carroll et al., 2004): this means we find a function h(·) such that Y2 = h(X) + r and Y1 = X + w, for non-Gaussian latent variables r, w and X. We then calculate the estimated residuals r of this regression, and test whether such residuals are independent of Y1 (Gretton et al., 2007). If this is true, then we have no evidence to discard the hypothesis X1 → X2 . The justification for this process is that, if the true model is indeed X2 = f (X1 ) + η2 , then h(·) = f (·) and r = ǫ2 + η2 in the limit 11
Variations where ǫi and latent error terms are allowed to be Gaussian, as in our original model description are also possible and will be treated in the future.
of infinite data, since the error-in-variables regression model is identifiable in our case (Carroll et al., 2004), with X = X1 being a consequence of deconvolving Y1 and ǫ1 . By this result, r will be independent of Y1 . However, if the opposite holds (X1 ← X2 ) then, as in (Hoyer et al., 2008a), the residual is not in general independent of Y1 : given X1 (= X), there is a d-connecting path Y2 ← X2 → X1 ← η1 (Pearl, 2000), and r will be a function of η1 , which is dependent on Y1 . This is analogous to (Hoyer et al., 2008a), but using a different family of regression techniques. Error-in-variables regression is a special case of the Gaussian process SEM. The main practical difficulty on using GPSEM with the pseudo-inputs approximation in this case is that such pseudo-inputs formulation implies a heteroscedastic regression model (Snelson and Ghahramani, 2006). One has either to use the GPSEM formulation without pseudo-inputs, or a model linear in the parameters but with an explicit, finite, basis dictionary on the input space.