Generalized Exponential Distribution: Existing Results and Some Recent Developments Rameshwar D. Gupta1
Debasis Kundu2
Abstract Mudholkar and Srivastava [25] introduced three-parameter exponentiated Weibull distribution. Two-parameter exponentiated exponential or generalized exponential distribution is a particular member of the exponentiated Weibull distribution. Generalized exponential distribution has a right skewed unimodal density function and monotone hazard function similar to the density functions and hazard functions of the gamma and Weibull distributions. It is observed that it can be used quite effectively to analyze lifetime data in place of gamma, Weibull and log-normal distributions. The genesis of this model, several properties, different estimation procedures and their properties, estimation of the stress-strength parameter, closeness of this distribution to some of the well known distribution functions are discussed in this article.
Key Words and Phrases: Bayes estimator; Density function; Fisher Information; Hazard function; Maximum likelihood estimator; Order statistics; Stress-Strength model. AMS Subject Classifications 62E15,62E20,62E25,62A10,62A15. Short Running Title: Generalized Exponential Distribution 1
Department of Computer Science and Applied Statistics. The University of New Brunswick,
Saint John, Canada, E2L 4L5. Part of the work was supported by a grant from the Natural Sciences and Engineering Research Council. Corresponding author, e-mail:
[email protected]. 2
Department of Mathematics and Statistics, Indian Institute of Technology Kanpur, Pin
208016, India. E-mail:
[email protected] 1
1
Introduction
Certain cumulative distribution functions were used during the first half of the nineteenth century by Gompertz [6] and Verhulst [30, 31, 32] to compare known human mortality tables and represent mortality growth. One of them is as follows ³
G(t) = 1 − ρe−tλ
´α
;
for
t>
1 ln ρ, λ
(1)
here ρ, λ and α are all positive real numbers. In twentieth century, Ahuja and Nash [1] also considered this model and made some further generalization. The generalized exponential distribution or the exponentiated exponential distribution is defined as a particular case of the Gompertz-Verhulst distribution function (1), when ρ = 1. Therefore, X is a twoparameter generalized exponential random variable if it has the distribution function ³
F (x; α, λ) = 1 − e−λx
´α
;
x > 0,
(2)
for α, λ > 0. Here α and λ play the role of the shape and scale parameters respectively. The two-parameter generalized exponential distribution is a particular member of the three-parameter exponentiated Weibull distribution, introduced by Mudholkar and Srivastava [25]. Moreover, the exponentiated Weibull distribution is a special case of general class of exponentiated distributions proposed by Gupta et al. [7] as F (t) = [G(t)] α , where G(t) is the base line distribution function. It is observed by the authors [10] that the two-parameter generalized exponential distribution can be used quite effectively to analyze positive lifetime data, particularly, in place of the two-parameter gamma or two-parameter Weibull distributions. Moreover, when the shape parameter α = 1, it coincides with the one-parameter exponential distribution. Therefore, all the three distributions, namely generalized exponential, Weibull and gamma are all extensions/ generalizations of the one-parameter exponential distribution in different ways. 2
The generalized exponential distribution also has some nice physical interpretations. Consider a parallel system, consisting of n components, i.e., the system works, only when at least one of the n-components works. If the lifetime distributions of the components are independent identically distributed (i.i.d.) exponential random variables, then the lifetime distribution of the system becomes ³
F (x; n, λ) = 1 − e−λx
´n
;
x > 0,
(3)
for λ > 0. Clearly, (3) represents the generalized exponential distribution function with α = n. Therefore, contrary to the Weibull distribution function, which represents a series system, the generalized exponential distribution function represents a parallel system. In recent days, the generalization of pseudo random variable from any distribution function is very important for simulation purposes. Due to convenient form of the distribution function, the generalized exponential random variable can be easily generated. For exam³
1
ple, if U represents a uniform random variable from [0, 1], then X = − λ1 ln 1 − U α
´
has
generalized exponential distribution with the distribution function given by (2). Now a days all the scientific calculators or computers have standard uniform random number generator, therefore, generalized exponential random deviates can be easily generated from a standard uniform random number generator. The main aim of this paper is to provide a gentle introduction of the generalized exponential distribution and discuss some of its recent developments. This particular distribution has several advantages and it will give the practitioner one more option for analyzing skewed lifetime data. We believe, this article will help the practitioner to get the necessary background and the relevant references about this distribution. The rest of the paper is organized as follows. In section 2, we discuss different properties of this distribution function. The different estimation procedures, testing of hypotheses and 3
construction of confidence interval are discussed in section 3. Estimating the stress-strength parameter for generalized exponential distribution is discussed in section 4. Closeness of the generalized exponential distribution with some of the other well known distributions like, Weibull, gamma and log-normal are discussed in section 5 and finally we conclude the paper in section 6.
Properties
2 2.1
Density Function and its Moments Properties
If the random variable X has the distribution function (2), then it has the density function ³
f (x; α, λ) = αλ 1 − e−λx
´α−1
e−λx ;
x > 0,
(4)
for α, λ > 0. The authors provided the graphs of the generalized exponential density functions in [9] for different values of α. The density functions of the generalized exponential distribution can take different shapes. For α ≤ 1, it is a decreasing function and for α > 1, it is a unimodal, skewed, right tailed similar to the Weibull or gamma density function. It is observed that even for very large shape parameter, it is not symmetric. For λ = 1, the mode 1
is at log α for α > 1 and for α ≤ 1, the mode is at 0. It has the median at − ln(1 − (0.5) α ). The mean, median and mode are non-linear functions of the shape parameter and as the shape parameter goes to infinity all of them tend to infinity. For large values of α, the mean, median and mode are approximately equal to log α but they converge at different rates. The different moments of a generalized exponential distribution can be obtained using its moment generating function. If X follows GE(α, λ), then the moment generating function M (t) of X for t < λ, is M (t) = EetX =
³
Γ(α + 1)Γ 1 − ³
Γ α− 4
t λ
+1
t λ
´
´
.
(5)
Therefore, it immediately follows that E(X) =
1 [ψ(α + 1) − ψ(1)] , λ
V (X) =
1 0 [ψ (1) − ψ 0 (α + 1)] , 2 λ
(6)
where ψ(.) and its derivatives are the digamma and polygamma functions. The mean of a generalized exponential distribution is increasing to ∞ as α increases, for fixed λ. For fixed λ, the variance also increases and it increases to
π2 . 6λ
This feature is quite different
compared to gamma or Weibull distribution. In case of gamma distribution, the variance goes to infinity as the shape parameter increases, whereas for the Weibull distribution the variance is approximately
π2 6λα2
for large values of the shape parameter α.
Now we provide, see [9] for details, a stochastic representation of GE(α, 1) which also can be used to compute different moments of a generalized exponential distribution. If α is a positive integer say n, then the distribution of X is same as the distribution of
Pn
j=1
Yj /j,
where Yj ’s are i.i.d. exponential random variables with mean 1. If α is not an integer, then the distribution of X is same as [α] X
Yj + Z. j=1 j+ < α > Here < α > represents the fractional part and [α] denotes the integer part of α. The random variable Z follows GE(< α >, 1), which is independent of Yj ’s. Next we discuss about the skewness and kurtosis of the generalized exponential distribution. The skewness and kurtosis can be computed as q
β1 =
µ3 3/2 µ2
,
β2 =
µ4 , µ22
(7)
where µ2 , µ3 and µ4 are the second, third and fourth moments respectively and they can be represented in terms of the digamma and polygamma functions. µ2 =
i 1 h 0 0 2 ψ (1) − ψ (α + 1) + (ψ(α + 1) − ψ(1)) λ2
5
1 0.8 0.6 0.4
α = 50.0
α = 2.50
0.2
α = 1.00
0 −0.2 −0.4
α = 0.75
−0.6
α = 0.25
−0.8 −1
0
0.2
0.4
0.6
0.8
1
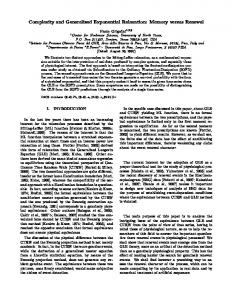
Figure 1: MacGillivray skewness functions of the generalized exponential distribution 1 λ3 1 = λ4
µ3 = µ4
h
ψ 00 (α + 1) − ψ 00 (1) + 3(ψ(α + 1) − ψ(1))(ψ 0 (1) − ψ 0 (α + 1)) + (ψ(α + 1) − ψ(1))3
h
i
ψ 000 (1) − ψ 000 (α + 1) + 3(ψ 0 (1) − ψ 0 (α + 1))2 + 4(ψ(α + 1) − ψ(1))(ψ 00 (α + 1) − ψ 00 (1) i
+6(ψ(α + 1) − ψ(1))2 (ψ 0 (1) − ψ 0 (α + 1)) + (ψ 000 (1) − ψ 000 (α + 1))4 . The skewness and kurtosis are both independent of the scale parameter. It is numerically observed that both skewness and kurtosis are decreasing functions of α, moreover, the limiting value of the skewness is approximately 1.139547. The generalized exponential distribution has the MacGillivray [24] skewness function as γX (u; α) =
ln(1 − u1/α ) + ln(1 − (1 − u1/α )) − 2 ln(1 − ln(1 −
u1/α )
− ln(1 − (1 −
u1/α ))
³ ´1/α 1 2
)
.
(8)
The plots of the skewness functions (8) of the generalized exponential distribution for different values of α are presented in Figure 1. From the Figure 1 it is clear that the skewness does not change significantly for large values of α. It is observed numerically that the Galton [5]’s measure of skewness, namely γX (3/4, α), converges to 0.119 as α increases to ∞.
6
2.2
Hazard Function and Reversed Hazard Function
The hazard function of the generalized exponential distribution is ´α−1
³
αλe−λx 1 − e−λx f (x; α, λ) h(x; α, λ) = = 1 − F (x; α, λ) 1 − (1 − e−λx )α
.
(9)
Since λ is the scale parameter, the shape of the hazard function does not depend on λ, it depends only on α. For any fixed λ, the generalized exponential distribution has an increasing hazard function for α > 1 and it has a decreasing hazard function for α < 1. For α = 1, it has constant hazard function. These results are not very difficult to prove, it simply follows from the fact that the generalized exponential distribution has a log-concave density for α > 1 and it is log-convex for α ≤ 1. The plots of the hazard functions for different values of α can be obtained as in Gupta and Kundu [9]. The hazard function of the generalized exponential distribution behaves exactly the same way as the hazard functions of the gamma distribution, which is quite different from the hazard function of the Weibull distribution, see Gupta and Kundu [9] for details. The reversed hazard function becomes quite popular in the recent time. The reversed hazard function for the generalized exponential distribution is r(x; α, λ) =
f (x; α, λ) αλe−λx = . F (x; α, λ) 1 − e−λx
(10)
It is observed that for all values of α, the reversed hazard function is a decreasing function of x. Several other properties of the reversed hazard function of the generalized exponential distribution are obtained in Nanda and Gupta [26]. Note that
λe−λx 1−e−λx
is the reversed hazard
function of the exponential distribution, therefore, from (10) it is clear that the reversed hazard function of the generalized exponential distribution is proportional to the reversed hazard function of the exponential distribution. The hazard function and the reversed hazard function can be used to compute the Fisher information matrix of the unknown parameters, 7
see for example Efron and Johnstone [4] and Gupta, Gupta and Sankaran [8]. For the generalized exponential distribution, r(x; α, λ) is in a convenient form and it can easily be used to compute Fisher information matrix, see [16].
2.3
Order Statistics and Records
Let X1 , . . . , Xn be i.i.d. generalized exponential random variables, with the shape parameter α and scale parameter 1. Further, let X(1) < . . . < X(n) be the order statistics from these n random variables. Then the density function of the largest order statistics X (n) is ³
fX(n) (x; α) = nαe−x 1 − e−x
´nα−1
.
(11)
Therefore, X(n) also has the generalized exponential distribution with shape and scale parameters as nα and 1 respectively. Note that the general class of exponentiated distributions as introduced by Gupta et al. [7] is also closed under maximum. The result can be stated as follows: If X1 , . . . , Xn are i.i.d. random variables then Xi ’s are exponentiated random variables if and only if the maximum of {X1 , . . . , Xn } is an exponentiated random variable. The proof follows easily from [9]. Raqab and Ahsanullah [29] considered different order statistics of the generalized exponential distribution. The moment generating functions of the different order statistics and the product moments can be obtained in Raqab and Ahsanullah [29]. They tabulated different product moments and used them to compute the best linear unbiased estimators of the location and scale parameters of the generalized exponential distribution. In the context of order statistics and reliability theory, the life length of the r-out-of-n system is the (n − r + 1)-th order statistics in a sample of size n. Another related model is the model of record statistics defined by Chandler [2] as a model for successive extremes in a sequence of i.i.d. random variables. Raqab [28] considered the three parameter (including 8
the location) generalized exponential distribution and obtained the best linear unbiased estimators of the location and scale parameters using the moments of the records statistics.
2.4
Distribution of the Sum
Since the moment generating function of the generalized exponential distribution is not in a very convenient form, the distribution of the sum of n i.i.d. generalized exponential random variables can not be obtained very easily. It is observed that if X follows GE(α, 1), then e −X has a Beta distribution. Since the product of independent Beta random variables has been well studied in the literature, it is used effectively to compute the distribution of sum of the n i.i.d. generalized exponential random variables. It is observed in [9] that the distribution of the sum of n i.i.d. generalized exponential random variables can be written as the infinite mixture of generalized exponential distributions. The exact mixing coefficients and the parameters of the corresponding generalized exponential distributions can be obtained in [9].
3 3.1 3.1.1
Inference Classical Estimation Procedures Maximum Likelihood Estimators
If {x1 , . . . , xn } is a random sample from a GE(α, λ), then the log-likelihood function, L(α, λ) is L(α, λ) = n ln α + n ln λ + (α − 1)
9
n X i=1
³
´
ln 1 − e−λxi − λ
n X i=1
xi .
(12)
The maximum likelihood estimator (MLE) of α as a function of λ, say α ˆ (λ), can be obtained as n . −λxi ) i=1 ln (1 − e
α ˆ (λ) = − Pn
(13)
The MLE of λ can be obtained by maximizing the profile log-likelihood function with respect to λ. It is observed in Gupta and Kundu [12] that the profile likelihood function of λ is a unimodal function and its maximum can be easily obtained by using a very simple iterative procedure. 3.1.2
Method of Moments Estimators
The moment estimators of α and λ can be obtained by equating the first two population moments with the corresponding sample moments. It follows that the coefficient of variation (C.V.) is independent of the scale parameter. Therefore, equating the sample C.V. with the population C.V., namely S ¯ = X
q
ψ 0 (1) − ψ 0 (α + 1)
ψ(α + 1) − ψ(1)
,
(14)
the moment estimator of α can be obtained. The non-linear equation (14) needs to be solved iteratively to obtain the moment estimator of α. Extensive tables are available in Gupta and Kundu [12], which can be used for an efficient initial guess of any iterative procedure. Once, the moment estimator of α is obtained, the moment estimator of λ can be easily obtained. 3.1.3
Percentile Estimators
The generalized exponential distribution has the explicit distribution function, therefore in this case the unknown parameters α and λ can be estimated by equating the sample percentile points with the population percentile points and it is known as the percentile method. If pi denotes an estimate of F (x(i) ; α, λ), then the percentile estimators of α and λ
10
can be obtained by minimizing n · X i=1
1 (1) x(i) + ln 1 − pi α λ µ
¶¸2
,
(15)
with respect to α and λ. Here x(i) ’s are ordered sample and the maximization has to be performed iteratively. It is possible to use several estimators of pi ’s. For example, pi = i/(n + 1) is the most used estimator as it is an unbiased estimator of F (x(i) ; α, λ). Some other choices of pi ’s are ((i − 3/8))/(n + (1/4)) and ((i − (1/2))/n). 3.1.4
Least Squares Estimators
The least squares estimators and the weighted least squares estimators of α and λ can be obtained by minimizing n µ³ X
j=1
1−e
´ −λx(j) α
j − n+1
¶2
and
n X
j=1
respectively, with respect to α and λ, here wj =
wj
µ³
1−e
(n+1)2 (n+2) . j(n−j+1)
´ −λx(j) α
j − n+1
¶2
,
(16)
The motivation behind the
least squares and the weighted least squares estimators mainly follow from the following observations. If Y1 , . . . , Yn is a random sample from the distribution function G(.) and if Y(1) < . . . < Y(n) denote the corresponding order statistics, then E(G(Y(j) ), V (G(Y(j) ) and Cov(G(Y(j) ), G(Y(k) )) are all independent of the unknown parameters. Since for the generalized exponential distribution, the distribution function has a very convenient form, the least squares and the weighted least squares methods can be used quite effectively to compute the estimators of the unknown parameters, see Gupta and Kundu [11] for details. 3.1.5
L-Moment Estimators
The L-moment estimators analogous to the conventional moment estimators but they can be obtained by linear combinations of the order statistics, i.e. by L-statistics, see for example Hosking [17]. The L-moments have theoretical advantages over the conventional moments of 11
being more robust to the presence of outliers in the data. Similar to the moment estimators, the L-moment estimators can also be obtained by equating the population L-moments with the corresponding sample L-moments. In case of generalized exponential distribution, the two sample L-moments are l1 =
n 1X x(i) , n i=1
l2 =
n X 2 (i − 1)x(i) − l1 , n(n − 1) i=1
(17)
and the first two population L-moments are λ1 =
1 [ψ(α + 1) − ψ(1)] , λ
λ2 =
1 [ψ(2α + 1) − ψ(α + 1)] , λ
(18)
respectively, see Gupta and Kundu [11]. The L-moment estimator of α can be obtained by solving the non-linear equation ψ(2α + 1) − ψ(α + 1) l2 = . ψ(α + 1) − ψ(1) l1
(19)
Once the L-moment estimator of α is obtained, the L-moment estimator of λ can be easily obtained, the details are available in Gupta and Kundu [11]. It is not possible to compare theoretically the performances of the different estimators. Due to that the authors performed [11] extensive simulations to compare the performances of the different estimators for different sample sizes and for different parameter values in terms of biases and mean squared errors. It is observed that for large sample sizes all the estimators behave more or less in similar manner. For small sample sizes the performances of the maximum likelihood estimators and the L-moment estimators are better than the rest. For large values of α, the performances of the L-moment estimators are marginally better than the maximum likelihood estimators.
3.2
Confidence Intervals and Testing of Hypotheses
It is well known that the construction of confidence intervals and testing of hypotheses are equivalent problems and therefore we discuss both the problems together. First let us con12
sider the asymptotic distribution of the maximum likelihood estimators of the unknown parameters. For α, λ > 0, the generalized exponential family satisfies all the regularity conditions, therefore the following result easily follows from the standard asymptotic dis´ √ ³ ˆ M LE − λ , is tribution results of the maximum likelihood estimators, i.e., n α ˆ M LE − α, λ asymptotically bivariate normally distributed with the mean vector 0. The exact expression
of the asymptotic dispersion matrix is obtained in Gupta and Kundu [11] In this case the asymptotic distribution of the moment estimators also can be obtained. If ³ ´ ˆM E − λ , ˆ M E are the moment estimators of α and λ respectively, then √n α ˆ M E − α, λ α ˆ M E and λ is asymptotically bivariate normally distributed with the mean vector 0 and the exact expres-
sion of the asymptotic dispersion matrix as given in Gupta and Kundu [11]. Therefore, the asymptotic distributions of the maximum likelihood estimators or the moment estimators can be used for constructing asymptotic confidence intervals. No comparison of the different confidence intervals are available in the literature. More work is needed in that direction. Now we consider the following testing of hypotheses problems when both the parameters are unknown. Problem 1: H0 : α = α0
vs H1 : α 6= α0 .
Problem 2: H0 : λ = λ0
vs H1 : λ 6= λ0 .
Problem 3: H0 : α = α0 , λ = λ0
vs H1 : at least one is not true
Note that in Problem 1, when α0 = 1, it tests exponentiality. It is an important problem in practice. The likelihood ratio test can be used in all the cases and the asymptotic distributions have been used for computing the critical points. Graphical techniques have been used in Gupta and Kundu [12] for constructing confidence intervals/ regions for the ³
´
unknown parameters when both the parameters are unknown. Since − ln 1 − e−λX has an exponential distribution with hazard rate α, the usual inference procedure for the parameter of the exponential distribution can be used when the scale parameter is known.
13
3.3
Bayesian Inference
In the last couple of years although significant amount of work has been developed in the classical set up, not much work except the recent related work of Nassar and Eissa [27] and Kundu and Gupta [20] has been found in the Bayesian framework. When both the parameters are unknown, it is quite natural to assume independent gamma priors on both the shape and scale parameters. It is observed that in this case, the problem becomes quite intractable analytically and it has to be solved numerically. Mainly two approaches have been used to solve this problem (a) Lindley’s approximation method, (b) Markov Chain Monte Carlo Method (MCMC). Lindley [23] developed his procedure to approximate the ratio of two integrals. It has been used quite extensively to compute different Bayes estimators in different cases. In case of generalized exponential distribution, Lindley’s approximation method can be used to compute the approximate Bayes estimates of α and λ for different loss functions. The exact expressions of the approximate Bayes estimates, both under squared errors and LINUX loss functions can be obtained as in Kundu and Gupta [20]. It is observed that the posterior density function of the shape parameter given the scale parameter follows a gamma distribution. Also, the posterior density function of the scale parameter given the shape parameter is log-concave. Therefore, MCMC method has been used quite effectively to generate posterior samples and in turn compute the Bayes estimates and construct the highest posterior density (HPD) credible intervals of the unknown parameters. When scale parameter is known, the explicit expression of the Bayes estimate of the shape parameter can be obtained and the corresponding HPD credible interval also can be constructed. If the shape parameter is known, then Lindley’s approximation and MCMC methods have been used to compute the Bayes estimate of the scale parameter, see Kundu and Gupta [20] for details. 14
4
Inference for Stress-Strength Parameter
In this section inference for R = P (Y < X) is considered when X and Y are independent generalized exponential distributions. In the statistical literature R is known as the stressstrength parameter and it has received significant attention in the last few decades. Nonparametric and parametric inferences on R for several specific distributions of X and Y have been found in the literature. For an excellent account of all these methods the readers are referred to the recent monograph of Kotz, Lumelskii and Pensky [18]. Recently authors [20] developed the inference procedures on R both under classical and Bayesian frame work, when X and Y are independent generalized exponential distributions. The problem can be stated as follows. Suppose {X1 , . . . Xn } and {Y1 , . . . Ym } are random samples from the distribution functions of X and Y respectively, we want to draw the statistical inference on R based on these samples.
4.1
Two Scale Parameters are Equal
Suppose X and Y are independent random variables with distribution functions [G(x; λ)] α1 and [G(x; λ)]α2 , respectively, where G(x; λ) is any base line distribution. Then R = P (Y < X) =
α1 . α1 + α 2
(20)
Interestingly, R is independent of the base line distribution G(.; λ). If λ is known, the inference on R can be carried out by data transformation to the exponential case as mentioned in section 3.2. However, if λ is unknown, to compute the MLE of R we need the MLE of λ which has to be obtained from {X1 , . . . Xn } and {Y1 , . . . Ym }. In the case of generalized exponential distribution, the MLE of λ can be computed by solving a non-linear equation. A simple fixed point-type algorithm has been proposed by the authors [19] and it works quite effectively even for small sample sizes. Once the MLE of λ is obtained, the MLEs of α1 and 15
α2 can be obtained in explicit forms in terms of MLE of λ, same as provided in (13), see [19] for details. It is observed that the asymptotic distribution of R is asymptotically normally distributed and the explicit expression of the asymptotic variance can be found as in [19]. The asymptotic distribution can be used to construct the asymptotic confidence interval of R.
4.2
Two Scale Parameters are Different
In this case the problem becomes quite different. Let us assume that X and Y follow GE(α1 , λ1 ) and GE(α2 , λ2 ) respectively. Unfortunately R = P (Y < X) can not be expressed in a compact form. It has the following form; R=
Z
∞ 0
³
1 − e−λ2 x
´ α2
³
α1 λ1 e−λ1 x 1 − e−λ1 x
´α1 −1
dx =
Z
1 0
1 −
µ
1−u
1 α1
¶ λ2 λ1
α2
du. (21)
Since the explicit expression of R is not available the computation of the MLE of R becomes quite difficult. One of the method which can be used to compute the MLE of R by plug-in estimates, i.e. replacing right hand side of (21) by the corresponding MLEs of the different unknown parameters and computing the integration numerically. The asymptotic distributions of the MLEs of the unknown parameters are known, therefore the asymptotic distribution of the MLE of R can be obtained by the δ-method and the corresponding confidence interval can be constructed at least numerically. Although the explicit expression of R can not be obtained for general α1 and α2 , but if α2 is an integer, R can be expressed as R = α1 Γ(α1 )
à ! α2 X α2 i=0
i
Γ
³
iλ2 λ1
(−1)i ³ Γ α1 +
+1 iλ2 λ1
´
+1
´.
(22)
Moreover, since R is a decreasing function of α2 , from (22) it easily follows, that for general α2 α1 Γ(α1 )
α 2U X i=0
Ã
³
´
³
´
2 2 α 2L Γ iλ +1 Γ iλ +1 X α2 α2 λ1 λ1 i ³ i ³ ´ ≤ R ≤ α1 Γ(α1 ) ´, (−1) (−1) iλ2 2 i i Γ α1 + iλ Γ α + + 1 + 1 i=0 1 λ1 λ1
!
Ã
16
!
where α2U (α2L ) is the smallest (largest) integer greater (smaller) than α2 . If α1 is an integer then also similar bounds can be obtained by considering 1 − R instead of R.
Closeness with Other Distributions
5
The generalized exponential distribution was originally introduced as an alternative to the gamma and Weibull distributions. In fact it has been observed that in many situations, the generalized exponential distribution can be used quite effectively in analyzing positive data in place of gamma, Weibull or log-normal distributions.
5.1
Closeness
In a series of papers [13, 14, 15, 21] the authors studied the closeness of the generalized exponential distribution with Weibull, gamma and log-normal distributions. It is observed that for certain ranges of the shape parameters the distance between the generalized exponential distribution and the other three distributions can be very small, see for example Fig 1 of [21]. It raises two important questions; (a) for a given data set which distribution is preferable? (b) what is the minimum sample size needed to discriminate between the two fitted distribution functions? The first problem is a classical problem in the statistical data analysis. Cox [3] has first proposed the likelihood ratio test to discriminate between two distribution functions and since then a significant amount of research has been done to discriminate between two specific distribution functions. Unfortunately, a general theory is very difficult to establish, therefore, specific test needs to be constructed for any two particular distribution functions. It is observed that the likelihood ratio test statistics for testing between GE and other distribution functions are asymptotically normal and the details are available in [13, 15, 21]. Using the
17
asymptotic distributions, the asymptotic critical regions and the asymptotic powers can be easily obtained.
5.2
Sample Size
Now let us look at the second question about the minimum sample size needed to discriminate between the two fitted distribution functions. This is an important question because although asymptotically the two fitted distribution functions are always distinguishable, but for finite sample it may be difficult to discriminate between the two. Intuitively, it is clear that if the two distribution functions are very close, one needs a very large sample size to discriminate between the two. On the other hand if two distribution functions are quite different then one may not need very large sample size to discriminate between the two. Moreover, if two distribution functions are very close to each other, then one may not need to differentiate between the two from a practical point of view, see for details in [13]. Therefore, it is expected that the user will specify the tolerance limit in terms of the distance between the two distribution functions. The tolerance limit simply indicates that the user does not want to make the distinction between the two distribution functions if their distance is less than the tolerance limit. For the user specified tolerance limit the minimum sample required to discriminate between generalized exponential distribution and the other distributions have been provided in [13, 15, 21] for the given probability of correct selection.
5.3
Generating Data
Since the distribution functions of the generalized exponential distribution and gamma or log-normal can be very close, this property can be exploited to generate gamma or normal random variables using the generalized exponential distribution. The gamma or normal distribution functions do not have explicit inverse functions, therefore, specific algorithms 18
are needed to generate gamma or normal random numbers. It is observed [14] that for the gamma distribution if the shape parameter is less than 2.5, then it can be generated quite effectively using generalized exponential distribution. The exact values of the corresponding shape and scale parameters of the generalized exponential distribution are available in [14]. In Fig. 1 of [21] it can be seen that the distribution functions of the GE(12.9,1) and lognormal distribution function with the shape and scale parameters as 0.3807482 and 2.9508672 respectively are indistinguishable. Therefore, log-normal distribution with the corresponding shape and scale parameters can be generated from the above generalized exponential distribution. In [22] normal random numbers have been generated using the generalized exponential distribution. Extensive simulations justified that this simple procedure is very effective for generating normal random number. Moreover, it is also observed that the standard normal distribution function can be approximated very well ( up to third digit) by the generalized exponential distribution function as follows: ³
Φ(z) ≈ 1 − e−e
1.0792510+0.3820198z
´12.8
.
(23)
Note that even simple hand calculator can be used to compute (23).
5.4
Comparison of Fisher Information
Very recently, the authors [16] compared in detail the Fisher information of the Weibull and generalized exponential distributions for both complete and censored samples. Interestingly, it is observed that even though the two distribution functions can be quite close, their Fisher information matrices can be quite different. The Fisher information matrices are compared using the determinants and traces and it is observed that for certain ranges of the shape parameter Weibull model has more Fisher information than the generalized exponential model and vice versa. The information losses due to truncation for the two models are critically
19
examined theoretically as well as numerically. The authors compared the Fisher information at the different percentile points which was used for model discrimination purposes also.
6
Conclusions
In this article we provide an introduction of this relatively new generalized exponential distribution. Although this is a particular member of a more general exponentiated model, it is observed that this two-parameter model is quite flexible and can be used quite effectively in analyzing positive lifetime data in place of well known gamma, Weibull or log-normal model. Some of the salient features of the generalized exponential distributions are as follows. This particular distribution has several properties which are quite close to the gamma distribution. Although, gamma distribution enjoys several nice theoretical properties, due to its intractable distribution function it is quite difficult to use for data analysis purposes. In real life wherever gamma distribution has been used we believe that the generalized exponential distribution also can be used. Because of its tractable distribution function, it can be easily generated and if the data are censored this model can be used quite effectively. The different Fisher information matrices for censored samples are available in [12, 33], although not much development has taken place for censored data. Moreover, the introduction of location parameter is also possible, see [9], but not much work has been done regarding the three-parameter generalized exponential distribution, more work is needed along these directions.
Acknowledgments The authors would like to thank the referees and the Guest editor Professor G. S. Mudholkar for carefully reading the paper and for their help in improving the paper.
20
References [1] Ahuja, J. C. and Nash, S. W. (1967), “The generalized Gompertz-Verhulst family of distributions”, Sankhya, Ser. A., vol. 29, 141 - 156. [2] Chandler, K. N. (1952), “The distribution and frequency of records”, Journal of the Royal Statistical Society, Ser. B, vol. 14, 220 - 228. [3] Cox, D. R (1961), “Tests of separate families of hypotheses”, Proceedings of the Fourth Berkeley Symposium in Mathematical Statistics and Probability, University of California Press, 105 -123. [4] Efron, B. and Johnstone, I. (1990), “Fisher information in terms of the hazard rate”, Annals of Statistics, vol. 18, 38 - 62. [5] Galton, F. (1889), Natural Inheritance, MacMillan, London. [6] Gompertz, B. (1825), “On the nature of the function expressive of the law of human mortality, and on a new mode of determining the value of life contingencies”, Philosophical Transactions of the Royal Society London, vol. 115, 513 - 585. [7] Gupta, R. C., Gupta, P. L. and Gupta, R. D. (1998), “Modeling failure time data by Lehmann alternatives”, Communications in Statistics - Theorey and Methods, vol. 27, 887 - 904. [8] Gupta, R. D., Gupta, R. C. and Sankaran, P. G. (2004), “Some characterization results based on the (reversed) hazard rate function”, Communications in Statistics - Theory and Methods, vol. 33, no. 12, 3009 - 3031. [9] Gupta, R. D. and Kundu, D. (1999). “Generalized exponential distributions”, Australian and New Zealand Journal of Statistics, vol. 41, 173 - 188.
21
[10] Gupta, R. D. and Kundu, D. (2001a), “Exponentiated exponential family; an alternative to gamma and Weibull”, Biometrical Journal, vol. 43, 117 - 130. [11] Gupta, R. D. and Kundu, D. (2001b), “Generalized exponential distributions: different methods of estimation”, Journal of Statistical Computation and Simulation. vol. 69, 315 - 338. [12] Gupta, R. D. and Kundu, D. (2002), “Generalized exponential distributions: statistical inferences”, Journal of Statistical Theory and Applications, vol. 1, 101 118. [13] Gupta, R. D. and Kundu, D. (2003a), “Discriminating between the Weibull and the GE distributions”, Computational Statistics and Data Analysis, vol. 43, 179 196. [14] Gupta, R. D. and Kundu, D. (2003b), “Closeness of gamma and generalized exponential distribution”, Communications in Statistics - Theory and Methods, vol. 32, no. 4, 705-721. [15] Gupta, R. D. and Kundu, D. (2004), “Discriminating between gamma and generalized exponential distributions”, Journal of Statistical Computation and Simulation, vol. 74, no. 2, 107-121. [16] Gupta, R. D. and Kundu, D. (2005), “Comparison of the Fisher information between the Weibull and generalized exponential distribution”, (to appear in the Journal of Statistical Planning and Inference) [17] Hosking, J.R.M. (1990), “L-moment: analysis and estimation of distributions using linear combinations of order statistics”, Journal of the Royal Statistical Society, Ser B, vol. 52, no. 1, 105-124.
22
[18] Kotz, S., Lumelskii, Y. and Pensky, M. (2003), The Stress-Strength Model and its Generalizations - Theory and Applications, World Scientific, New York. [19] Kundu, D. and Gupta, R D. (2005), “Estimation of P (Y < X) for generalized exponential distribution”, Metrika, vol. 61, 291 - 308. [20] Kundu, D. and Gupta, R D. (2005), “Bayesian estimation for the generalized exponential distribution”, submitted. [21] Kundu, D., Gupta, R D. and Manglick, A. (2005),“Discriminating between the lognormal and generalized exponential distribution”, Journal of the Statistical Planning and Inference, vol. 127, 213 - 227. [22] Kundu, D., Gupta, R D. and Manglick, A. (2005), “A convenient way of generating normal random variables using generalized exponential distribution”, (to appear in the Journal of the Modern Applied Statistical Methods). [23] Lindley, D. V. (1980), “Approximate Bayesian method”, Trabajos de Estadistica, vol. 31, 223 - 237. [24] MacGillivray, H.L. (1986), “Skewness and asymmetry: measures and orderings”, Annals of Statistics, vol. 14, 994 - 1011. [25] Mudholkar, G. S. and Srivastava, D. K. (1993), “Exponentiated Weibull family for analyzing bathtub failure data”, IEEE Transactions on Reliability, vol. 42, 299 302. [26] Nanda, A. K. and Gupta, R. D. (2001), “Some properties of reversed hazard function”, Statistical Methods, vol 3, 108 - 124.
23
[27] Nassar, M. M. and Eissa, F. L. (2004), “Bayesian estimation for the exponentiated Weibull model”, Communications in Statistics - Theory and Methods, vol. 33, 2343 - 2362. [28] Raqab, M. Z. (2002), “Inferences for generalized exponential distribution based on record statistics”, Journal of Statistical Planning and Inference, vol. 104, 339 - 350. [29] Raqab, M. Z. and Ahsanullah, M. (2001), “Estimation of the location and scale parameters of generalized exponential distribution based on order statistics”, Journal of Statistical Computation and Simulation, vol. 69, 109 - 124. [30] Verhulst, P. F. (1838), “Notice sur la loi la population suit dans son accroissement”, Correspondence mathematique et physique, publiee L. A. J. Quetelet, vol. 10, 113 121. [31] Verhulst, P. F. (1845), “Recherches mathematiques sur la loi-d’-accroissement de la population”, Nouvelles Memoires de l’Academie Royale des Sciencs et BellesLettres de Bruxelles [i.e. Memoires, Series 2], vol. 18, 38 pp. [32] Verhulst, P. F. (1847), “Deuxieme memoire sur la loi d’accroissement de la population”, Memoires de l’Academie Royale des Sciences, des Lettres et des Beaux-Arts de Belgique, Series 2, vol. 20, 32 pp. [33] Zheng, G. (2002), “Fisher information matrix in type -II censored data from exponentiated exponential family”, Biometrical Journal, vol. 44, 353 - 357.
24