Feb 18, 2007 - test whether the current model fits a set of real data better than other models. ... censored data by Seo and Yum [14] and Chen and Mi [4], ...
Estimation of the Generalized Rayleigh Distribution Parameters A. Al-khedhairi
A. Sarhan
L. Tadj
King Saud University, College of Science Department of Statistics and Operations Research P.O. Box 2455, Riyadh 11451, Saudi Arabia. email: [akhediri, asarhan, lotftadj]@ksu.edu.sa February 18, 2007
Abstract This paper presents estimations of the generalized Rayleigh distribution model based on grouped and censored data. The maximum likelihood method is used to derive point and asymptotic confidence estimates of the unknown parameters. The results obtained in this paper generalize some of those available in the literature. Finally, we test whether the current model fits a set of real data better than other models. Keywords: Estimation.
1
Introduction
The problem of estimating the unknown parameters in statistical distributions used to study a certain phenomenon is one of the important problems facing constantly those who are interested in applied statistics. This paper considers the estimations of the unknown parameters of the generalized Rayleigh distribution. This distribution is an important distribution in statistics and operations research. It is applied in several areas such as health, agriculture, biology, and other sciences. There are several types of data that arise in every day life. Among these, there are simple data, grouped data, truncated data, censored data, progressively censored data, and so on. The exponential distribution is one of the most frequently used distribution in reliability theory and applications. This is because it has simple mathematical expressions. The mean 1
Estimation of the Generalized Rayleigh Distribution Parameters
and its confidence limit for this distribution have been estimated based on grouped and censored data by Seo and Yum [14] and Chen and Mi [4], respectively. Nevertheless, the exponential distribution does not always fit well a given set of real data. The reason is that it has a constant failure rate. Abuammoh and Sarhan [1] used grouped and censored data to estimate the parameters of the generalized exponential distribution. They found that it fits a set of real data better than the exponential distribution. Other distributions have been used in reliability theory. Some were taken from the twelve different forms of distributions introduced by Burr [3] to model data. Among those different distributions, Burr-Type X and Burr-Type XII received the most attention. There is a thorough analysis of Burr-Type XII distribution in Rodriguez [12], see also Wingo [17] for a nice account of it. The two-parameter (scale and shape) Burr-Type X distribution is also called generalized Rayleigh distribution. Several aspects of the one-parameter (scale parameter equals one) generalized Rayleigh distribution were studied by Sartawi and Abu-Salih [13], Jaheen [5, 6], Ahmad et al. [2], Raqab [10] and Surles and Padgett [15]. Recently Surles and Padgett [16] observed that the two-parameter generalized Rayleigh distribution can be used quite effectively in modelling strength and general lifetime data. Kundu and Raqab [7] used different methods to estimate the parameters of the generalized Rayleigh on simple data. Our aim in this paper is to estimate the unknown parameters of the generalized Rayleigh distribution based on grouped and censored data. The maximum likelihood method is used to derive point and asymptotic confidence estimates of the unknown parameters. The results obtained in this paper generalize some of those available in the literature. Finally, we test whether the current model fits a set of real data better than other models. The rest of the paper is organized as follows. In Section 2, we present the definition and some characteristics of the generalized Rayleigh distribution. Point and interval estimations of the unknown parameters are discussed in Section 3. In Section 4 an illustrative example is presented to explain how the generalized Rayleigh distribution fits a set of real data better than other distributions.
2
3
Estimation of the Generalized Rayleigh Distribution Parameters
2
The Distribution
Let T be a random variable with scale parameter α > 0 and shape parameter β > 0. Setting θ = (α, β), the cumulative distribution function of T is given by ³ ´α −βt2 F (t; θ) = 1 − e ,
t ≥ 0.
The distribution of T is the so-called generalized Rayleigh distribution. Its survival function is given by
³
−βt2
S(t; θ) = 1 − 1 − e
´α
,
t ≥ 0,
(2.1)
while the probability density function (pdf) is given by 2
f (t; θ) = 2αβte−βt
³
1 − e−βt
2
´α−1
,
t ≥ 0.
(2.2)
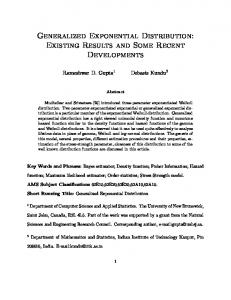
Figure 1 shows the variations of the pdf for β = 1 and α = 0.25 (left) and α = 1 (right). a− α=0.25, β=1
b− α=1, β=1
1.6
0.9
1.4
0.8
0.7 1.2 0.6
f(t;α,β)
f(t;α,β)
1
0.8
0.5
0.4 0.6 0.3 0.4 0.2 0.2
0
0.1
0
1
2 t
3
4
0
0
1
2 t
3
4
Figure 1. Probability density function of the generalized Rayleigh distribution. In fact it was shown by Raqab and Kundu [11] that the pdf of a generalized Rayleigh distribution is a decreasing function for α ≤ 0.5 and it is a right-skewed unimodal function for α > 0.5. The hazard rate function is given by ³ ´α−1 −βt2 −βt2 2αβte 1−e h(t; θ) = , α 1 − (1 − e−βt2 )
t ≥ 0.
(2.3)
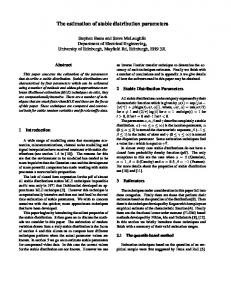
Figure 2 shows the variations of the hazard rate function for β = 1 and α = 0.25 (left) and α = 1 (right).
4
Estimation of the Generalized Rayleigh Distribution Parameters a− α=0.25, β=1
b− α=1, β=1
8
8
7
7
6 6 5
h(t;α,β)
h(t;α,β)
5 4
4 3 3 2
2
1
1
0
1
2 t
3
4
0
0
1
2 t
3
4
Figure 2. Hazard rate function of the generalized Rayleigh distribution. It was also shown by Raqab and Kundu [11] that the hazard rate function of a generalized Rayleigh distribution is bathtub type for α ≤ 0.5 and it is an increasing function for α > 0.5. The mean time to failure of the generalized Rayleigh distribution is given by r ∞ µ ¶ 1 1 πX α (−1)i+1 i− 2 . MTTF = 2 β i=1 i
3
(2.4)
Parameters Estimation
Consider n independent and identical components put on test. Assume that the lifetimes of these components follow the generalized Rayleigh distribution expressed in the previous section. Let t = (t1 , · · · , tk ), where t1 < · · · < tk , denote the predetermined inspection times with tk representing the completion time of the test. Also, let t0 = 0 and tk+1 = ∞. For i = 1, · · · , k, denote by ni the number of failures recorded in the time interval (ti−1 , ti ] and by nk+1 the number of censored units, that is units that have not failed by the end of test. 3.1 Maximum Likelihood Estimators. Using the data described above, the likelihood function is given by
L(t; θ) = C
k Y
[P {ti−1 < T ≤ ti }]ni [P {T > tk }]nk+1 ,
i=1
where C =
n!
Qk+1 `=1
n` !
is a constant with respect to the parameters α and β. Since, P {ti−1 < T ≤ ti } = F (ti ) − F (ti−1 ) ,
(3.1)
5
Estimation of the Generalized Rayleigh Distribution Parameters
and P {T > tk } = 1 − F (tk ) , therefore, (3.1) can be written as L(t; θ) = C [S(tk )]
nk+1
k Y
[S(ti−1 ) − S(ti )]ni .
(3.2)
i=1
Substituting from (2.1) into (3.2), one gets k h³ h ³ ´ ink+1 Y ´ ³ ´α ini 2 α 2 α 2 L(t; θ) = C 1 − 1 − e−βtk 1 − e−βti − 1 − e−βti−1 .
(3.3)
i=1
Hence, the log likelihood function is given by k ´α i ´ ³ ´ i X h³ h ³ 2 2 α 2 α . + ni ln 1 − e−βti − 1 − e−βti−1 L(t; θ) = ln C + nk+1 ln 1 − 1 − e−βtk i=1
We let
(3.4)
0, i = 0, 2 Ai (β) = 1 − e−βti , i = 1, · · · , k, 1, i = k + 1,
and note, for future use, that dAi (β) 2 = t2i e−βti , dβ
i = 1, · · · , k.
The log likelihood function (3.4) becomes L(t; θ) = ln C +
k+1 X
nh ni ln
iα h iα o Ai (β) − Ai−1 (β) .
(3.5)
i=1
We also let
h iα h iα D(i) (θ) = Ai (β) − Ai−1 (β) ,
i = 1, · · · , k + 1,
so that the log likelihood function (3.5) can be written in a more compact way as L(t; θ) = ln C +
k+1 X
ni ln D(i) (θ).
(3.6)
i=1
For ease of notation, we will denote, for any function f (x, y), the first partial derivatives by fx , fy , and the second partial derivatives by fxx , fyy , fxy , fyx . To write the log normal
6
Estimation of the Generalized Rayleigh Distribution Parameters
equations, compute the first partial derivatives of the log likelihood function as follows: Lα =
k+1 X i=1
Lβ =
k+1 X i=1
where Dα(i) = and (i) Dβ
(i)
Dα ni (i) , D (θ) (i)
Dβ ni (i) , D (θ)
α [A1 (β)] ln A1 (β),
(3.7)
(3.8)
i = 1,
[Ai (β)]α ln Ai (β) − [Ai−1 (β)]α ln Ai−1 (β), i = 2, · · · , k + 1,
n o α−1 2 −βt21 α e (β)] t [A , 1 1 =
i = 1,
n o α t2 e−βt2i [Ai (β)]α−1 − t2 e−βt2i−1 [Ai−1 (β)]α−1 , i = 2, · · · , k + 1. i i−1
The maximum likelihood estimators of α and β can be found by solving the system of equations Lα = Lβ = 0. Although the proposed estimators cannot be expressed in closed forms, they can easily be obtained through the use of an appropriate numerical technique. 3.2 Asymptotic Confidence Bounds. Applying the usual large sample approximation, the maximum likelihood estimators of θ can be treated as being approximately bivariate normal with mean θ and variance-covariance matrix equal to the inverse of the expected information matrix. That is, ³
³ ´ ´ ˆ , θˆ − θ → N2 0, I−1 (θ)
(3.9)
³ ´ where I θˆ is the variance-covariance matrix of the unknown parameters θ = (α, β). The ˆ i, j = 1, 2, can be approximated by Iij (θ), ˆ where elements of the 2 × 2 matrix I−1 , Iij (θ), −1
¯ ˆ = − Lθ θ ¯ ˆ . Iij (θ) i j θ=θ
(3.10)
From (3.7)-(3.8), the second partial derivatives of the log likelihood function are found to be
Lαα =
k+1 X i=1
ni
h i2 (i) (i) Dαα D(i) (θ) − Dα [D(i) (θ)]
2
,
Estimation of the Generalized Rayleigh Distribution Parameters
Lββ =
k+1 X
ni
i2 h (i) (i) Dββ D(i) (θ) − Dβ 2
[D(i) (θ)]
i=1
Lαβ =
k+1 X
(i)
ni
(i)
(i)
Dαβ D(i) (θ) − Dα Dβ
i=1
[D(i) (θ)]
2
,
,
where
(i) Dαα
o n α−1 2 2 −βt21 , i = 1, [A (β)] A (β) ln A (β) + t e 1 1 1 1 n o = α−1 2 2 −βt2i [A (β)] A (β) ln A (β) + t e + i i i i n o − [Ai−1 (β)]α−1 Ai−1 (β) ln2 Ai−1 (β) + t2 e−βt2i−1 , i = 2, · · · , k + 1, i−1
n o α−2 4 −βt21 −α t e [1 − α (1 − A (β))] [A (β)] , i = 1, 1 1 1 (i) n ³ ´ Dββ = 4 −βt2i −βt2i −α t e 1 − αe [Ai (β)]α−2 + i ³ ´ o −t4 e−βt2i−1 1 − αe−βt2i−1 [Ai−1 (β)]α−2 , i = 2, · · · , k + 1, i−1 n o α−1 2 −βt21 t e [A (β)] 1 + α ln [A (β)] , i=1 1 1 1 (i) n o Dαβ = α−1 2 −βt2i t e [A (β)] 1 + α ln [A (β)] + i i i n o +t2 e−βt2i−1 [Ai−1 (β)]α−1 1 + α ln [Ai−1 (β)] , i = 2, · · · , k + 1. i−1
Therefore, the approximate 100(1 − γ)% two-sided confidence intervals for α and β are, respectively, given by q ˆ α ˆ ± Zγ/2 I−1 11 (θ) ,
βˆ ± Zγ/2
q
ˆ I−1 22 (θ) .
Here, Zγ/2 is the upper (γ/2)th percentile of a standard normal distribution.
4
Illustrative example
In this section we use a set of real data presented in Nelson [9], which reports a set of cracking data on 167 independent and identically parts in a machine. The test duration was 63.48 months and 8 unequally spaced inspections were conducted to obtain the number of cracking parts in each interval. The data were
7
Estimation of the Generalized Rayleigh Distribution Parameters
8
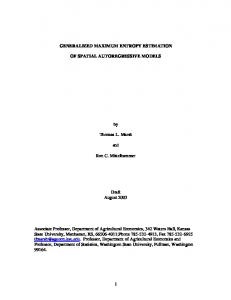
(t1 , · · · , t8 ) = (6.12, 19.92, 29.64, 35.40, 39.72, 45.24, 52.32, 63.48), and (n1 , · · · , n9 ) = (5, 16, 12, 18, 18, 2, 6, 17, 73). We assume that these data follow different distributions. Besides the generalized Rayleigh distribution, GRD(α, β), the distributions considered here are: 1. Exponential with parameter α, ED(α). Its survival function is S(t) = e−α t , t ≥ 0, α > 0. 2. Generalized exponential with parameters α, β, GED(α, β). Its survival function is ¡ ¢β S(t) = 1 − 1 − e−α t , t ≥ 0, α, β > 0. First we compute the maximum likelihood estimator(s) for the parameter(s) included in each distribution. Then we compare these distributions based on two different criteria. The criteria used are: the log-likelihood function and the Kolmogorov-Smirnov (K-S) test statistic. Finally, we compute the asymptotic confidence interval of the parameters of the underlying distribution and the maximum likelihood estimate of the MTTF of each distribution. Table 1 shows the MLE of the parameter(s) and MTTF of the distributions considered and the associated Log-Likelihood function value. Table 1. The MLE of the parameter(s), MTTF and the Log-Likelihood. MLE Distribution parameters MTTF Log-Likelihood −2 ED(α) α ˆ = 1.2097 × 10 82.666 -316.671 −2 ˆ GED(α, β) α ˆ = 2.0285 × 10 , β = 1.7839 69.551 - 309.740 −4 ˆ GRD(α, β) α ˆ = 0.684, β = 1.425 × 10 62.229 - 291.954 ¡ Based on the values of the Log-likelihood functions, we can conclude that the GRD 0.684, ¢ 1.425×10⁻⁴ fits this data much better than ED(1.2097×10⁻² ) and GED(2.0285×10⁻² , 1.7839). Figure 3 shows the variation of the hazard rate functions of the ED(1.2097 × 10⁻² ), ¢ ¡ GED(2.0285 ×10⁻² , 1.7839) and GRD 0.684, 1.425 × 10⁻⁴ . ¢ ¡ The variance covariance matrix of GRD 0.684, 1.425 × 10⁻⁴ is computed as
9
Estimation of the Generalized Rayleigh Distribution Parameters 0.03
0.025
GRD GED
Hazard rate function
0.02
0.015 ED
0.01
0.005
0
0
10
20
30
40
50
60
70
80
90
100
x
Figure 3. The estimated hazard rate functions.
· ˆ = I (θ) −1
3.13 × 10⁻³ 2.293 × 10⁻⁷ 2.293 × 10⁻⁷ 3.705 × 10⁻¹⁰
¸ .
Thus, the variances of the MLE of α and β become Var (ˆ α) = 3.13 × 10
−3
³ ´ and Var βˆ =
3.705 × 10⁻¹⁰ . Therefore, the 95% C.I of α and β, respectively, are [0.574, 0.794]
and
£
¤ 1.048 × 10⁻⁴ , 1.803 × 10⁻⁴ .
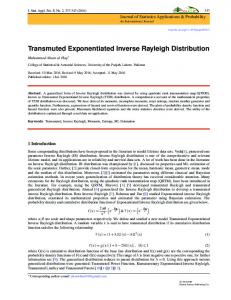
The survival function of the data is estimated using non-parametric and parametric methods. In the case of the non-parametric estimation, we used Kaplan-Meier method. For the parametric estimations, we used the three distributions mentioned above. Figure 4 shows the results of these estimations. Also, we computed the Kolmogorov-Smirnov (K-S) test statistics of the empirical distribution function and the fitted distributions for the data set. The values of these statistics are summarized in Table 2 below. Table 2. The K-S distances. Distribution ED GED GRD K-S 0.214 0.144 0.105 ¢ ¡ Based on the values of K-S, we get the same conclusion that the GRD 0.684, 1.425×10⁻⁴ fits this data much better than ED(1.2097 × 10⁻² ) and GED(2.0285 × 10⁻² , 1.7839).
Estimation of the Generalized Rayleigh Distribution Parameters 1
0.9
Survival function
0.8 K−M ED
0.7
GRD
0.6
GED
0.5
0.4
0
10
20
30
40
50
60
70
x
Figure 4. The empirical and fitted survival functions.
References [1] Abuammoh, A. and Sarhan, A.M. (2007). Parameter estimation for a generalized exponential distribution based on grouped data, Advances and Applications in Statistics (to appear). [2] Ahmad, K.E., Fakhry, M.E. and Jaheen, Z.F. (1997). Empirical Bayes estimation of P (Y < X) and characterization of Burr-type X model, Journal of Statistical Planning and Inference, 64, 297-308. [3] Burr, I.W. (1942). Cumulative frequency distribution, Annals of Mathematical Statistics, 13, 215-232. [4] Chen, Z. and Mi, J. (1996). Confidence interval for the mean of the exponential distribution, based on grouped data, IEEE Trans. Reliability, 45(4), 671-677. [5] Jaheen, Z.F. (1995). Bayesian approach to prediction with outliers from the Burr type X model, Microelectronic Reliability, 35, 45-47. [6] Jaheen. Z.F. (1996). Empirical Bayes estimation of the reliability and failure rate functions of the Burr type X failure model, Journal of Applied Statistical Sciences, 3, 281288.
10
Estimation of the Generalized Rayleigh Distribution Parameters
[7] Kundu, D. and Raqab, M.Z. (2005). Generalized Rayleigh distribution: different methods of estimation, Computational Statistics and Data Analysis, 49, 187-200. [8] Miller Jr., R. G., (1981). Survival Analysis, John Wiley, New York. [9] Nelson, W. (1982). Applied Life Data Analysis, John Wiley & Sons. [10] Raqab, M.Z. (1998). Order statistics from the Burr type X model, Computers Mathematics and Applications, 36, 111-120. [11] Raqab, M.Z. and Kundu, D. (2006) Burr type X distribution: Revisited, Journal of Probability and Statistical Sciences, 4(2), 179-193. [12] Rodriguez, R.N. (1977). A guide to Burr type XII distributions, Biometrika, 64, 129134. [13] Sartawi, H.A. and Abu-Salih, M.S. (1991). Bayes prediction bounds for the Burr type X model, Communications in Statistics - Theory and Methods, 20, 2307-2330. [14] Seo, S. K. and Yum, B. J. (1993). Estimation methods for the mean of the exponential distribution based on grouped and censored data, IEEE Trans. Reliability, 42(1), 97103. [15] Surles, J.G. and Padgett, W.J. (1998). Inference for P (Y < X) in the Burr type X model, Journal of Applied Statistical Science, 7, 225-238. [16] Surles, J.G. and Padgett, W.J. (2001). Inference for reliability and stress-strength for a scaled Burr type X distribution, Lifetime Data Analysis, 7, 187-200. [17] Wingo, D.R. (1993). Maximum likelihood methods for fitting the Burr type XII distribution to multiply (progressively) censored life test data, Metrika, 40, 203-210.
11