Generating Realistic Images from Hydrothermal Plume Data K. Santilli*
K. Bemis†
D. Silver‡
J. Dastur§
Rutgers University
Rutgers University
Rutgers University
Rutgers University
ABSTRACT Most data used in the study of seafloor hydrothermal plumes consists of sonar (acoustic) scans and sensor readings. Visual data captures only a portion of the sonar data range due to the prohibitive cost and physical infeasibility of taking sufficient lighting and video equipment to such extreme depths. However, visual images are available from research dives and from the recent IMAX movie, Volcanoes of the Deep Sea. In this application paper, we apply existing lighting models with forward scattering and light attenuation to the 3D sonar data in order to mimic the visual images available. These generated images are compared to existing visual images. This can help the geoscientists understand the relationship between these different data modalities and elucidate some of the mechanisms used to capture the data. CR Catagories: I.3.7 [Computer Graphics]: Three-Dimensional Graphics and Realism—Raytracing; J.2 [Physical Sciences and Engineering]: Earth and atmospheric sciences Keywords: Applications of volume graphics and volume visualization; Earth, Space, and Environmental Sciences Visualization; PC-based volume graphics; Volume Rendering 1 INTRODUCTION AND MOTIVATION Hydrothermal plumes form where hot fluids discharge from seafloor vents (commonly called black smokers) on mid-ocean spreading ridges. These hot buoyant fluids entrain the ambient seawater as they rise and are important to understanding the global transport of heat and chemicals in the ocean (which is a factor in climate studies) and to understanding the evolution of sea microbes. Geologists, acoustical geophysicists and computational fluid dynamicists (CFD) are all involved in the study of seafloor hydrothermal plumes, and they all “see” plumes in different ways. The field geologists, in particular, are used to looking at optical photographs and videos. These are either taken directly of underwater hydrothermal plumes, where the limited visibility constrains the range and features, or are taken in the laboratory during a plume experiment. Geophysicists look at “acoustic” data, and acoustic images are significantly different from optical images. To optical tools, plumes have opaque cores, irregular but sometimes sharp edges, and slowly fading tops. Acoustic imaging sees all the way through the plume core to the other side but sees only gradational edges, because plumes are nearly transparent to transmission of acoustic waves although they do scatter them. *email:
[email protected] † email:
[email protected] ‡ email:
[email protected] § email:
[email protected] **email:
[email protected]
P. Rona** Rutgers University
Additionally, traditional 3D visualization is largely threshold based so the plume appears to have a sharp top (as an artifact of the chosen threshold). Computational fluid dynamicists see plumes as mechanisms of turbulent transport; they tend to focus on the size and speed of eddies rather than properties of the mean flow. Nevertheless, computationalists are more familiar with looking at isosurfaces within plumes than geologists are because CFD model results are 3D volumes just like sonar data and, hence, visualized with the same or similar tools. The motivation for this study is to try to create more realistic plume images from the acoustic data to help bridge the gap between these fields and help the geologists understand the acoustical geophysicists data. Our goal is to use the particle concentration implicit in the acoustic backscatter intensity to recreate the optical image a camera would see given a particular lighting level. An additional motivation for visualizing the acoustic data as optical data (i.e., converting acoustic images to optical images) is the greater understanding of the acoustic interaction with the plume and the properties of the plume. Our Vent Imaging and Processing (VIP) group is working to determine the relative roles of different backscatter mechanisms that produce acoustic images of black smoker plumes. We have assumed that Rayleigh backscatter (scattering by particles that are small relative to the wavelength of the acoustic pulses used to ensonify a plume) is the principal mechanism. Other possible backscatter mechanisms are density discontinuities related to turbulent structure and temperature variations within the buoyant plumes. By using visualization techniques, specifically realistic lighting models [7][8][19][25], we can convert the plume image from mechanical waves (sound) to electromagnetic waves (light). The acoustic data are the observed volume backscattering coefficients for Rayleigh scattering and the resulting optical images will model the Mie scattering of visible light. This will, in conjunction with other tests, help us to sort out backscattering mechanisms and their relative importance. In the next section, we describe how sonar images of plumes are acquired. This is followed by a description of the realistic rendering techniques most relevant to this study. Results of applying the realistic rendering to the acoustical images are described in Section 3. These computed images are compared to “real” images (Figure 1) taken from an underwater cruise [22][21]. Because the lighting techniques are general, different lighting conditions can be simulated by changing the parameters of the model. In Section 4, we apply an IMAX filming based lighting model to the acoustic data and compare these results to images from a recent IMAX film, Volcanoes of the Deep Sea [26]. This film captured spectacular images of hydrothermal plume from a site in the Pacific and several sites in the Atlantic; the images shown in Figure 1 are from the RIDGE 2000 Integrated Study Site at 9° N on the East Pacific Rise (EPR) and the vent complex called Snakepit at 23°N on the Mid-Atlantic Ridge. Note the different color of the plumes, which is both a function of the materials present in the plume and the distance of the camera and lights.
IEEE Visualization 2004 October 10-15, Austin, Texas, USA 0-7803-8788-0/04/$20.00 ©2004 IEEE
91
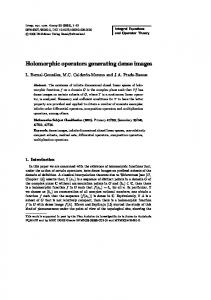
a)
b)
c) sonar data range
sonar
Figure 1: (a) The first image is a cropped video still from the VIP 2000 cruise in July 2000 of a black smoker on Grotto Vent in the Main Endeavour Field on the Juan de Fuca Ridge. The image is approximately 0.5 m wide. (b-c) The other two images are cropped video stills from the IMAX movie Volcanoes of the Deep Sea, produced by The Stephen Low Company and Rutgers University [26]. These images are from video version of the film. (b) A vent at 9°N on the East Pacific Rise. Image is approximately 2 m wide. (c) This plume at Snakepit on the MidAtlantic Ridge (MAR) rises in front of a shrimp coated tower. This figure is a mosaic of 3 images, which is approximately 2 m wide.
2 BACKGROUND Sub-seafloor hydrothermal convection systems discharge as plumes from point sources and as seepage from areas of the ocean bottom. The plumes originate as clear, hot (c. 150o to 400oC) solutions that vent from mineralized chimneys, precipitate dissolved metals as particles to form black or white smokers as they turbulently mix with ambient seawater, and buoyantly rise hundreds of meters to a level of neutral density where they spread laterally. Hydrothermal flow regimes are being intensively studied for their role as quantitatively significant agents of dispersal of heat, chemicals, and biological material into the ocean from subseafloor hydrothermal convection systems on a global scale (e.g., [9]). Table 1: Minerals found in plume particles Mineral
Formula
Anhydrite Chalcopyrite Pyrite Pyrrhotite Sphalerite
CaS04 CuFeS2 FeS2 Fe(1-x)S (Zn,Fe)S
Reflected Color white yellow cream pink beige grey
Albedo[2] 0.0085 0.12-0.41 0.38-0.57 0.28-0.44 0.16-0.19
Size[10] (µm) 10-500 10-60 10-60 0.1-5 50-100
The particles in hydrothermal plumes depend on the chemistry and temperature of the fluids exiting the seafloor. High temperature (250-350°C) fluids from black smokers (Figure 1) are typically characterized by the precipitation of metal-rich sulfide and sulfate minerals (chalcopyrite, pyrrhotite, pyrite, sphalerite) while lower temperature (70-300°C) fluids from white smokers typically precipitate amorphous silica, pyrite and barite (Feely et al., 1987). The exact mineral assemblage in black smoker plumes varies between regions. Precipitates in plumes along the Endeavour Segment of the Juan de Fuca Ridge (e.g., Grotto Vent in Figure 1a) are dominated by chalcopyrite and anhydrite [10].
92
camera & range Figure 2: The sonar system, which is attached to a remotely operated vehicle, scans a hydrothermal plume. Three volume slices are shown. The video images in Figure 1 are taken when the vehicle moves in closer (orange box marks the camera position). Note the different range for the sonar and camera.
Pyrrhotite is more important in some plumes along the East Pacific Rise [10]. Particle composition also varies vertically in the plume [10] [23]. Table 1 gives the chemical formula and some optical properties for the minerals most likely to be found in our study area (Endeavour). 2.1 Acoustic Remote Sensing Our acoustic images of plumes are based on the intensity of Rayleigh backscatter from metallic mineral particles (sulfides, oxyhydroxides, sulfates) precipitated from high-temperature hydrothermal solutions and suspended as “smoke” in the plumes [17]. The particles are small (microns) relative to the wavelength of the acoustic frequencies used (~1 cm at 200 to 330 kHz). At sufficiently low particle concentrations (for no multiple scattering) backscatter intensity is directly proportional to concentration of suspended particles as the product of total particle load and a factor dependent upon average particle mechanical properties (density, bulk modulus, and radius). The volume backscattering coefficient, which is easily and accurately computed from the raw acoustic data, plays a similar role for sound as the extinction coefficient does for light. However, Rayleigh backscattering and Mie forward scattering have different dependencies on wavelength (or wavenumber k) and particle size (radius r). In the case of Mie scattering (for both light and sound where the wavelength is much smaller than the particle), the extinction cross-section is approximately twice the actual particle’s cross-sectional area [11][12] (see Table 2 for terms):
σ Mie = 2πr 2 , when kr >> 1
(1)
In the case of Rayleigh scattering (wavelengths much larger than the particles), the backscattering cross-section depends on the fourth power of the ratio between particle size and wavelength [12]:
σ Rayleigh = r 2
25(kr )4 , when kr