Generating Web Services for Statistical Survey Packages from Domain-specific Visual Languages Chul Hwee Kim1, John Hosking1 and John Grundy1, 2 Department of Computer Science1 and Department of Electrical and Computer Engineering2, University of Auckland, Private Bag 92019, Auckland, New Zealand
[email protected], { john | john-g}@cs.auckland.ac.nz Abstract High-quality, large-scale statistical survey design, data analysis and information visualisation can be very complex. Current statistical COTS software tools provide powerful statistical processing and analysis support but very limited mechanisms for designing, implementing and reusing such support. We have been developing a highlevel, domain-specific visual language, the Survey Design Language (SDL), and associated support tool, SDLTool, in conjunction with statisticians. In this paper we describe SDLTool’s support for turning high-level survey design models into widely accessible web services to share complex statistical survey technique implementations run by COTS statistical packages.
1
Introduction
Statistical surveys have been used extensively for thousands of years and more recently probability theory and mathematical statistics have provided a rigorous scientific foundation for them [1]. However statistical survey support tools have been limited to supporting only parts of the surveying process [2], [5], typically low-level statistical technique implementations including data capture, processing and analysis. Many other aspects such as statistical metadata, heterogeneity in statistical data semantics, and other non-mathematical activities are less well addressed [3], [6]. We have been developing a higher-level statistical survey process support tool incorporating a range of domain-specific visual languages to enhance statistical survey design, implementation and reuse [7], [8]. To this end we developed the Survey Design Language (SDL) and its support tool, SDLTool, an integrated set of visual notations aimed at supporting survey design in a similar way that the Unified Modelling Language (UML) [15] supports software development. We describe our recent work in extending SDLTool to support the generation of web services that provide data capture, processing and analysis support via COTS survey analysis tools. These survey implementations are generated as web services from high-level models and allow heterogeneous 3rd party applications to make use of these packaged techniques implemented by remote COTS statistical analysis tools.
We begin by presenting as motivation for our work, the design and implementation of a statistical survey relating to impact of crime in New Zealand. We then outline the key aspects of our approach to the problem including domain-specific visual modelling tool support and statistical survey technique web service generation. We describe the approach used to generate web services that use COTS statistical tools to implement modelled statistical surveying techniques. We discuss the strengths and weaknesses of our research and conclude by outlining key future directions for this research.
2
Motivation and Background
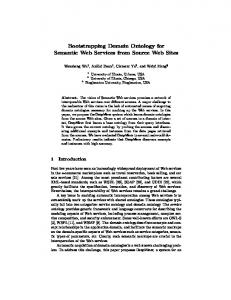
The primary source of crime victimisation data for e.g. government agencies and the news media is usually law enforcement agencies. However the reality of victimisation may not be sufficiently captured from the one source and therefore victimisation data might usefully be supplemented by a statistical survey to investigate: • Better identify at risk groups. • Provide an alternative measure of crime victimisation • Describe both explicit and implicit effects of crime. This broadly is the theme of the New Zealand National Survey of Crime Victims in 2001 [14]. The survey was a door-to-door survey targeted at New Zealanders aged 15 or more. Each region was assigned a unique area code, and a stratification of the area codes done. Random samples of strata were compiled and a pre-defined visit pattern was applied in collecting data e.g. 10th street, 10th house. Figure 1 shows how the survey outlined above is depicted and elaborated using an SDLTool survey diagram [7], a brainstorming view for early conceptualisation of the survey design. Initial survey attributes are clustered around a user defined survey contexts and visualise key processes in formulating the high-level nature of the survey. SDLTool provides a variety of such domain-specific visual language diagram types with which to model complex statistical surveys: survey diagrams model the overall context of a survey; survey task and data diagrams model data collection and analysis; survey technique diagrams model low-level details of statistical analysis processes; and survey process diagrams model high-level survey task interactions [8].
Figure 1. An example SDL Survey Diagram for crime victimisation survey. Currently developers of such statistical surveys have to build custom models of the survey process in an ad-hoc fashion outside their COTS analysis tools; build surveyspecific data capture, processing and analysis technique implementations with multiple COTS statistical analysis tools, such as R [5]; and often have great difficulty sharing these technique implementations as most COTS analysis tools use proprietary representational techniques. We have identified, in conjunction with statistician end-users of our SDLTool, the following set of requirements for SDLTool to support more effective statistical survey technique sharing between COTS analysis tools: • Generation of statistical technique implementations. Once a set of statistical techniques has been fullyspecified, scripts implementing these for 3rd party, COTS statistical analysis tools can be generated. • Wrapping of generated technique implementations in web services. SDLTool users should be able to use techniques based on diagrammatic specifications outside of the SDLTool environment. This to make these technique implementations accessible to other tools, web services wrapping them need to be generated and deployed for discovery and invocation. • External tool interaction with generated technique web services. 3rd party statistical tools can discover and invoke the generated statistical technique implementations via their generated web services. These remote statistical technique implementations provide a set of analysis services, implemented by existing COTS statistical analysis packages, for both
applications and other analysis tools, without users needing knowledge of the implementation of the techniques. They also have the added advantage of allowing COTS analysis tools to be used by others without the need to have an installation of the COTS tools themselves.
3
Related Work
ViSta [19] provides a visual statistical data analysis support and has a visually guided and structured environment for data analysis with multiple visual models to suit various end user groups and is the closest existing tool to what we aim for with SDL. Task based organisation is well expressed but there is little support for merging tasks to support survey objectives. CSPro [1] assists users from the data entry stage to produce error and inconsistency-free data. However it only covers limited stages of the statistical surveying process, with no support for sampling design and data analysis. Our work has been strongly influenced by the UML [15], particularly its use of multiple notations supporting multiple modelling spaces. UML is too software domainspecific for direct use in survey design [12], but the historical development of UML has afforded us valuable insight into visual languages dealing with complex multidimensional problems, and the recent development of model driven architecture based on UML has inspired some of the work we present in this paper. In particular, synthesis of web services from UML [16], [18].
Much recent work has been done on providing tool support for both composing web service orchestrations [16], [18] and generating web service interfaces and partial implementations from domain-specific models [4], [13], [9]. Much of this work has demonstrated that both generation and composition of web services from highlevels is feasible. Key issues are developing a suitable model from which to synthesize the web services and compositions; use of standard protocols and data representations where possible to maximise accessibility; and characterisation of web services to support 3rd party client application discovery and adaptation.
Service Development Kit framework and tools) (5). Additionally WSDL descriptions of these services are generated and deployed to a web host, currently Axis (6). External tools such as existing statistical survey packages or bespoke Java or .NET applications can discover and invoke the packaged survey technique implementations via their web services (7). Required data is passed to the scripts via the generated web service interface, and result data is similarly packaged by the generated web service implementation and returned to the 3rd party application.
4
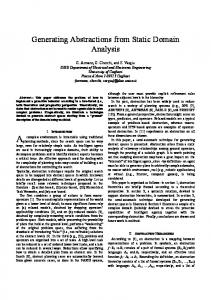
In this section we use the New Zealand Crime Survey case study to elaborate the steps outlined in Section 3 when using our SDLTool. Initially a statistician designs a survey using the top-level SDL survey diagram, an example of which is shown in Figure 1. The statistician may begin from scratch or reuse a design from an SDLTool repository. For example, in Figure 1, the Survey icon plus 4 contexts Objectives, Data Collection, Population and Data Analysis form a standard template which has been elaborated with the survey name, an additional context Caveat, and survey specific attributes for each context. After creating the overall survey structure the statistician creates further SDL views to specify the survey in more detail. Several examples from the NZ Crime Victimisation Survey are shown in Figure 3. Figure 3 (a) is a hierarchical task diagram, specifying two data analysis tasks to be carried out on the survey data. During data collection, our main concern is to specify sampling techniques used in the survey process and types of statistical metadata related to collected data.
Our Approach
Figure 2 illustrates the process of designing, generating and using statistical technique implementations using SDLTool. One or more repositories store statistical survey meta-data and/or SDLTool survey models (1). Some of these repositories may be 3rd party while others might be SDLTool-specific. Users import one or more useful SDL model templates and/or meta-data formats from these repositories and then develop their own statistical survey designs (2). SDLTool supports collaboration with other users by sharing SDL models and diagrams using a CVS repository and synchronous collaborative editing (3). Once a statistician has completed detailed survey technique specification, scripts are generated by SDLTool (4) that drive external 3rd party statistical processing and analysis packages, such as R [5]. After testing these survey technique implementation scripts the user instructs SDLTool to generate web service interface implementations (currently in Java using the Java Web
CVS Repository of statistical survey meta-data & SDL survey models
Other users’ SDLTools
Web service host Repository Web Service WSDLs Find() Add/Update() SDLTool Collaboration WSDLs Edit()
Example Usage of SDLTool
1. Import meta-data format(s) and/or models into SDLTool;
SDLTool Web Services
2. Develop high-level and low-level SDL models for statistical survey
SDLTool
3. Collaboratively edit/share metadata and models 5. Generate WSDL and web service interface implementations for scripts Implementations of services using scripts
WSDLs 3rd party apps
7. Make use of generated technique implementations from 3rd party applications via web services
5
4. Generate Statistical Technique Implementation Scripts & Test via SDLTool
Generated statistical technique scripts
6. Deploy web services for external tool use
Figure 2. SDLTool usage overview.
Data Files
3rd party COTS statistical data processing and analysis tools
(1 )
b
a
Statistical data
(2)
Triple-S Population – Sample relationship
Mapped
c
d
Boxplot
(1)
Multivariate Plot
Figure 3. Examples of NZ Crime Survey SDL diagrams. Figure 3 (b) specifies the two sampling methods to be used in the survey. Here the sampling frame is stratified in two stages by the modified area unit (1) then household visits planned using patterned clustering (2). A mock statistical dataset can be bound to the ‘Data Frame’ icon for pre-testing purposes. Post data collection, collected data can be bound to the ‘Sample’ data icon. Figure 3 (c) shows a survey technique diagram describing the data analysis operations implementing the tasks in Figure 3 (a). Here, we use two visualisation methods (boxplot and multivariate analysis) to assess whether there is evidence of a statistical association between data variables. The two techniques are composed in the same diagram as they use the same statistical data. They are bound to external analysis methods implemented using R. The diagram may then be separately executed to produce a boxplot for the socio economic status and victimisation relationship and the multivariate plot to visualise the public awareness. The modeller also binds the resulting visualisation artefacts to the tasks they correspond to in the task diagram (Figure 3(d)). When the user is satisfied with the correctness of a functional technique diagram the diagram can be turned into Java code and exposed in the form of a web service. Figure 4 (a) shows the user invoking the contextual menu to generate a service based on the diagrammatic specification of the current diagram. The diagram is submitted to the model repository as an XML document as in Figure 4 (b). The submitted model is processed according to a web service generation template and clients
may access the generated web service via a generated WSDL interface, shown in Figure 4 (c). Figure 4 (d) shows a demonstration program which we built using the Microsoft .NET framework utilising the statistical technique developed with our SDLTool.
6
SDLTool Architecture
Figure 5 shows the high-level components making up the SDLTool architecture. SDLTool is implemented using the Pounamu meta-tool [20]. When using SDLTool a meta-tool specification is opened by Pounamu (a) and SDLTool instantiated. Statisticians build SDL models in SDLTool, having diagram and model information stored locally (b). SDLTool uses an event-driven (c) generator to turn technique diagrams into scripts to drive external 3rd party COTS analysis tools (d). SDLTool may invoke these scripts directly with example data sets, allowing testing of a technique implementation (e). The technique web service generator produces a web service providing an interface to the generated scripts for the COTS analysis and a WSDL specification for this interface (f). The generated technique web services are deployed (g) for remote discovery and invocation. 3rd party client applications may (h) discover and invoke (i) the generated technique web service to make use of its statistical survey technique implementation (j). Datasets are passed via the web service to the COTS statistical analysis packages (k), processed, and results returned (l) to the invoking 3rd party applications.
a
c b
d
Figure 4. Generating and using a statistical survey technique implementation and its web service interface. a SDL Diagrams
SDL Models
Pounamu Meta-tool
c
Event Handlers: -model/view consistency -external stats tool interaction -import meta-data formats -export meta-data formats -collaborative editing support -generation of web services
b
d Local SDLTool Repository
k
e
Stats tool script generator
Web service generator
f
j
3rd party COTS statistical analysis tools
Web Service Implementatio n
Generated Scripts
Local datasets
l
i
7
Web Service host 3rd Party Stats WS client applications
h
Generated Statistical technique Web services & WSDLs
diagram types such as UML activity diagrams and SDL process diagrams. The script generator takes a survey technique diagram and generates one or more scripts for third part COTS statistical analysis packages like R. These are “technique implementations” that given suitable input datasets will clean, select, analyse and produce an output datum or dataset for the specified technique algorithms. The web service implementation generator produces a Java implementation of the web service that is used to receive datasets as XML messages, transform them into local data files in appropriate COTS tool proprietary data formats, invoke the COTS statistical analysis package with appropriate generated technique script implementation, and transform any result data from the COTS tool’s proprietary format and back into an XML message.
g
Figure 5. SDLTool architecture. The current tool only turns survey technique diagrams into executable web services, as they are the aspect of survey process design most amenable to code generation. Each technique diagram represents an independent, stateless and reusable set of atomic statistical techniques within the context of a single activity without the orchestration overheads that are inherent in behavioural
Discussion
We have conducted a detailed user evaluation and heuristic Cognitive Dimensions-based evaluation of SDLTool, described in [7]. In summary, these have demonstrated that the SDL notation is very effective for statistician end users planning their surveys, building complex, detailed statistical analysis technique definitions, and generating scripts for COTS analysis tools to implement these analysis techniques. The generation of scripts implementing techniques using existing COTS analysis tools was seen as a crucial part of the tool. We have used SDLTool to develop a range of statistical survey designs and technique implementations for various
moderately-sized statistical problems. Generated statistical technique implementations are made available to remote, 3rd party applications via web service interfaces. This permits sharing of technique implementations with nonSDLTool users as a “black box” remote web service. Generated WSDL specifications for the web service permit advertising the service via a registry and discovery and invocation of the technique implementation. Generated web service code supports data translation from remote clients into the target COTS tool input format, and from the output format of the COTS tools into XML for return. The synthesized statistical technique implementation web services produce proprietary WSDL message formats rather than utilising any standard protocol for encoding statistical data and decoded results data. This means 3rd party client applications using the generated technique web services must be engineered with knowledge of these protocols. With emerging meta-data standards for statistical analysis tools these generated web services should at least conform to an XML-based data representation scheme for such techniques. Additionally, as web service-based technique implementations become more widely accepted in this domain, new protocols to invoke such technique implementation services are likely to emerge. Again our generated web services should conform to such standards to make them compatible with potential 3rd party client applications. Generated statistical technique implementations manifested as web services are currently deployed to an Axis server with a single implementation invoking a single 3rd party statistical analysis tool script. Some of these technique implementations are very heavy-weight and multiple clients attempting to use such a service simultaneously is not feasible. A more scalable deployment architecture is required for these technique implementation web services. This includes the ability to deploy multiple services to different web service hosts; the ability to deploy a technique web service and associated generated scripts and COTS tools as a unit; and the ability to performance test and engineer the deployments.
8
Summary
We have developed a set of domain-specific visual languages and an associated toolset, SDLTool, for statistical survey design and implementation. Statistical survey technique implementations are made available to 3rd party client applications via generated web services, which are then deployed and advertised for discovery and invocation. These web services are synthesized from the domain-specific visual language models in SDLTool.
References [1] Biemer, P.P. and Lyberg, L.E. Introduction to survey quality Wiley Inter-Science 2003, Chapter 2. [2] CSPro, http://www.census.gov/ipc/www/cspro/
[3] Gillman, D. and Appel, A. The Statistical Metadata Repository: an electronic catalog of survey descriptions at the U.S. census bureau, IASSIST Quarterly, summer 1997. [4] Hernández, F., Bangalore, P., Gray, J. and Reilly, K. A Graphical Modeling Environment for the Generation of Workflows for the Globus Toolkit, ICS 2004 Workshop on Component Models and Systems for Grid Applications, Saint-Malo, France, June 2004. [5] Ihaka, R. and Gentleman, R. R: A Language for Data Analysis and Graphics, J Computational and Graphical Stats, Vol. 5, No. 3 1996, pp. 299-314. [6] Jenkins, S. G. The Triple-S survey interchange standard http://www.triple-s.org/sssasc96.htm [7] Kim, C., Hosking, J., and Grundy, J., A Suite of Visual Languages for Statistical Survey Specification. IEEE VL/HCC 2005, 19-26. [8] Kim, C. H., Hosking, J., Grundy, J., Model Driven Design and Implementation of Statistical Surveys, 40th Annual Hawaii International Conference on System Sciences (HICSS'07), 2007 [9] Liu, A., Grundy, J.C. and Hosking, J.G., A visual language and environment for composing web services, In Proceedings of the 2005 ACM/IEEE International Conference on Automated Software Engineering, Long Beach, California, Nov 7-11 2005, IEEE Press, pp. 321-324. [10] Mehra, A., Grundy, J.C. and Hosking, J.G., Adding Group Awareness to Design Tools Using a Plug-in, Web Servicebased Approach, In Proceedings of the Sixth International Workshop on Collaborative Editing Systems, CSCW 2004, Chicago, November 6, 2004. [11] Mehra, A., Grundy, J.C. and Hosking, J.G. A generic approach to supporting diagram differencing and merging for collaborative design, In Proceedings of the 2005 ACM/IEEE International Conference on Automated Software Engineering, Long Beach, California, Nov 7-11 2005, IEEE Press, pp. 204-213. [12] MetaNet 2003, Metanet Conference INEAG, Samos, May 2003. [13] Nicoloudis, N. and Mingins, C. XML Web services automation: a software engineering approach, 9th AsiaPacific Conference on Software Engineering, 2002. [14] NZCS 2003, New Zealand National Survey of Crime Victims in 2001, New Zealand Ministry of Justice [15] OMG, Unified Modelling Language http://www.uml.org/ [16] Pautasso, C. and Alonso, G. Visual Composition of Web Services, Proc IEEE HCC’03, Auckland, 2003, pp. 92-99. [17] Ran, S. A Framework For Discovering Web Services With Desired Quality of Services Attributes, In Proc. 1st International Conference on Web Services, 2003. [18] Thone, S., Depke, R. and Engels, G. Process-oriented, flexible composition of web services with UML, Proc ERWkshp on Conceptual Modeling Approaches for e-Business, Tampere, Finland, LNCS, 2002. [19] Young, F.W. & Bann, C.M. ViSta: A Visual Statistics System Statistical Computing Environments for Social Research., Sage Publications, Inc., 1997, 207-235. [20] Zhu, N., Grundy, J.C. and Hosking, J.G. Constructing domain-specific design tools with a visual language metatool, CAiSE 2005 Forum, Portugul, June 2005, Springer.