Genetic Algorithm based Weighted Extreme Learning Machine for binary Imbalance Learning Rudranshu Sharma KIET, Ghaziabad
[email protected]
Abstract: Class imbalance problem refers to unequal distribution of data instances between classes. Due to this, popular classifiers misclassify data instances of minority class into majority class. Initially, Extreme learning machine was proposed with the prime objective of handling real valued datasets. Though, it a fast learning technique, it suffers from the drawback of misclassification of imbalanced dataset which leads to the class imbalance problem. So, a new variant of ELM called Weighted Extreme Learning Machine was developed. This technique aimed at handling imbalance data by assigning more weight to minority class and less weight to majority class. The limitation of this technique lied in that it generates weight according to class distribution of training data, thereby, creating dependency on input data. This leads to the lack of finding optimal weight at which good generalization performance could be achieved. This work uses Genetic Algorithm to find optimal weight which is given to minority and majority class instances.
Ankur Singh Bist KIET Ghaziabad
[email protected] and Weighted ELM W2 [9] are proposed which determines that what degree of re-balance is required. We can assign different misclassification cost for each instance, but for simplicity these algorithms choose a weighing scheme which is automatically generated from the class information. These new weighing schemes are better than the previous ones because, they assign weights to binary class as well as carry all the advantages of ELM. These algorithms generate weight automatically according to the class distribution, which are inversely proportional to the number of instances in the training data. Hence, these algorithms belong to the family of cost-sensitive learning [7]. As we have seen that in Weighted ELM W1 and Weighted ELM W2 weights assigned to binary class depends on the number of instances. But, in our proposed weighing scheme this dependency is eliminated by deciding weights with the help of genetic algorithm [10,11], and misclassification cost matrix is generated by directly assigning weights to binary class. Here, we tune only three parameters which are: misclassification cost or weight, number of hidden neurons and regularization parameter[4]. Genetic Algorithm starts with a large population of individuals or weights. With each generation weights are selected by Selection, and corresponding fitness value is calculated by fitness function. After determining fitness value, rank individuals by their fitness value. Only these selected individuals are allowed to reproduce and also random changes are introduced by mutation. This process is repeated in each generation. The expectation is that the fitness of the population will increase with each generation. Therefore, with each generation more classification accuracy is achieved. This paper is organized as follows: Section 2 describes the related work of ELM, WELM and Genetic Algorithm. Section 3 represents the proposed work followed by Section 4, which describes the experimental set-up and Finally, Section 5 concludes this work. 2. Related Work 2.1 Extreme Learning Machine Extreme Learning Machine (ELM) [2,3,5,21] is based on least square solution and was originally proposed for single hidden layer feed-forward network. The advantage of this is, rather than tuning of all the parameters here, hidden neurons and input weight, are chosen randomly. Here, hidden nodes may be sigmoid additive nodes or Gaussian kernel nodes. Hidden node parameters are randomly taken and output node parameter is calculated using MoorePenrose inverse[12,13].This algorithm is thousand times faster than past learning methods such as, back propagation and also reaches the smallest training error. Due to these features, generalization performance of this algorithm is also good. We have given data (xp,,tp) for N random different samples where, xp=[xp1,xp2,……….,xpn]t Rn and
Keywords: Genetic Algorithm, Extreme Learning Machine, Learning. 1. INTRODUCTION In this paper, we represent a new weighing scheme which takes into consideration the key ideas of genetic algorithm for enhancing classification accuracy of Extreme Learning Machine. Initially, gradient-descendent based leaning algorithm such as, back propagation [1] was used to train feed-forward neural networks, but the learning speed of these networks was much slower than that was required by the applications [2]. Major reason behind was that in these algorithms, all the parameters of network had to be tuned which increased the dependency between the parameters. So, a new faster learning algorithm called, Extreme learning Machine [2-5]is proposed by G. B. Huang in 2006, which deals only with two parameters that are: hidden node and input weight. These two parameters are chosen randomly and the output weight is analytically found, but the drawback of this technique is that it works only on data with balanced class distribution or balanced data [6]. As we have seen that data with imbalanced class distribution or we can say, imbalanced data is present everywhere, like in the field of academics, industry, biomedical applications and various others. Here, we take into consideration only data with binary class that is, majority (negative) class and minority (positive) class. Due to the presence of imbalanced data, misclassification problem arises, because popular classifiers favor the majority class and the separating boundary (which provide balancing between two classes) move towards the minority class[7], which gain better classification result for majority class instances and minority class instances are not properly classified. So, new techniques are introduced to handle these imbalanced data which are under sampling and oversampling[7] but, each technique has its own problems and consequences. After this Weighted regularized ELM[8] is proposed but it also not considered imbalanced data. Therefore, two new variants of ELM, Weighted ELM W1 978-1-4799-7171-8/15/$31.00 ©2015 IEEE
tp=[tp1,tp2,……….,tpm] Rm. Activation function g(x) with L hidden nodes is defined as L
∑
L
βp . gp(xq)=
p =1
∑
βp . g(wp . xq+bp) =oq
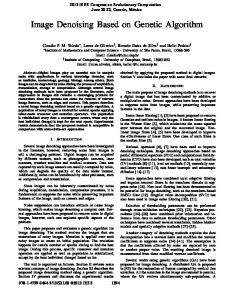
maximum for better generalization performance. Architecture of ELM is shown in fig: 1. So, for maximizing marginal distance and minimizing error vector we can model optimization function as
p =1
for q=1,2,3,……….N Where wp=[wp1,wp2,………wpn]t is weight vector connecting pth hidden node and input nodes. βp=[βp1,βp2,…………βpm]t is weight vector connecting pth hidden node and output nodes. And bp is the threshold of the pth hidden node. With Activation function g(x) and L hidden nodes SLF’s can L
approximate these N samples with zero error i.e.
∑
||oq-
q =1
tq||=0 Thus, we can say that there exist wp, bp and βp such that,
Minimize:
f =
1 β 2
Subject to: h( x i ) β
2
N 1 + CW ∑ ξ i 2 i =1
2
= t iT − ξ iT , for i=1,2,………N
Solving this optimization function using langrage multiplier and Karush-Kuhn-Tucker theorem [14] we get required output weight as −1 When N is small: T ⎛ I T ⎞ β = H
When N is large: β
+ WHH ⎜ ⎝ C
⎛ I = ⎜ + H ⎝ C
T
WH
⎞ ⎟ ⎠
⎟ ⎠
WT
−1
H
T
WT
L
∑
βp . g(wp . xq+bp)=tq
for q=1,2,3………N
p =1
We can also show the above equation as Hβ=T (1) Where H(w1,………..wL,b1,…………bL,x1,………..xN)
⎡ g ( w1 x1 + b1 ) " g ( wL x1 + bL ) ⎤ ⎥ = ⎢ # " # ⎢ ⎥ ⎢⎣ g ( w1 xN + b1 ) " g ( wL x N + bL )⎥⎦ NxL ⎡t1T ⎤ ⎡ β1T ⎤ ⎢ ⎥ ⎢ ⎥ β= ⎢ # ⎥ and T= ⎢ # ⎥ ⎢t NT ⎥ ⎢ β LT ⎥ ⎣ ⎦ ⎣ ⎦ Lxm
Nxm
When the input weights (wp) and hidden layer biases (bp) are determined then output weight βp is calculated as:
β =H T +
+
Where H is the Moore-Penrose generalized inverse of matrix H. 2.2 Weighted Extreme Learning Machine Weighted extreme learning machine [9] could be termed as extreme learning machine with weight matrix and regularization parameter. Regularization parameter is used to represent trade-off between maximizing marginal distance and minimizing misclassification error cost/value and, weight matrix is inversely proportional to the normalized input data. Training samples are given in the form of (xi, ti) where, xi Rn and ti is either -1 or +1 for i=1…….N and n is the number of features in each training sample. Define an NxN diagonal weight matrix for each training sample xi where, weight assigned to minority class is always greater than weight assigned to majority class. Input weight (wpj for p=1….L,j=1….n) between n input nodes and L hidden layer nodes and bias (bp for p=1…L) at each hidden layer node are randomly generated between 0 and 1. Hidden layer output is hp= wpjxp + bp.Output layer node output is yi =h1(xi)β1 + h2(xi) β2 +….+hL(xi) βL= h(xi)β and output in vector form is Y = Hβ. Target output is T = t1, t2,..................,tN.Since it is a binary classifier so there is only one output node. .Error vector is ξ = Y-T = H β-T. Output weight should be such that the marginal distance is
Fig.1.Architecture of Weighted ELM 2.2.1Weight Determination in Weighted ELM In weighted ELM, two schemes for weighing misclassification are given. Minority misclassification weight is given as inverse of total minority samples and majority misclassification weight is given as inverse of total majority samples.
WMinority =
1 $( Minority)
and
WMajority =
1 $( Majority )
Where, $(minority) is the number of samples belongs to minority class and $(majority) is the number of sample belongs to majority class. In other scheme, minority misclassification weight is given as inverse of number of minority samples multiplied by 1 and majority misclassification weight is given as inverse of majority samples multiplied by 0.618.
WMinority =
1 $( Minority )
and WMajority =
0.618 $( Majority )
Here, minority misclassification weight is always greater than majority misclassification weight which causes proper positioning of classification boundary and hence determines good generalization performance. 2.3 Genetic Algorithm Genetic algorithm [10,11,15,16] is a well known probabilistic global search and optimization method. Advantages of Genetic Algorithm are[17]: 1) Traditional methods start search from a single point, while genetic algorithm considers the whole population. So, the search space of genetic algorithm is wider than traditional methods. 2) It operates with coded versions of the problem parameters rather than parameters themselves. 3) It could be applied to any kind of continuous or discrete optimization problem.
Here, basic genetic algorithm is shown which is based on "survival of fittest" concept, which means, fittest individuals dominating over the weaker ones. We can show the optimization problem like this [17]: (2) max f ( x ) x∈ X
Where X is search space and f is objective function, f : X → R . Genetic algorithm does not work with problem (2) directly, but with coded version of it. Search space X is mapped into set of string S. Function X → S is called coding function, which have to be specified depending on the needs of the actual problem. Usually, S is finite set of binary strings: S = { 0 ,1} m Where m is the length of string. Generally simple binary code is used. In the process of evolution, Genetic Algorithm takes a number of binary strings of finite length as initial population and each individual is associated a fitness value corresponding to the fitness of the solution it represents. This fitness value is assigned by fitness function. Genetic Algorithm ranks individuals according to their fitness value, then selection [18] is carried out which select individuals with best fitness value and delete the not so good specimens. These individuals with high fitness can be termed as promising candidates. These promising candidates are kept and allowed to reproduce by crossover [11,19]. From them multiple copies are made, but the copies are not perfect; random changes are introduced by mutation [11] during the copying process. These offspring’s then go on to the next generation, forming a new pool of candidate solutions, and those candidate solutions which were worsened, or made no better, by the changes to their code are again deleted. These steps are repeating for each generation. Let m is space dimension and l is length of each binary string, pc is crossover probability, pm is mutation probability and n is population size. Here, stopping criteria is number of generations which is defined by the user. In each generation t, n binary strings are present which will be denoted by Bt = (b1,t ,b2,t ,……,bn,t) Basic structure of Genetic algorithm is shown here t=1 Compute initial population B1; While stopping criteria is not fulfilled DO Begin for i=1 to n DO Select best individual bi,t+1 from Bt according to fitness value for i=1 to n DO With probability pc perform crossover of bi,t+1 and bi+1,t+1 for i=1 to n DO With probability pm eventually mutate bi,t+1 end end end t=t+1; end 3. Proposed Work As we have seen that, Weighted ELM is a good approach for classification which overcomes the problem of presence of data with imbalanced class distribution in ELM and also
improves the accuracy of ELM but, it is unable to provide optimal solution because, here misclassification cost or weight, which is assigned to binary classes is inversely proportional to the number of samples or we can say that, here, dependency of weight on number of samples exist which restricts search space for finding optimal weights at which good classification accuracy can be achieved. As we have seen that, no considerable work had been done in this field till date .Therefore, in our proposed weighing scheme, we found weight with the help of Genetic Algorithm which is a global search and optimization technique which, increases search space. Then these weights are assigned directly to the binary class which eliminates the dependency on number of samples. Performance of Genetic Algorithm depends on the fitness function and genetic parameters which are selection, crossover and mutation. Here, ELM is used as fitness function and evaluation parameter is G-Mean. Weights are generated for each generation and corresponding fitness values are evaluated. In the end, output is optimal weight values and corresponding fitness value. 3.1 Algorithm of WELM_GA Notations used: Training data (T_Tra), which belongs to two classes, is given in the form of (x,T) where, x is feature and T is target whose value is either -1 or +1, N=Total Number of inputs, L=number of hidden nodes, n=Total number of features in each sample, w=Input weight between input node and hidden layer nodes, b= bias at each hidden layer node, H= Hidden layer output, β=Output weight between hidden node and output node, Y=Actual output or output layer node output, W(N x N) =Diagonal Weight Matrix for binary class, PC is crossover probability, Pm is mutation probability, m=population size, k= number of generation or iteration. Testing data(TV.T) is given in the form of (x’, T_Test), For testing H_Test is hidden layer output and Y_Test is actual output. Input: Training data consisting training samples in the T
n
form of ( xi , ti ) . Here xi = [xi1 xi2 " xin] ∈R ,
ti = [ti1 ti2 " tiv ]T ∈Rv , n is number of features in each training samples, v is number of classes. Output: Optimal misclassification weight. Algorithm: Step1: Initialize algorithmic parameters crossover probability Pc, mutation probability Pm, population size and number of generations. Step 2: Set generation index i=1 Step 3: Generate initial population m where each individual W1 is of size 1 x NumberOfClasses Step 4: do { Calculate fitness value i.e. G-Mean for each individual W1 in population m by WELM in following manner : (a) Determine diagonal weight matrix W of size N*N by following steps: for j=1 : Number of training data(T) if T( j ) =1 W (j, j)=W1(1) else W(j, j)=W1(2) end end
(b) Generate hidden node parameter i.e. input weight (w) and bias(b) by following : (i) Input weight (w) = random matrix of size (number of hidden neurons(L) x NumberOfClasses) (ii)Bias of Hidden Neurons (b) = random matrix of size (L x 1) (c) Calculate Output Weight by following: (i) Calculate hidden layer output matrix (H) =1/(1+exp((w.x+b))) (ii) Calculate output weights T T (β) =⎧⎨H (1 / C +T WHH T)WT when N is small ⎩(1 / C + H WH ) H WT when N is large
(iii) Calculate actual output Y=H*β (d) Calculate TP, TN FP, FN for training data by comparing actual output Y and expected output T for training sample e) For training sample Calculate tra_gmean = sqrt((TP/(TP+FN))*(TN/(TN+FP))); (f) return tra_gmean Step 5:Rank individuals by their fitness value Step 6: Selection of individuals which have higher fitness value Step 7: Perform crossover with probability Pc Step 8: Apply Mutation with probability Pm Step 9: i=i+1 Step10:} while(i ≤ k) Step11:Optimal solution as output WELM_GA Testing Phase: Step 1: Generate hidden node parameter i.e. input weight (w) and bias (b) by following : (i) Input weight (w)= random matrix of size(number of hidden neurons(L) x NumberOfClasses) (ii) Bias of hidden neurons(b) = random matrix of size (L x 1) Step 2: Calculate hidden layer output matrix H_Test =1/(1+exp(-(w.x’+b))) Step 3:Calculate actual output Y_Test = H_Test * β Step 4:Calculate TP, TN FP, FN for testing data by comparing actual output Y and expected output T for training sample and Y_Test and expected output T_Test for testing sample Step 5: For testing sample Calculate G_Mean = sqrt((TP/(TP+FN))*(TN/(TN+FP))) Step 6: return test_gmean 4. Experimental Set-up 4.1 Data Specification In this experiment, we apply the proposed algorithm on 16 imbalanced datasets which are downloaded online from KEEL repository [20]. These datasets are present in processed form and are undergone through process of 5fold cross validation. Attributes of datasets are normalized into range of [-1, 1]. Each dataset is present with an imbalanced ratio which is defined as, Imbalanced Ratio= $(+1)/$(-1) Where, $(+1) = number of samples belonging to positive or minority class $(-1) = number of samples belonging to negative or majority class 4.2 Evaluation Metric In this paper G-Mean is used as the evaluation parameter. After computing accuracy in each class it computes geometric mean which is square root of positive class
accuracy and negative class accuracy. G-Mean is defined as: TP TN G-Mean= * TP + FN TN + FP Table I: Specifications of Datasets Dataset
$of Train Data 268
$of Test Data 68
Imbalance Ratio
ecoli1
$of Attributes 7
ecoli2 ecoli3
7 7
268 268
68 68
5.54 8.57
ecoli4 glass0
7 9
268 173
68 43
15.75 2.09
glass1
9
171
43
1.85
glass2
9
171
43
12.15
glass4
9
171
43
16.1
glass5
9
171
43
23.43
glass6
9
171
43
6.43
Haberman
3
244
62
2.81
3.39
iris0
4
120
30
2
newthyroid1 newthyroid2 Wisconsin
5
172
43
5.14
5
172
43
5.14
9
546
137
1.86
Pima
8
614
154
1.87
4.3 Parameter settings 4.3.1 Genetic algorithm Parameters GA parameters are number of individuals, length of each individual, crossover probability, mutation probability. For two dimension misclassification weights number of individuals=30, maximum number of iteration=30. We have taken maximum value of training performance accuracy as hundred percent i.e. max_ gmean = 1 . 4.3.2 WELM parameters Here, sigmoid node G(a,b,x)=1/(1+exp(-a .x+b))) is used as activation function. Here, regularization parameter(C) is tuned for a large range from 20, 22, ....250. Best performance for each dataset is found at the particular value of hidden neuron, therefore, here hidden neurons (L) is tuned in the range 10, 20 ...100. Here in WELM_GA, five types of selection methods that are Roulette, Remainder, Stochastic, Tournament, and Uniform are used. In Genetic Algorithm due to lack of diversity in population a problem of premature convergence in a local optimum arises. To solve this problem heuristic crossover [19] is used.. 4.4 Experiment Results We have compare WELM and WELM_GA on 16 binary datasets. For 16 binary dataset we have taken WELM results directly from [9]. In WELM two weighing schemes results using sigmoid function are represented. We are comparing our WELM_GA results with the results of WELM. Table II gives testing data performance in terms of G-mean for binary datasets. Performance in terms of G-Mean is significant for imbalanced data so we have shown here only G-Mean. Table III gives average performance accuracy of test data in terms of G-
Mean for sigmoid function only. It can be proved from Table III that WELM_GA is better than Weighted ELM W1 and Weighted ELM W2. WELM_GA outperforms Weighted ELM in 16 datasets and it can be easily seen in Table II. For each dataset such as ecoli3, glass4, glass5, haberman and glass6, the improvement in WELM_GA with respect to Weighted ELM is 3-
5%.Table III shows that WELM_GA has average 2% improvement over Weighted ELM W1 & Weighted ELM W2.
Table I: It contains the best values of ELM, WELM and WELM_GA for each data set WELM_GA
Dataset Weighted ELM W1
Weighted ELM W2
ecoli1
GMEAN 0.9069
GMEAN 0.9026
REMAINDER (C,L) GMEAN (216,30) 0.9292
ROULETTE (C,L) GMEAN (216,20) 0.9253
STOCHASTIC (C,L) GMEAN (216,30) 0.9212
TOURNAMENT (C,L) GMEAN (216,10) 0.9227
UNIFORM (C,L) (216,10)
GMEAN 0.9164
ecoli2
0.9391
0.9451
(236,10)
(236,10)
(236,10)
(236,10)
(236,10)
0.9477
ecoli3 ecoli4
0.9017 0.9783
0.9 0.959
SELECTION TECHNIQUE
44
(2 ,10) 4
(2 ,40) 14
0.943 0.9485 0.992
44
(2 ,10) 4
(2 ,40) 14
0.9439 0.9485 0.9936
44
(2 ,10) 22
(2 ,20) 14
0.9413 0.9432 0.9905
44
(2 ,10) 4
(2 ,50) 14
0.9458 0.9503 0.9936
44
0.9448
4
0.9936
14
(2 ,10) (2 ,30)
glass0
0.8117
0.8262
(2 ,10)
0.831
(2 ,10)
0.8266
(2 ,10)
0.8259
(2 ,20)
0.8245
(2 ,10)
0.8119
glass1
0.7831
0.7932
(216,30)
0.7883
(216,30)
0.7745
(216,30)
0.7629
(216,30)
0.7857
(216,30)
0.7596
glass2
0.8033
0.8334
(228,10)
0.8059
(228,10)
0.7882
(228,10)
0.7996
(228,10)
0.7907
(228,10)
0.7782
glass4
0.9134
0.9146
(234,10)
0.995
(234,10)
0.995
(234,10)
0.9875
(234,10)
0.99
(234,10)
0.9925
glass5
0.9599
0.966
(220,20)
0.9975
(220,10)
0.9951
(220,30)
0.9975
(220,20)
0.9975
(220,30)
0.9925
20
20
20
20
20
glass6
0.9572
0.959
(2 ,10)
0.9806
(2 ,10)
0.9746
(2 ,10)
0.9746
(2 ,10)
0.9746
(2 ,10)
0.9719
haberman
0.6511
0.5926
(250,10)
0.7037
(212,10)
0.7134
(20,50)
0.7111
(24,40)
0.7069
(24,10)
0.7071
16
16
16
16
16
iris0
1
1
(2 ,10)
1
(2 ,10)
1
(2 ,10)
1
(2 ,10)
1
(2 ,10)
1
newthyroid1 newthyroid2 wisconsin
0.9944
0.9972
(216,10)
1
(216,10)
1
(216,10)
1
(216,10)
0.9972
(216,10)
0.9972
0.9972
1
(216,10)
0.9972
(216,10)
0.9972
(216,10)
0.9972
(216,10)
0.9972
(216,10)
0.9972
0.9707
0.9697
(246,10)
0.9798
(210,10)
0.9822
(244,10)
0.9801
(20,10)
0.9795
(20,10)
0.9776
Pima
0.7474
0.7151
(20,30)
0.7139
(20,40)
0.7123
(20,40)
0.717
(20,50)
0.7098
(250,30)
0.708
Table II: Table containing the Average Testing Accuracy of all data sets Method
Average testing Accuracy of all datasets
Unweighted ELM
0.854125
Weighted ELM W1
0.894713
Weighted ELM W2
0.892106
WELM_GA REMAINDER 0.9129
SELECTION TECHNIQUE ROULETTE STOCHASTIC TOURNAMENT 0.9107 0.9094 0.9104
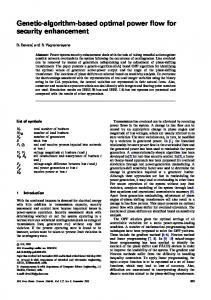
Fig.2. Graphs showing pattern between WELM_GA and WELM 4.4.1 Misclassification weights
Misclassification weights for all binary datasets are given in Table IV. Ratio of minority weight and majority weights are given. Clearly all these ratio are not equivalent to their corresponding data imbalanced ratio given in Table I. This fact clearly indicates that there are some more factors apart from
imbalance ratio which affects generalization performance. These factors are not captured by WELM methods weighting scheme but our algorithm captures these hidden factors also. That’s why WELM_GA algorithm gives better performance.
UNIFORM 0.906
Table IV Misclassification weights
Dataset
ecoli1 ecoli2 ecoli3 ecoli4 glass0 glass1 glass2 glass4 glass5 glass6 Haberman iris0 new-thyroid1 new-thyroid2 Pima Wisconsin
Remainder Misclassification Weight Minority Majority Instance Instance Weight Weight 1.1751 0.9895 1.2593 0.6394 1.1148 0.9881 1.7541 0.8674 1.7412 0.9466 6.8745 .4097 6.5871 0.9583 2.9636 0.2502 1.7654 0.0987 2.7896 0.6754 1.0381 0.2411 1.9879 0.9145 1.9085 0.5087 1.7337 0.3260 1.0618 0.9674 1.3911 0.7246
Roulette Misclassification Weight Minority Majority Instance Instance Weight Weight 1.0573 0.8760 3.5216 0.9326 1.1951 0.7958 1.4912 0.5130 1.0111 0.8253 7.7444 0.4592 5.6501 0.5828 2.7683 0.2348 2.4367 0.1276 3.7897 0.7654 2.1071 0.7940 1.5687 0.8744 2.3450 0.6125 2.3330 0.8871 1.0474 0.9785 2.0601 0.8664
5. Conclusion This work proposes WELM_GA for imbalanced data, which improves the performance of WELM and gives optimal misclassification weights for instances of each class. The experiment results show clear improvement of WELM_GA on WELM. Misclassification weight ratio of minority and majority samples for binary datasets are not References [1] D.Rumelhart , G. Hinton, R.Williams, "Learning representations by back-propagation errors", Nature, pp. 533– 536, 1986. [2] G.-B.Huang, Q. Zhu, C. Siew, "Extreme Learning Machine: A New Learning Scheme of Feedforward Neural Networks. International Joint Conference on Neural Networks", pp. 985– 990, 2004. [3] G.-B.Huang, Q. Zhu, C. Siew, "Extreme learning machine: Theory and applications. Neurocomputing 70", vol. 1 issue 3, pp. 489-501, 2006. [4] G.-B.Huang, X. Ding, H. Zhou, "Optimization method based extreme learning machine for classification. Neurocomputing", pp. 155-163, 2004. [5] G.-B.Huang, L. Chen, C. Siew,"Universal approximation using incremental constructive feedforward networks with random hidden nodes", IEEE Transactions on Neural Networks, pp.879-892, 2006. [6] G.-B.Huang, H. Zhou, X. Ding, R. Zhang, "Extreme Learning Machine for Regression and Multiclass Classification", IEEE Transactions on Systems, Man, and Cybernetics, Part B, pp. 513-529, 2012. [7] H, He, E. Garcia, "Learning from Imbalanced Data. IEEE Transactions on Knowledge And Data Engineering", pp. 12631284, 2009. [8] W. Deng, Q. Zheng, L. ChenL., "Regularized Extreme Learning Machine. IEEE Symposium on Computational Intelligence and Data Mining". pp. 389 - 395, 2009. [9] W. Zong, G.-B.Huang, Y. Chen, "Weighted extreme learning machine for imbalance learning. Neurocomputing", pp. 229-242, 2013. [10] J. Holland, "Adaptation in Natural and Artificial Systems. University of Michigan Press, Ann Arbor, Michigan; re-issued by MIT Press", 1992. [11] M. Srinivas, L. Patnaik, "Genetic algorithms: A survey IEEE" pp. 17-26, 2009.
SELECTION TECHNIQUE Stochastic Misclassification Weight Minority Majority Instance Instance Weight Weight 1.1506 0.6627 2.4136 0.9409 1.0630 0.9790 1.8794 .9878 1.8323 0.6856 3.0014 0.3682 8.9846 0.4994 3.2465 0.2789 1.9870 0.0987 2.0987 0.4587 2.4219 0.9817 1.4846 0.6518 2.9806 0.6349 2.7582 0.9755 1.0276 0.9900 1.4509 0.4845
Tournament Misclassification Weight Minority Majority Instance Instance Weight Weight 1.0117 0.9322 2.2620 0.6725 1.2987 0.8769 1.8404 0.3162 1.5801 0.9205 2.1793 0.2256 7.3667 0.7620 3.5643 0.3324 2.0987 0.1093 3.8722 0.8787 2.3998 0.6901 1.6750 0.9043 1.7867 0.5028 1.8533 0.8341 1.0012 0.9906 2.1932 0.5601
Uniform Misclassification Weight Minority Majority Instance Instance Weight Weight 1.0948 0.8751 2.9871 0.9708 1.1820 0.9631 2.1417 0.2977 1.5390 0.3362 8.6772 0.8087 7.0019 0.5362 3.4567 0.3126 2.1789 0.1098 2.9876 0.6435 3.6928 0.9727 1.8769 0.9876 1.4598 0.4098 2.0375 0.6950 1.1943 0.7444 1.0316 0.9906
equivalent to their imbalance ratio for all datasets. As a future work, we assign different weights to each instance which explores data complexity within the class. But, it increases dimension of search space. Therefore, optimization techniques which work well with large dimension search space should be use. [12] C. Rao, S. Mitra, "Generalized inverse of a matrix and its applications. In: Proceedings of the Sixth Berkeley Symposium on Mathematical Statistics and Probability, Volume 1: Theory of Statistics, Berkeley, Calif. Sixth Berkeley Symposium on Mathematical Statistics and Probability. University of California Press", pp 601-620, 1972. [13] D. Serre, "Matrices:Theory and Applications. SpringerVerlag, New York, Inc", 2002. [14] R. Fletcher, "Practical Methods of Optimization: Constrained Optimization. Wiley, New York 2", 2002. [15] C. Reeves, "Genetic Algorithms. In: Glover F, Kochenberger G (eds) Handbook of Metaheuristics, vol 57. International Series in Operations Research & Management Science. Springer US," pp 55-82. doi:10.1007/0-306-48056-5_3, 2003. [16] M.Mitchell, "An introduction to genetic algorithms. MIT Press", 2003. [17] R. Sharapov, "Genetic Algorithms: Basic Ideas, Variants and Analysis. In: Vision systems: segmentation and pattern recognition" pp 407-422, 2007. [18] R. Sivaraj, T. Ravichandran, "A Review of selection methods in genetic algorithm. International Journal of Engineering Science & Technology" vol. 3 issue 5, pp. 37923797, 2011. [19] F. Herrera , M. Lozano, "Heuristic crossovers for real-coded genetic algorithms based on fuzzy connectives. In: Voigt H-M, Ebeling W, Rechenberg I, Schwefel H-P (eds) Parallel Problem Solving from Nature — PPSN IV, vol 1141. Lecture Notes in Computer Science. Springer Berlin Heidelberg", pp 336-345. doi:10.1007/3-540-61723-X_998, 1996. [20] J. Alcala-Fdez , A. Fernandez, J. Luengo, Derrac J., S. Garcia, "KEEL Data-Mining Software Tool: Data Set Repository, Integration of Algorithm and Experimental Analysis Framework. Multiple-Valued Logic and Soft Computing 17" vol. 2 issue3, pp.255-287, 2011. [21] G.Huang, G.-B.Huang, S.Song, K.You, "Trends in extreme learning machines: A review. Neural Networks", pp.32-48, 2015.