The instances are divided in two classes: positive and negative class. ... class includes pairs of proteins which appear in some of the databases .... training set.
Genetic Programming for Predicting Protein Networks Beatriz Garcia, Ricardo Aler, Agapito Ledezma, and Araceli Sanchis Universidad Carlos III de Madrid, Computer Science Department Avda. de la Universidad 30, 28911, Leganes, Madrid, Spain {beatrizg,aler,ledezma,masm}@inf.uc3m.es
Abstract. One of the definitely unsolved main problems in molecular biology is the protein-protein functional association prediction problem. Genetic Programming (GP) is applied to this domain. GP evolves an expression, equivalent to a binary classifier, which predicts if a given pair of proteins interacts. We take advantages of GP flexibility, particularly, the possibility of defining new operations. In this paper, the missing values problem benefits from the definition of if-unknown, a new operation which is more appropriate to the domain data semantics. Besides, in order to improve the solution size and the computational time, we use the Tarpeian method which controls the bloat effect of GP. According to the obtained results, we have verified the feasibility of using GP in this domain, and the enhancement in the search efficiency and interpretability of solutions due to the Tarpeian method. Keywords: Protein interaction prediction, genetic programming, data integration, bioinformatics, evolutionary computation, machine learning, classification, control bloat.
1 Introduction Nowadays, one of the challenges for molecular biology is to manage the huge amounts of genomic and proteomic data, which are increasing exponentially. The analysis of these data requires automatic methods in order to discover useful knowledge, which is infeasible with manual (i.e. visual inspections) techniques. A significant part of the biological diversity and complexity is coded in the functional associations between molecules, such as the proteins [1]. Thus, understanding the protein interaction networks is essential to identify, explain and regulate the biological process dynamics in living systems. Therefore, if it is known how the cells in the organism work at molecular level, it will be possible to regulate certain processes, intervening in the appropriate interaction. Traditionally, physical interactions or functional associations are detected by using experimental techniques [2] which are costly in resources and time. As a consequence, in recent years, an increasing interest in computational prediction methods which reduce these costs has arisen [3, 4, 5]. However no approach is the most suitable for each and every one of the protein pairs. Furthermore, the results about the analysis of proteins and their interactions (both at experimental and computational levels) are not unified; as well as, the information is distributed among multiple databases [6]. H. Geffner et al. (Eds.): IBERAMIA 2008, LNAI 5290, pp. 432–441, 2008. © Springer-Verlag Berlin Heidelberg 2008
1
Genetic Programming for Predicting Protein Networks
433
In addition, comparing and combining data from different sources is very complicated, especially in protein-protein functional associations. This complexity is due to the respective biases of each source [7]. Moreover, most of the methods which determine functional associations lead to a significant number of false positives. Also, some methods have difficulties for retrieving particular types of interactions [7]. As a consequence of the previous aspects, the overlap among the outputs of the different methods is small. For this reason, the protein pairs predicted by these methods are complementary to each other. In other words, each method covers only a subset of the whole interaction network of the organism. In this paper we intend to approach the problem of protein-protein functional association prediction, integrating the several available data sources, in order to centralize the current predictions, as a binary classification problem. This problem can be tackled by traditional Machine Learning methods and indeed, we will test them in this paper. But our long-term aim is to apply GP to this biological domain because of GP's potential flexibility. Genetic Programming (GP) is a technique to automatically evolve computer programs [8]. In this paper, GP will be used to obtain an equation equivalent to a binary classifier. One of the reasons for choosing GP is that this technique allows the designer to define the primitives according to the requirements of the application domain. For example, we define the if_unknown (if_?) operator (explained below) in order to try to solve the missing values problem, which is a relevant question in this biological domain, because there is a great deal of them in the data sets. A missing value is a feature without a known value in some of the instances. The most commonly used approaches to handle missing values in the Machine Learning literature are: (1) ignoring the complete instance or (2) filling in with the mean value for the feature. The first approach is appropriate when there are few missing values. However, in our domain almost all the instances have some missing values, and if these instances are ignored, the data is reduced considerably, down to less than 0.005%. The second approach gets a suitable approximation when there is noise while the data are collected, and consequently some values are missed or forgotten. But this is not our case, because it does not reflect the semantics of the actual data: most of our missing values represent non-existing data in a particular database (as opposed to unknown or forgotten). This is because the data sources (the output of several computational prediction methods) give an output only if all the method constraints are fulfilled. Therefore, you can not suppose any mean value as valid. Then the best solution is to manage missing values as special values. Thus, in this paper we handle the non-existent values in a special way, with two new approaches: (1) replacing non-existent values with a specific numerical flag or (2) preserving the unknown in the data sets (represented by ‘?’). A drawback of the first approach is that numerical values now have two different semantic interpretations: actual values and flags. However, using the second approach a more meaningful representation is obtained in terms of biological interpretation. These new approaches for handling missing values are evaluated in the results section. Furthermore, it is well known that GP suffers from the bloat problem [9]. That is, GP individuals tend to grow in size without apparent gain in fitness. Hence, to try to improve the accuracy and readability of equations evolved by GP, we use the Tarpeian bloat control mechanism, which biases evolution towards simple solutions [10]. We also expect that the Tarpeian method will speed-up the evolution of solutions. 2
434
B. Garcia et al.
This paper is organized as follows: Section 2 presents a brief introduction to the GP. In Section 3, the application domain, with the used information sources, is explained. Section 4 describes how to design the problem to apply GP. Results for the experimental phase are shown in Section 5. Finally, in Section 6, conclusions and future work are summarized.
2 Genetic Programming Genetic programming (GP) is an evolutionary paradigm which applies genetic algorithms to breed computer programs automatically [8]. Each individual in the population is traditionally represented like a tree structure, with terminals in the leaves and operators or functions in the internal tree nodes. The fitness is determined by the individual performance in the specific task. Excessive tree growth or bloat often happens in GP, greatly slowing down the evolution process [9]. Code bloat has three negative effects. First, individuals are difficult to understand by human users. This aspect may be important in protein interactions, if persons want to understand what GP learned after the evolution process. Second, it makes the evolution process very slow, because it takes longer to evaluate oversized individuals. And finally, and in the context of classification problems, oversized individuals may have a poor accuracy, because they tend to overfit the data. The Tarpeian method [10], a well-founded bloat-control technique is applied in this research. Briefly, this method will stochastically abort some individuals in the evolution process, if its tree size is bigger than the average (in nodes or depth) in the population of the last generation. So, the solution size is limited in a flexible way and, decreasing the tree size, will improve its interpretation. It also reduces the execution time, since these individuals are not evaluated, and their fitness is the worst possible value. In addition, in learning tasks, reducing tree size is akin to Occam’s Razor, and may improve prediction accuracy.
3 Protein-Protein Functional Association Prediction Problem A pair or set of proteins interacts if they are associated by the function carried out. This is the definition of functional association used in this research. It means functional interaction, instead of physical one. In this work, the application domain for the prediction task is the proteome of a specific procariota organism: Escherichia Coli (E.coli). It has 4,339 known proteins, whose functional interactions have to be determined. The five computational methods used in this research are based on different evidences indicating if a pair of proteins physically or functionally interacts. The underlying fundamentals of every method are different [3]. The database sources where the 89,401 positive instances (without overlaps) are retrieved are BIND, DIP, IntAct, EcoCyc, KEGG, iHoP and Butland’s set [11]. The number of pairs from each database is 58, 401, 2,684, 64,357, 20,860, 6,686, and 4,745, respectively. Each one contains information about evidence which indicates the possibility of an interaction between pairs of proteins. These databases can be grouped in several categories, according to the considered proof: 3
Genetic Programming for Predicting Protein Networks
435
A ) Pairs of proteins with a physical interaction, verified with experiments in a laboratory. Sources: BIND, DIP and the Butland’s set. B ) Proteins belong to the same molecular complex. Sources: IntAct and EcoCyc complex. C ) Databases which take into account the co-regulation and regulation processes in the gene transcription. They include pairs of proteins (related with a specific gene) expressed at the same time, or when a protein catalyses a chemical reaction in order to the expression of the other gene to occur. Sources: EcoCyc regulated and EcoCyc coregulated. D ) Pairs of proteins which appear in the same metabolic pathway. Sources: EcoCyc functional associations and KEGG. E ) Databases with data retrieved from the scientific literature, using text mining tools. Source: iHoP. Before beginning the description, it must be noted that there are several difficulties inherent to the nature of these biological data, which complicate solving successfully this task with a Genetic Programming or Machine Learning approach. The most important problems are: the intrinsic uncertainty in input data; the highly uneven distribution between the number of instances in the positive and negative classes (in general, the positive class means less than 1% instances); and the high percentage of missing values in several attributes (only 82 instances over 2,665,180 have a known value for the whole features).
4 Experimental Set Up This section describes the necessary elements in order to apply GP to solve the protein-protein functional association prediction problem. lilgp 1.1 [12] is the GP tool used in the experimental phase. It is based on the first two Koza's books [8]. 4.1 Data Set Representation The data are represented in attribute-value pairs in order to be able to apply both GP and Machine Learning techniques. We define 9 features. On the one hand, 5 scores from five prediction computational methods [3] based on different evidences. On the other hand, 4 biological characteristics, the number of orthologous sequences and the length sequence, for every protein in the pair; both are ordered as minimum and maximum value for the pair. The instances are divided in two classes: positive and negative class. The positive class includes pairs of proteins which appear in some of the databases previously mentioned. The pairs of proteins in the negative class are extracted applying something similar to the “Closed-World assumption”, which, in this domain, means that every pair of proteins whose functional associations has not been reported explicitly (i.e., that pair does not appear like a positive instance), is considered a pair which does not interact (i.e., a negative instance). Thus, the number of negative instances is very high (a total of 99% in all possible interactions set), due to the combinatorial explosion coming from the 4,339 proteins in E.coli, resulting in 9,411,291 possible interaction pairs. 4
436
B. Garcia et al.
Therefore, filters are applied to reduce this high quantity of negative instances. One filter only chooses the instances which have their two proteins belonging to pairs from the positive class. Another one removes homodimers pairs. Also, the instances without any known score are left out. To sum up briefly, the total number of available instances is reduced to 264,752 (16,566 positive and 248,186 negative ones). For experimental reasons, train and test set have 10,000 instances each one, randomly chosen in each class among the available ones. The number of instances from the positive class and from the negative class is the same (5,000) in order to avoid the uneven distribution class problem (explained above). 4.2 Solution Coding In GP, it is necessary to define the elements which are part of the trees that represent the different individuals in the population (i.e., the terminals and the operators). There are 10 terminals: the 9 attributes explained above and 1 ERC (Ephemeral Random Constant) that represents any random numerical constant which can appear several times along the evolution process. Its value range is [0, 1]. Operational closure is a typical requirement in GP. So, all the terminals should have a value in any input instance. Therefore, the high quantity of missing values (or rather non-existing values in our domain) must be handled in a special way. In a first approach, we fill the non-existent values in with a specific flag: a numerical constant very different from the rest of the feature value (0 or -1, according to the minimum value reached in each terminal). Besides, all the terminals are normalized, in order to homogenize the results. The operators used are the arithmetical ones (+, -, * and protected /), the conditional one [if (a>=b) then x else y], and finally one new specific operator, tailored for this domain: if_? [if (k is unknown) then x else y]. This operator is defined as a second approach in order to manage the missing values, doing the non-existing values very different from the rest. So, when this operator is used, the missing values are preserved, without replacing them with any numerical constant (0 or -1). The rest of operations are operationally closed always returning the unknown value ('?') if any of their input values is '?'. 4.3 Evolutionary Process Firstly, in order to predict functional association between two proteins (p1, p2), the evolved individual f, is applied to them, and a threshold is used to give a positive or a negative class. Hence, if (f >= threshold) then (p1, p2) functionally interact; else (p1, p2) do not interact. In all the experiments presented in this work, the threshold is 0.5. The fitness function in this work is the accuracy, it means, the percentage of correctly classified instances, in other words, fitness=(TP+TN)/(TP+TN+FP+FN), according to the definition of True Positives (TP), True Negatives (TN), False Positives (FP) and False Negatives (FN) in [13]. In the evolutionary process, there are many parameters which must be set, resulting in different configurations for the experiments. A complete list, their meaning and a detailed description appears in the lilgp manual [12]. In addition, a new parameter is added to the lilgp tool: the Tarpeian factor. It is the probability of aborting an individual if its size is bigger than the average. 5
Genetic Programming for Predicting Protein Networks
437
The main parameters have been tuned within the range of values shown in Table 1. An appropriate configuration for the parameters has been found from a few preliminary experiments (see Table 2). The parameters in the base configuration were obtained from our preliminary tests, except for the maximum depth and individual selection method, which are the default values in the aforementioned Koza work [8]. Table 1. Range of values of the main parameters
Table 2. Values of the main parameters in the base configuration, without bloat control
Parameter
Range of values
Parameter
Population size No. generations Maximum depth Maximum no. nodes Tree operators Genetic operators (probability)
1,000 - 25,000 15 - 250 17 25 - 300 +, -, *, /, >=, if_? crossover (0.3 - 0.9) reproduction (0.1 - 0.4) mutation (0.0 - 0.4)
Population size No. generations Maximum depth Maximum no. nodes Tree operators Genetic operators (probability)
Individuals selection method Tarpeian factor
tournament (size=7) 0.0 - 0.9
Value 1,000 50 17 200 +, -, *, /, >= crossover (0.5) reproduction (0.1) mutation (0.4)
Individuals selection method Tarpeian factor
tournament (size=7) 0.0
5 Results This section presents the results after applying GP to the protein-protein functional association prediction problem. All the configurations displayed come from averaging 30 GP runs. In the base configuration a test accuracy of 60.83% on average and 61.44% for the best run are obtained, with a very low variance in both train and test. 5.1 Comparison with Other Machine Learning Techniques Table 3 summarizes results from other Machine Learning techniques (from the Weka [14]) in order to make a comparison. All the parameters follow default Weka options. Table 3. Genetic Programming and Machine Learning: accuracy comparison
Algorithm GP ADTree AODE KStar MLP PART Simple Logistic SMO
% Train
% Test
62.34 / 62.92 61.28 62.48 98.86 58.85 64.06 60.29 59.17
60.83 / 61.44 60.02 61.32 61.60 58.22 61.96 60.70 59.96
% Test with unknown values 60.67 / 61.22 60.35 58.99 58.92 60.00 58.33 57.61 57.62
Test Sensitivity
Test Specificity
TP/TP+FN
TN/TN+FP
58.87 / 63.54 62.62 / 59.34 64.56 48.60 60.24 20.40 60.84 56.34 56.98
55.48 74.04 62.96 96.06 63.08 65.06 62.94 6
438
B. Garcia et al.
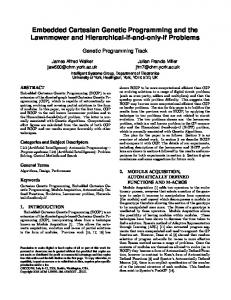
Train and test results (first and second columns in table 3) are very close; accordingly we can assume that there is no overfitting. Table 3 shows that the accuracy in both train and test is nearly the same in all classifiers, with values around 60-61% in test (in GP, 60.83% on average and 61.44 for the best run). The single exception is Kstar in train which reaches an accuracy of almost 99%, because it stores the whole training set. In conclusion, GP gets accuracy about as high as most of traditional Machine Learning algorithms that we have tested. Besides, the two last columns show sensitivity and specificity. Interpreting these measures as performance by class, the former for the positive class and the latter for the negative class, it can be noted that almost all algorithms get similar correct predictions in both classes. The exceptions are AODE and MLP, which are biased towards only the negative class, and the instances from the positive class are predicted worse than random. The mix of the different data sources, the several transformations in attributes and the instances selection processes are very specific to this research. Therefore, it is very difficult to make a comparison with other protein-protein functional association prediction methods, which have their own biases. 5.2 Changing Significant Parameters: If_? Operator and the Tarpeian Method This section describes what happens when a new operator is added to the existing arithmetical and conditional ones: it is if_?. It tries to manage the missing values problem which is very important in this domain due to its huge number in several features, as it was mentioned above. In the same way, the effects derived from the application of Tarpeian control bloat method are analyzed. 5.2.1 Missing Values Handling Comparison Two different approaches for missing values handling are validated in this section. The former fills them in with a specific numerical flag (base configuration). The latter one preserves the missing values in the data, and each algorithm uses its own criteria for processing them. For example, GP adds the new operator (if_?), and Weka algorithms fill in with the mean or ignore the complete instance (see Introduction section for a more detailed explanation about missing values in this domain). The second and third columns in table 3 show the test accuracy corresponding to the first and the second approach, respectively. Then, when the test accuracy column (the second one) is analyzed PART is slightly better than GP. However, looking at the third column, GP shows the highest value. It means, if unknown values are preserved in the data set, GP outperforms the other Machine Learning algorithms. 5.2.2 Different Configurations Comparison Table 4 and Figure 1 show how several measures (such as train and test accuracy, tree size and execution time) change for six different experiment configurations. Base is the best configuration found, without bloat control, whose parameters were mentioned previously. Base without limit means the base configuration but without restricting the maximum tree size. If_? refers to base configuration including this new operator (see solution coding section for a description of if_? operator). Finally, Tarpeian configuration includes this control bloat method and the without limit characteristic. if_? & 7
Genetic Programming for Predicting Protein Networks
439
size(nodes) & tim e(secs)
without limit and if_? & Tarpeian are configurations which includes the elements of both of them. In Figure 1, the Y-axis quantifies size (in number of nodes) and time (in seconds). The scale is the same for both measures. Table 4. Influence of if_? and Tarpeian: train and test accuracy Id Configuration a b c d e f
base base without limit if_? if_? & without limit Tarpeian if_? & Tarpeian
% Train % Test 62.34 62.40 61.38 61.33 60.89 60.53
60.83 60.93 60.67 60.65 60.43 60.27
350 0
No.nodes Tim e
300 0 250 0 200 0 150 0 100 0 500 0
a
b
c d configuration
e
f
Fig. 1. Influence of if_? and Tarpeian: tree size and time average
Table 4 shows that the test accuracy is almost constant in all configurations, around 60.5%; while the train accuracy slightly goes down, when the if_? operator or/and the Tarpeian method are included. However, with reference to tree size (number of nodes) and time (see Figure 1), the values for the configurations with the if_? operator or the Tarpeian method are considerably lower than others. With the Tarpeian method the reduction is bigger than with the if_? operator, and even more when both are used together. From configuration ‘b’ to ‘f’, on average, the size decreases in more than 638 nodes and the time in almost 3000 seconds. Moreover, when the if_? operator or the Tarpeian method is applied the solution size (i.e. number of nodes) is quite shorter than in PART algorithm, which is the best Machine Learning algorithm according to test accuracy (see previous section). In the decision list from PART there are 250 nodes (operands and operators) and in GP solution trees with ‘f’ configuration 38 nodes on average. In conclusion, the if_? operator and the Tarpeian method reduce tree size and time, dropping scarcely test accuracy. To sum up, as discussed previously, decreasing the tree size, only implies a scarcely lower accuracy than the base configuration. Nevertheless, the obtained trees have an easier interpretation and a very much faster evolution process. Therefore, it seems convenient to include in the solution both the if_? operator and the Tarpeian method.
6 Conclusions and Further Work In this paper, we have applied Genetic Programming (GP) to the protein-protein functional association prediction problem. Our initial work shows that GP manages to 8
440
B. Garcia et al.
obtain accuracy results similar to other Machine Learning methods (around 61%). The GP individual takes into account the intrinsic complexity which entails the biological nature of the data and its associated meaning. Besides, the predictor integrates information from different sources related with protein functional association, existing until now. We have taken advantage of the flexibility offered by GP to define primitives in order to be closer to the real world problem conditions. We use a new operator (if_?) that takes into account the large number of unknown values in the data. GP gets to handle missing values slightly better than the rest of Machine Learning algorithms tested, in the sense that classification accuracy does not decrease significantly when missing values are used directly. GP typically suffers from bloat, that is, the increase in size of the individuals with no apparent gain in fitness. In this paper, we have managed to reduce bloat by means of the if_? operator and the Tarpeian method. Some of the negative effects of bloat are controlled in this domain. First, the tree size has been reduced, even with respect to Machine Learning algorithms, therefore improving interpretation of the individuals. Second, the execution time goes down, due to do not wasting evaluating excessive big trees, improving the efficiency of the GP system. Both effects are achieved with almost no decrease in accuracy. We believe that results could be improved further. The fitness function we have used is straightforward and perhaps more elaborate functions could achieve better results. In particular, our fitness functions measures only accuracy, but in this domain true positives is more important than true negatives, and this could be addressed very easily by GP. Extending the terminal and function set, and using ADFs [8] is also a plausible option, as well as using recent improvements over the Tarpeian method [9, 15]. Another interesting possibility would be to study if the output numerical value is suitable as functional association likelihood.
Acknowledgments Data used in these experiments has been obtained in support of the Structural Computational Biology Group in Spanish National Cancer Research Centre (CNIO).This work has been supported by CICYT, TRA2007-67374-C02-02 project.
References 1. Rojas, A., Juan, D., Valencia, A.: Molecular interactions: Learning form protein complexes. In: Leon, D., Markel, S. (eds.) Silico Technologies in Drug Target Identification and Validation, vol. 6, pp. 225–244 (2006) 2. Causier, B.: Studying the Interactome with the Yeast Two-Hybrid System and Mass Spectrometry. Mass Spectrom. Rev. 23, 350–367 (2004) 3. Valencia, A., Pazos, F.: Computational Methods for the Prediction of Protein Interactions. Curr. Opin. Struct. Biol. 12, 368–373 (2002) 4. Fraser, H.B., Hirsh, A.E., Wall, D.P., et al.: Coevolution of Gene Expression among Interacting Proteins. Proc. Natl. Acad. Sci. U. S. A. 101, 9033–9038 (2004) 9
Genetic Programming for Predicting Protein Networks
441
5. Yu, H., Luscombe, N.M., Lu, H.X., et al.: Annotation Transfer between Genomes: Protein-Protein Interologs and Protein-DNA Regulogs. Genome Res. 14, 1107–1118 (2004) 6. Gómez, M., Alonso-Allende, R., Pazos, F., et al.: Accessible Protein Interaction Data for Network Modeling. Structure of the Information and Available Repositories. Transactions on Computational Systems Biology I, 1–13 (2005) 7. Mering, C.v., Krause, R., Snel, B., et al.: Comparative Assessment of Large-Scale Data Sets of Protein-Protein Interactions. Nature 417, 399–403 (2002) 8. Koza, J.: Genetic programming II. MIT Press, Cambridge (1994) 9. Mahler, S., Robilliard, D., Fonlupt, C.: Tarpeian Bloat Control and Generalization Accuracy. In: Keijzer, M., Tettamanzi, A.G.B., Collet, P., van Hemert, J., Tomassini, M. (eds.) EuroGP 2005. LNCS, vol. 3447, pp. 203–214. Springer, Heidelberg (2005) 10. Poli, R.: A Simple but Theoretically-Motivated Method to Control Bloat in Genetic Programming. In: Ryan, C., Soule, T., Keijzer, M., Tsang, E.P.K., Poli, R., Costa, E. (eds.) EuroGP 2003. LNCS, vol. 2610, pp. 204–217. Springer, Heidelberg (2003) 11. Butland, G., Peregrin-Alvarez, J.M., Li, J., et al.: Interaction Network Containing Conserved and Essential Protein Complexes in Escherichia Coli. Nature 433, 531–537 (2005) 12. Zongker, D., Punch, B.: Lil-Gp Genetic Programming System (1998), http://garage.Cse.Msu.edu/software/lil-Gp/ 13. Fawcett, T.: ROC Graphs: Notes and Practical Considerations for Data Mining Researchers (2003) 14. Witten, I.H., Frank, E.: Data mining: Practical machine learning tools and techniques, 2nd edn. Morgan Kaufmann, San Francisco (2005) 15. Poli, R., Langdon, W., Dignum, S.: On the Limiting Distribution of Program Sizes in Tree-Based Genetic Programming. In: Ebner, M., O’Neill, M., Ekárt, A., Vanneschi, L., Esparcia-Alcázar, A.I. (eds.) EuroGP 2007. LNCS, vol. 4445, pp. 193–204. Springer, Heidelberg (2007)
10