Kenneth J. Osborn, United States-Mexico Transboundary. Aerial Photography and Mapping Initiative. Anne J. Obee, Ernst C. Griffin, and Richard D. Wright, Us-.
GIs and Image Understanding for Near-RealTime Earthquake Damage Assessment Paolo Gamba and Fabio Casciati
Abstract This paper evolved from the results of RADATT (RApid Damage Assessment Telematic Tool), a project funded b y the European Commission, whose goal was to sensibly reduce the effects of a devastating seismic event b y providing the responsible agencies a rapid and reliable damage detection and estimation of the extent and location of the suffered area. This result was accomplished b y the integration, within a single user interface environment, of data access and standardization techniques, image processing tools, and GIS technology. A two-phase operating model has been conceived. In the pre-event era, images and data about buildings and infrastructures are collected and analyzed exploiting GIS capabilities. Immediately after the occurrence of the earthquake, the system must be ready to receive near-real-time imagery of the affected area to be compared with the pre-event data set. In this paper the capability of this quick change-detection analysis, given the availability of the pre-event information i n the GIs environment, i s discussed.
Introduction Recent natural disasters have stressed the importance of a rapid and reliable damage assessment and loss estimate in order to face both short- and long-term emergency response. It has been demonstrated that the entity of earthquake damage is only partly due to the strength of the natural event; it also depends on the delay and inadequacy of the rescue and reconstruction intervention. A reliable post-disaster damage assessment would allow the guarantee of rapid emergency response, and sensibly reduce the effects by providing an immediate estimate of the extent and location of the damaged area and making this knowledge available to the responsible agencies. Moreover, it should be pointed out that, in case of suddenly occurring natural disasters, the identification of damage by means of analytical models alone is often unreliable because soil conditions, geological complexities, and different environmental aspects may result in difficult to predict damage patterns. On the other hand, recent developments in image analysis techniques allow their integration with loss estimation and vulnerability models and make possible the investigation of more complex and effective approaches to the task of developing a reliable system for damage assessment. This paper outlines the principal issues for the development of a software system for damage and loss estimation in an emergency due to earthquake disasters. This goal is achieved by integrating, within a single user interface environment, existing database information, GIS (geographic information system) technology, and image processing techniques. First, a P. Gamba is with the Dipartimento di Elettronica, while F. Casciati is with the Dipartimento di Meccanica Strutturale, Universitg di Pavia, Via Ferrata, 1, 1-27100 Pavia, Italy. PHOTOGRAMMETRIC ENGINEERING & REMOTE SENSING
brief overview of the original RADATT project is offered, with particular stress on the image processing tools. A detailed damage assessment chain is then presented, followed by documentation of the experimental results obtained by applying the proposed approach to many case studies. Finally, conclusions are presented.
The RADATT Project The RADATT (RApid Damage Assessment Telematic Tool) project (Casciati et al., 1996; Casciati and Giorgi, 1996a) discussed the feasibility for a system architecture satisfying the following requirements: Given that a seismic event occurred, can comparison of preand post-event imagery be used to detect the damage extent within a few hours from the shake? Can this comparison be conveniently supported by the appropriate interaction with an available building inventory? How is it more convenient to link, within a GIS environment, such a database with @e spatial geo-referenced information of interest? Thq project conceived a system architecture (Figure 1) and implemented modules to form a first prototype for seismic damage assessment and loss estimation from comparison of pre- and post-event images. The comparison is further
IMAGES
GEOREFEmTLoN
I
I
(&Z+. AT Figure 1.The block diagram of the damage assessment system architecture developed during the RADATT project. Photogrammetric Engineering & Remote Sensing, Vol. 64, No. 10, October 1998, pp. 987-994. 0099-1112/98/6410-987$3.00/0
O 1998 American Society for Photogrammetry and Remote Sensing
supported by on-line consultation of the existing available building inventory (Casciati and Giorgi, 1996b). The system architecture was conceived with reference to the following aspects: database management, geographical information system, airborne and satellite imagery acquisition and processing, and final image comparison. Some other aspects showed their importance despite their marginal role with respect to the project: communication tools, image digitization, and geo-referencing are just some examples (Casciati and Giorgi, 1 9 9 6 ~ )Note . that the goal is the detection, from the comparison of images taken before and after a seismic event, of any change corresponding to tangible and intangible losses. These changes can affect buildings, infrastructures, and the territory in their extension. RADATT and Remote Sensing lmage Processing
The conceptual system architecture of Figure 1 was built having in mind the use of pre- and post-event aerial andlor satellite images of the same scene. Some general remarks are given below: immediately after a catastrophic event occurred, the system must be able to receive near-real-time imagery of the damaged area. The work was carried out on the hypothesis of a fast delivery service linking satellite or airborne image providers with the operative civil protection units; and to detect minor changes in structures, &meter ground resolution images are necessary. This high resolution is presently obtained only by a limited number of sensors.
The conceived procedure for damage detection by image comparison had already been tested in a case study on the Greek town of Egion (Acaia region), which suffered a devastating earthquake on 15 June 1996 (Casciati et al., 1997). A parallel study on the Azores Islands (PT),struck by a seismic shake on 01 January 1980, was similarly performed (Gamba et a]., 1997). These preliminary works revealed some problems, and suggested further improvements that are the topics of the present paper. In particular, it was found that simple approaches to image comparison are generally not sufficiently robust to cope with data corrupted by noise, registered with different light and day conditions, and having different view angles or positions of the sensor; in a single word, with the imprecisions that affect, more or less, each pair of images to be simultaneously analyzed. Even if the same approaches could be changed in order to be more robust with respect to these problems, the feeling was that it was necessary to explore new and more suitable image processing methodologies, aimed at overcoming the noise and, possibly, exploiting all the characteristics of the images (Carlotto, 1997; Peli, 1990; Kawamura, 1971; Therrien et al., 1986; Carlotto et al., 1992). Among these approaches, the artificial intelligence approaches (Hadipriono et al., 1991; Pellegretti et al., 1994) seem particularly interesting. Moreover, the difficulties that were faced during the extraction of the differences and while adapting the images to be analyzed and used for comparison brought to the consideration that, for a rapid damage assessment, one needs a tool capable of performing change detection in a reduced time interval, optimizing the trade off between accuracy of analysis and the need to provide a prompt loss estimation. So, no complex and CPU time-consuming algorithm, extremely sophisticated approaches, or machine-dedicated programs could be allowed. On behalf of the preceding analysis, the solution was to implement image processing methodologies robust with respect to the noise, simple to be implemented, and in a userfriendly environment. This can be accomplished by modifying the basic environment of commercially available image
988
October 1998
processing software that can be customized by the user, adding a number of a d hoc algorithms. As for the methodologies, two algorithms were identified, on the basis of the experience gained: pre- and post-event image analysis by means of edge and contour detection, and change detection through shape analysis and perceptual grouping.
The Integrated GIS and lmage Analysis Procedure The two algorithms were integrated in a GIs environment (the ArcInfo commercial product), where also the building inventory and corresponding risk level were stored. The implementation was accomplished, whenever possible, by means of generally available software, such as the Khoros image processing tools, programmable by the visual interface Cantata. However, we must note that these procedures simply use the GIS role to connect in a simple way (by geo-referencing them) the different images referring to a given place, and in this sense it can be considered as a passive aid to image analysis. However, the RADATT experience showed the fundamental role to be played by the geographic information systems in all steps of the damage detection process, including as a powerful aid to image comparison algorithms. In future developments, it will also be possible to implement an active role of the same GIs by considering that it can be used to give hints as to which parts of a given image should be analyzed first (for the post-event situation) on the basis of the information introduced with the pre-event classification. In other words, the knowledge introduced in the system should be exploited not only in a strictly geographic sense (to give information about where an object is) but also as a link, for instance, to the database of the buildings of a given town, and so give information about what an object is. lmage Processing by Means of Gradient Techniques
The usual analysis of complex scenes starts from the spectral (grey-level) and spatial analysis of the original image, to extract higher level information. In an aerial photo of an urban environment, one can use the a priori knowledge about the structure of the objects that are probably present ;n the scene to focus one's research and develop simple but efficient algorithms. In our case, a first means to obtain information about a building is to search for closed contours. This can be done in a variety of ways, and with standard techniques. For instance, in Figure 2 a procedure is shown implemented in Cantata towards this goal. It consists of an edge extracting routine, based on a linear filter and a multi-edge model (Shen and Castan, 1986; Shen and Castan, 1987),implementing a band-limited Laplacian operator. The filter is computed by assuming a simple model of the image as a signal plus white noise, and is an optimal one in the sense that it is optimized to discriminate step or multistep functions embedded in this kind of noise. Moreover, a gradient analysis of the image is provided to an edge closing routine, which exploits both sets of inforination to detect where the edges must be connected. The last procedure is iterated to refine the result, giving for instance the output of Figure 3. In this figure the aerial photograph of the town of Santomenna (central Italy) after the 1980 earthquake is depicted: it is clear that the closed contours no longer correspond to undamaged buildings, except for the small square house at bottom right. The Pre- and Post-Event Analyses Comparison
The quickly analyzed post-event images can by themselves give useful hints to the human operators; however, better
PHOTOGRAMMETRIC ENGINEERING & REMOTE SENSING
I I
Figure 2. The Khoros implementation (using ~ t visual s interface Cantata) of the Image analysis procedure based on edge detection and contour closing.
analyses are obtained by comparison with the pre-event imagery. This step can be efficiently achieved by means of the GIS software. Indeed, ArcInfo allows one to directly interact with the image processing software to exchange data: in particular, the results of the above delineated processes are translated into grids (vector formatted images) and easily composed with the corresponding coverages (the pre-entered layers of the G I ~ in , this case the buildings, or the streets and roads). To this aim, the most important step is the georeferencing of the pre- and post-event images: unfortunately, this is the only step of all this procedure that must be performed manually, because it requires that corresponding control points are indicated in both images. Even if it is possible to implement this step in an automatic way, the differences between the pre- and post-event images may be so large that it is safer to rely on a human operator. Change Detection by Means of Perceptual Grouping
A different approach to the same problem can rely on the use of perceptual grouping concepts (Lowe, 1985). The idea is to identify interesting urban structures and infrastructures by extracting simple "building blocks" from the images by means of easy and inexpensive procedures and group them
PHOTOGRAMMETRIC ENGINEERING & REMOTE SENSING
exploiting the laws of human perception. This method can be applied not only to find closed contours, as in the previous procedure, but also to detect, for instance, small and large roads (parallel lines), blocks (textured parts), etc. From a practical point of view, we follow the procedure to extract edges from the images, store them into a list, and progressively build other lists of more and more complex structures by verifying more and more conditions expressible in terms of continuity, proximity, collinearity, parallelism, and so on. The edge detection here is obtained by a simpler algorithm than before, by convolving the isotropic gradient operator (Philips, 1994) represented by the standard mask
with the original image. The following perceptual grouping procedures are structured by looking first at straight edges and then connecting near edges with similar orientation. Three parameters must be chosen: the minimum edge length, the allowed error in orientation, and the maximum distance between two near segments. All of them are chosen by looking at the statistics
October 1998
989
I
1
I
Figure 3. The post-earthquake image of the small town of Santomenna (central Italy): only the small square house at bottom right was not destroyed. The closed contours extracted (at right) make explicit this observation.
of the extracted edges to adapt the algorithm to the different images (for instance, the first parameter is determined by the mean edge length added to its standard deviation). The second step aims to find corners by grouping straight edges nearly perpendicular to each other (again, maximum distance and angle error are required). Finally, couples of corners constitute quadrangular objects by looking at the direction
and closeness of the chords closing their two sides into a triangle. Therefore, as in the example shown in Figure 4, we start from the original image, and then we can collect collinear edges (Figure 4b), couples of edges grouped in nearly 90" corners (Figure 4c), and the four segments' sets representing hypotheses on quadrangular buildings (Figure 4d). By a com-
Figure 4. The perceptual grouping concepts applied to a part of the image depicting the town of Castelnuovo (southern Italy): first the edges (b), then the corners (c), and the quadrangles (d) were extracted by means of collinearity, proximity, and continuity Gestalt rules.
990
I
October 1998
PHOTOGRAMMETRIC ENGINEERING & REMOTE SENSING
Figure 5. Pre- and post-event images of Conza (Irpinia, southern Italy), struck by a tremendous earthquake in 1980.
parison of these structures before and after the earthquake, we have the joint hypotheses on the damage suffered by the urban agglomerate we are working on. Moreover, because the damage assessment is made by comparing structures instead of images (as in the previous approach), the georeferencing step is not as important as before: here it is necessary only that corresponding objects be located close together, so that they can be recognized, but that no correction for optical distortion is needed.
Experimental Results The procedures outlined in the preceding paragraphs have been applied first to aerial and satellite photos taken before and after different hazards that struck Italy in the recent past. The results presented in this section are the first ones referring to the complete digital image processing chain, and therefore can be considered as partially ameliorable; in any case, the overall performance of the system is extremely satisfying with respect to the first-aid purposes we outlined in the introduction.
above, the assistance of the operator only in detecting corresponding points in the two images, in order to rectify and refer them to the same reference system; the complete procedure takes only a few seconds on a standard PC working under the Linux operating system. The Urnbria Earthquake (1997-1998)
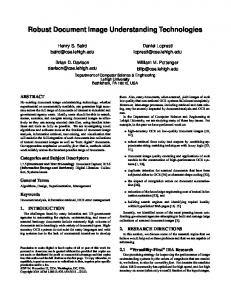
A different, but equally destructive, earthquake was sensed in the Umbria region (central Italy) starting with a big quake in October 1997, and lasting until the present (May 1998) with a series of small (and sometimes bigger) quakes. The images used in this work were taken from a satellite (the Russian KVR-1000, with a resolution of 2 m.) and by a photocamera operated from a helicopter. The data were recorded on August 1994 and November 1997, respectively, and are shown in Figure 8. The effects of the earthquake are here
The lrpinia Earthquake (1980)
In this paragraph, we refer to the tremendous earthquake which occurred in Irpinia (southern Italy) on 23 November 1980. In particular, we present here the results of the analysis of the data regarding a small town, Conza. The images were taken by a camera mounted on an airplane flying at different altitudes (around 1100 and 1700 m); therefore, it was necessary first to rescale the images to the same detail level. The effects of the earthquake are clearly visible in Figure 5 where the rescaled images before and after the event for the center of Conza are presented. We can observe that only a few buildings have survived; in particular, three houses at the bottom of the photos, as well as three others to the right together with two smaller buildings at bottom-left and one isolated house at top-right. The low contrast of the post-event image, due to the high-level scattering by the ruins of the buildings, prevents the use of a simple threshold analysis on the image. More refined methods, such as the one presented in the previous section, work very well, and highlight with high precision the interesting objects still visible in the aerial photo. In Figure 6 the results of this processing procedure are shown, and in Figure 7 the result of the complete comparison between the two images of the same town can be observed. The automatic procedure in its present form involves, as explained PHOTOGRAMMETRIC ENGINEERING & REMOTE SENSING
F~gure6. The closed contours extracted from the postevent image of Conza, showlng the few buildings that survived.
October 1998
991
Figure 6 Figure 9
I
I Figure 7. The result of the comparlson between the preand post-event images of Conza, where the destroyed houses are clearly identified.
less visible than in the previous example: only the house at the top has collapsed, while less damage to the roofs of other buildings is present. After the necessary rescale operation, the same procedure defined for the previous analysis was applied to this new situation. The results are indeed quite satisfying, and are presented in Figure 9. In particular, in Figure 9a the
Detected Buildings
Missed Buildings
12/15
3/15
10110
Misclassified Buildings
-
closed contours elaborated with Cantata are shown, while in Figure 9b the pre-event building layer in ArcInfo (manually extracted) is depicted. Both sets of data, in grid format, are presented in Figure 9c for a visual analysis, while the final comparison can be seen in Figure 9d. As expected, the collapsed house has been identified, while the less damaged houses were not considered. As a first step towards damage assessment, this can be considered a satisfying result, but for better, more refined analyses, more precise image processing tools are still necessary. Finally, the statistics regarding the two examples in Figure 6 and Figure 9 are shown in Table 1. It is clear that the gradient algorithm succeeds in determining almost all the buildings that were not destroyed, even if a few errors are present. In particular, the three misclassified buildings in Figure 9 are very small objects that a further control about their area would discard.
In this paper we have proposed a complete procedure for earthquake damage assessment by image processing tools and GIs integration, paying particular attention to the image analysis approaches more suitable to the task of near-real-time earthquake damage assessment. The results of this first study were satisfying, even if more refined analysis can be offered with more complex processing methods. In any case, the feasibility of the entire system studied during the RADATT project has been clearly
Figure 8. Pre- and post-event images of the town of Arvello (Umbria, central Italy), struck by the earthquake of 19971998.
992
October 1998
PHOTOGRAMMETRIC ENGINEERING & REMOTE SENSING
I I
(c)
(d)
Figure 9. The contours (a) of t h e survived buildings extracted from t h e image of Figure 8, (b) t h e pre-event building layer in Arclnfo, (c) both images in grid format, and (d) the final comparison.
demonstrated b y m e a n s of freeware image processing tools (Khoros) and s t a n d a r d GIS (ArcInfo), s o t h a t t h e system c a n be easily accepted b y Public Administrations.
Acknowledgments T h e authors w a n t t o t h a n k F. Moro for performing t h e s i m u lations a n d L. Cestone for providing t h e aerial photos that w e r e u s e d i n this w o r k and t h e useful discussions a b o u t perceptual grouping concepts.
References Carlotto, M.J., 1997. Detection and analysis of change in remotely sensed imagery with application to wide area surveillance, IEEE Trans. on Image Proc., 6(1)189-202. Carlotto, M.J., M.B. Lazaroff, and M.W. Brennan, 1992. Multispectral
PHOTOGRAMMETRIC ENGINEERING & REMOTE SENSING
image processing for environmental monitoring, Proc. SPLE, 1819:113-124. Casciati, F., and F. Giorgi (editors), 1996a. System Architecture Developed and Expected Benefits, RADATT - EN 1011 Technical Deliverable, UE Telematics Applications Progamme Public Report. Casciati, F., and F. Giorgi, 1996b. GIs for earthquake damage assessment, Proc. of the First International Conference on Computing b Information Technology for Architecture, Engineering & Construction, Singapore, 16-17 May. , 1996c. A telematic system for seismic damage assessment, Proc. of the First European Conference of Structural Control, Barcelona, Spain (edited by World Scientific, Singapore). Casciati, F., A. Corsanego, and C. Sousa Oliveira, 1996. User Requirements and Standardization, RADATT - EN 1011 Technical Deliverable, UE Telematics Applications Programme Public Report. Casciati, F., P. Gamba, F. Giorgi, A, Marazzi, and A. Mecocci, 1997.
October 1998
993
A flexible environment for earthquake rapid damage detection and assessment, Proc. of the 1997 BEE Geosci. and Remote Sensing Symp., Singapore, August, 1:113-115. Gamba, P., A. Marazzi, and E. Costamagna, 1997. Satellite data analysis for earthquake damage assessment, Proc. of the European Symposium on Aerospace Remote Sensing, London, U.K., September Vol. SPIE-3222. Hadipriono, F.C., J.G. Lyon, and T . Li W . H . , 1991. Expert opinion i n satellite data interpretation, Photogrammetric Engineering b Remote Sensing, 57(1):75-78. Kawamura, J.G., 1971. Automatic recognition o f changes i n urban development from aerial photographs, IEEE Tran. Syst. Man, Cybern., l ( 3 ) : Lowe, D.G., 1985. Perceptual Organization and Visual Recognition, Kluwer University Publishers.
Peli, T., 1990. Multiscale fractal theory and object characterization, J. Opt. Soc. Amer. A , 7(6): Pellegretti, P., F. Roli, S.B. Serpico, and G. Vernazza, 1994. Supervised learning o f descriptions for image recognition purposes, IEEE Trans. on Pattern Anal. and Machine Intell., PAMI-lB(1): 92-98. Philips, D., 1994. Image Processing i n C: Analyzing and Enhancing Digital Images, R & D Publications, Lawrence, Texas. Shen, J., and S. Castan, 1986. A n optimal linear operator for edge detection, Proc. of the 1986 Intern. Conf. on Computer Vision and Pattern Recognition, Miami, Florida. , 1987. Edge detection based on multi-edge model, Proc. of SPIE'87, Cannes, France. Therrien, C.W., T.F. Quatieri, and D.D Dudgeon, 1986. Statistical model-based algorithms for image analysis, Proc. IEEE, 74(4):
Forthcoming Articles J o h n E. A n d e r s o n , Spectral Reflectance and Detection of Iron-Oxide Precipitates Associated with Acidic Mine Drainage.
J o h n E. P i n d e r Ill, Indications of Relative Drought Stress in Longleaf Pine from Thematic Mapper Data.
M i c h e l B o u l i a n n e a n d C l e m e n t N o l e t t e , Virtual Reality Applied to User Interfaces for Digital Photogrammetric Workstations.
K e n R u t c h e y a n d Les V i l c h e k , Air Photo-Interpretation and Satellite Imagery Analysis Techniques for Mapping Cattail Coverage i n a Northern Everglades Impoundment.
Daniel G. B r o w n a n d A l a n F. Arbogast, Digital Photogrammetric Change Analysis as Applied to Active Coastal Dunes in Michigan.
Liora S a h a r a n d A m n o n K r u p n i k , Semiautomatic Extraction of Building Outlines from Large-Scale Aerial Images.
Giles M. F o o d y , The Continuum of Classification Fuzziness in Thematic Mapping.
Terry L. S o h l , Change Analysis in the United Arab Emirates: An Investigation of Techniques.
A . Goller, M . G e l a u t z , a n d F. Leberl, Parallel Image Processing Applied to Radar Shape-from-Shading.
J a a n - R o n g T s a y a n d Bernhard I? W r o b e l , A New Algorithm for Surface Determination Based on Wavelets and Its Practical Application.
Peter L. G u t h , Contour Line "Ghosts" in USGS Level-2 DEMs. A y m a n F. H a b i b , Aautomatic Extraction of Road Signs fromTerrestria1 Color Imagery. Colin C. H a r d y a n d Robert E. B u r g a n , Evaluation of NDVI for Monitoring Live Moisture in Three Vegetation Types of the Western U.S. G r a h a m Horgan, Wavelets for SAR Image Smoothing. J o h n R . J e n s e n a n d Dave C. C o w a n , Remote Sensing of Urbanlsuburban Infrastructure and Socio-Economic Attributes. Daniel Lebel a n d R o n a l d Da R o z a , An Innovative Approach Using Digital Photogrammetry to Map GEology in the Porcupine Hills, Southern Alberta, Canada. C.K. Lee a n d W. Faig, Dynamic Monitoring with Video Systems. R o n g x i n g Li, Potential of High-Resolution Satellite Imagery for National Mapping Products. D o n a l d L. Light, C-Factor for Softcopy Photogrammetry.
C.P. Lo a n d Lee J. W a t s o n , The Influence of Geographic Sampling Methods on Vegetation Map Accuracy Evaluation i n a Swampy Environment. S t u a r t R . P h i n n , Douglas A. Stow, a n d David V a n M o u w e r i k , Remotely Sensed Estimates of Vegetation Structural Characteristics i n Restored Wetlands, Southern California.
J u n g - S u p U m a n d Robert W r i g h t , The Analog-to-Digital Transition and Implications for Operational Use of Airborne Videography. David W l a d i s , Automatic Lineament Detection Using Digital Elevation Models with Second Derivative Filters. H u a n g Y o u c a i a n d Robert M. H a r a l i c k , Testing Camera Calibration with Constraints. 1998 GIS ISSUE ON NOVEMBER
THE
U.S.-MEXICO BORDER
Paul Ganster, The United States-Mexico Border Region: An Oveview. K e n n e t h J. O s b o r n , United States-Mexico Transboundary Aerial Photography and Mapping Initiative. A n n e J. Obee, Ernst C. Griffin, a n d Richard D. Wright, Using a GIS to Overcome Data Adversity: Industrial Air Pollution Risk Modeling in Tijuana Mexico. Mark V Finco a n d George F. H e p n e r , Modeling Agricultural Nonpoint Source Sediment Yield in Imperial Valley, California. Russell G. Congalton, M a r y Balogh, C i n d y Bell, Kass G r e e n , Jeff A . M i l l i k e n , a n d Robert O t t m a n , Mapping and Monitoring Agricultural Crops and other Land Cover in the Lower Colorado River Basin. Carlos Gonzalez-Rebeles, V i n c e n t J. B u r k e , Michael D. J e n n i n g s , Gerardo Ceballos, a n d N i c k C. Parker, Transnational Gap Analysis of the Rio BravolRio Grande Region.