collaborative pilot project funded by the Queensland Parallel Supercomputing ... already begun in the suburbs of Stafford, Geebung, Northgate and Virginia.
GIS as a Tool for Decision Making and Evaluation Wayne Delaforce: QUT, Dr. Bruce Rich: QUT, Bernadette Savage: QUT, Dr. Barbara Adkins: QUT, Carly Hall: QUT, and Daniel Caldeweyher: QUT.
Abstract
The pilot project detailed in this paper was designed to explore the potential for an information tool and education sector engagement model to benefit the sector and its communities in the transport corridor to the north of Brisbane. By allowing participants, community, government and non-government organisations (NGO) to access information at a regional level to assist with decision making and the evaluation of shared cross-sectoral service provision and planning initiatives. As part of this pilot project a prototype information system has been developed integrating both technology and organisational process. The result is a Community Information System (CIS) developed using open sourced software and eventually able to provide regionally specific public access layered data online. This prototype CIS allows the exploration of whether visualisation technologies such as Geographic Information Systems (GIS) could be used as a tool to create and display information in a form to assist organisational and community decision-making and evaluation. Thus testing the validity of the above concept from both the technical and organisational/community perspective. GIS have been used since the 1960’s for town planning, environmental, event, resource, epidemiological mapping and in military applications. Generally, the applications of GIS have been used to display various phenomena that have a spatial location within the physical environment. Now with advances in technology, data management and subsequent availability, GIS technology has the ability to be integrated into and more effectively applied to social, service delivery, evaluation, and change management applications. QUT and partners over the past 12 months have been developing the prototype CIS designed to test the concept outlined above and generate application and process knowledge as an additional outcome. The initial focus of the pilot project was concentrated on service provision, demographics and associated change within the regional education sector and their communities of influence and practice. As a result, of this application cross-sectoral learning and process improvement practices were enhanced. The next phase of the prototype CIS development is planned to provide the capability for a third party user to be able to map and then provide commentary on policy and program initiatives including projections for future impacts and development alternatives at the local level. This will be achieved through three degrees of visualisation of information, representing public access, interactive access with the ability to incorporate local data and thirdly stakeholder database access. Giving the users potential to access and develop evidencebased data for investigative and evaluation purposes for the justification of specific community initiatives.
Keywords: Higher Education Engagement; GIS; and Regional Development.
Cite as:
Delforce, Wayne and Rich, Bruce and Savage, Bernadette and Adkins, Barbara and Hall, Carly and Caldeweyher, Daniel (2005) GIS as a Tool for Decision Making and Evaluation. In Bailey, C. and Barnett, K., Eds. Proceedings Social Change in the 21st Century, Brisbane, Australia.
Background There is a growing body of literature in regional development and engagement studies that examines the relationship between higher education institution initiatives and regional development. This intersects with current Australian policy concerns outlined at National, State and University levels that identifies the mechanisms of collaboration and engagement required to produce both social and economic outcomes for regions. For example studies investigating both the European (Boucher, Conway and Van Der Meer 2003) and Australian context (Keane and Alison, 1999; Gunasekara, 2004) have proposed that ”regional success” depends in part on “institutional thickness” where institutions engage in the sharing of knowledge and expertise to promote cooperative activity as explored in Delaforce, et al. (2005). One such work found in the literature, which deals with regional engagement, and the incorporation of visualisation technology is that by Rina Ghose (2001:142), that states: ‘Ease of visualising and analysing neighbourhood-based special data makes GIS especially useful to neighbourhood planner, citizen, and professional alike. With this technology both planning agencies and community organisations can play an increasingly significant role in implementing neighbourhood revitalisation programs and in assessing neighbourhood markets and needs (Sawicki and Craig 1996, Ramasubramanian 1998, Kellogg 1999, Elwood 2000, Ghose and Huxhold 2000). In practice implementation of GIS and other information technologies, by virtue of their complexity and cost, has effectively raised barriers to empowerment by creating exclusive sophisticated user-communities beyond the reach of less powerful, resource poor citizens (Castells 1996, Harris Weiner 1998, Elwood 2000).’
It can be argued that modern history has shown that distributed decision-making leads to better grounded local outcomes than centralised decision-making However, uneducated or uninformed groups cannot engage in the democratic process in the same way that educated and informed groups can, for example the printing press combined with universal literacy has enabled engagement in government decisionmaking by classes of the population previously excluded. Scrutiny of, and participation in, government processes would be impossible for an illiterate population, or one that has uneven access to topical information. As a result Ghose (2001:141) suggests, “GIS has emerged as an elitist, anti-democratic technology by virtue of its technological complexity and cost.” Up until the recent past, information and ideas were recorded and relayed on paper using the written word or graphical devices. Curtain (1993) discussing the formation of community and a common language identifies how other forms of information storage and transmission became more important. Radio and then television rapidly became the principal source of news and current events information for a large portion of the population, at the expense of reliance on newspapers and their interpretation of events. Digital information stored in large databases has become a powerful information management tool. The data analysis and graphical representation capabilities of these databases have the capacity to support tools, which have the potential to be elitist in application as detailed above by Ghose (2001). Outsiders to this information club would then not be able to effectively scrutinise or have appropriate input into corporate or government decisions that affect their communities. It follows that without similar access to GIS, community group, grass roots, or activist organisations cannot have effective input into consultative decision-making or to properly scrutinise the actions and decisions of Corporations and Governments Voss et al (2004) have expressed the hope that GIS can be made more accessible and therefore more supportive of an inclusive, egalitarian democratic process.
2
The statement by Voss (2004:635) that “Participatory spatial planning and decision making requires a combination of software tools for group decision support, individual decision support and geographic analysis and presentation.” further supports this view.
Regional Context Universities both in Australia and internationally are being encouraged by leaders such as Professor Michael Gibbons, a member of the UK Economic and Social Research Council and Chair of its Research Priorities Board to shift from the production of merely reliable to the production of socially robust knowledge as discussed in Gibbons (1999). Our experience has shown that any outcome must have direct relevance to the communities they serve. In Australia this has been legislatively embodied by a series of national and state level changes to embed the concept of community engagement within the higher education sector. At QUT this philosophy has been incorporated in the university and articulated through the strategic plan QUT Blueprint 2004 which details the University direction over the next 5 years in particular for QUT to be a university “engaged with our communities”. Engagement with our Northern Corridor community emerged in the broadest sense with the top-level university plans embedded under the strategic plan. In particular the “Learning and Teaching and Research and Innovation Plans” adopted and articulated the ideas of active partnership and collaboration, internal and external engagement, capacity building, shared facilities and research benefit to the community and more. To support these principles the university states, “QUT will develop a culture of partnership and engagement” part of which will be the review of best practice models for community engagement. The use of GIS to map community and social data is gaining momentum throughout the world. The potential for this pilot project presented itself in the Transport Corridor to Brisbane’s North - a region in which a number of significant education sector community engagements and collaborative programs have been developed and implemented in recent years. The adaptation of GIS technology to these collaborations provides an unprecedented opportunity to collate publicly available non-identifiable data sets and stakeholder information including regional level transition, destination, service, demographic and preference data. As well as providing the opportunity to display and interrogate multi-layered crosssectoral regional information visually and thus creating new shared insights and meaning at the regional level. Data records are referenced to a specific geographical location and the information is presented in a graphical format, overlaid onto a map. or special reference network and is particularly useful for planning service or product delivery to the specified geographic area. The resultant use of technologies such as GIS and visualisations to support the regional education sector work has also been associated in recent times with Social Constructivism. With Brey (1997 p.12) examining an “interesting analyses of technologies, being “socially shaped” or having a “script”, that provide a potentially fruitful basis for normative and evaluative philosophical analysis of technology and its impacts” “Social constructivism studies pose interesting challenges to the philosophy of technology” but surly just as social construct plays a part on the determination and impact of technology so the reverse also holds. This paper examines this question in the regional education sector context of the Northern Corridor Education Precinct (NCEP) and partners pointing to specific issues of implementation that have arisen through the pilot project.
3
Specifically, it was found that a key issue in successfully engaging the different regional education stakeholders for mutual benefit was common access to information/knowledge about socio-economic, demographic and behavioural patterns at the spatial and organisational levels relevant to education delivery and management.
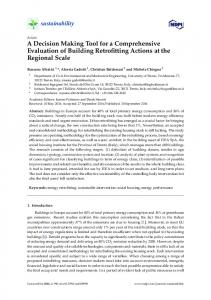
Regional Model The application of the developed prototype CIS is significant at the level of both organisational and community benefit to provide empirical data prior to a more comprehensive application being planned and developed. The open source webbased system which the prototype CIS uses takes data from many formats and overlays it onto a visual background providing the ability for users to spatially display the data-sets according to geographic location, time and theme, i.e. spatial, temporal and thematic. The schematic below (Figure 1.) details the various degrees of access; public; interactive local; and stakeholder private the users will be able to view and utilise. Given that Google and Microsoft Earth are beginning to provide access to similar general spatial data as are other proprietary software developers utilising IMS software. The prototype CIS and associated collaborations take this a step further and provide access to local information in real time able to be used for intelligence collection, decision-making and evaluation. Thus providing a regionally specific view where the user has the ability to include local data into the provided infrastructure. To avoid the technical complexity generally associated with GIS, the CIS is designed with non-expert users in mind providing an intuitive interface and “wizards” assisting the user with complicated tasks such as classifying and analysing data, or creating new map layers based on various data sources. Figure 1. 3 Degrees of Access Schematic
4
The system is designed modularly employing different software engineering principles to allow for customisation to better accommodate the inherently different spatial analysis needs of each user from the three degrees of access. The use of GIS in decision making to support the education sector in the Northern Corridor has developed since 2003 led by QUT Carseldine, resulting in this collaborative pilot project funded by the Queensland Parallel Supercomputing Foundation (QPSF) and facilitated by the QUT High Performance Computing and Research Support Group. The pilot project was designed to use GIS technology as a platform for the prototype CIS. The application of a GIS to a CIS has resulted in the following: • • • •
the creation of an open-source software in a test environment; software which has been applied in a number of social and organisational scenarios; examination of the supercomputing capacity, options and protocols required to process the size and complexity of data sets generated by the pilot project; and the adoption of the concept by project partners, government agencies and NGOs for future decision-making and service evaluation.
Papers detailing both the concept and technical development have been prepared and submitted to a variety of forums, with a paper presented to the "Lord of the Regions" regional science conference in New Zealand in September 2005 with additional publications planned. During the conduct of the pilot project application of the engagement process and methodology has been made in a series of community and regional settings. These applications have revealed a considerable amount of interest by a variety of QUT faculties, university partners, government agencies, service providers, community based organisations and the private sector.
Methodology The Pilot Project is based on an Action Research methodology, in particular Participatory Action Research (PAR). PAR has action objectives built into the research design at the commencement of the research program, and has the ability to yield practical results (Whyte et al., 1989). PAR is applied research but differs from the common type of applied research where the researcher is seen as a professional expert providing project design, data acquisition, interpretation of findings and future action. In PAR, members of the organisation or study group under study work collaboratively with the researcher in obtaining information and ideas to determine future action (Whyte, 1989: Whyte et al., 1989). McTaggart (1992, p.54) states that: “A distinctive feature of participatory action research is that those affected by planned changes have the primary responsibility for deciding on courses of critically informed action which seem likely to lead to improvement, and for evaluating the results of strategies tried out in practice”.
5
As participation proceeds, so too does learning and a strategy for future activity is determined. In PAR the consultant/facilitator acts less as a disciplinary expert, and more as a coach in using the relevant expertise within the group as much as possible. Assistance is also provided by experts from outside the organisation where required. The Prototype CIS utilises open source software and components, (Web Mapping Service (WMS), Web Feature Service (WFS), and Geographic Mark-up Language (GML)) as defined by the Open Geospatial Consortium (OGC) 1994 making it a cost effective application. The utilised products include popular proprietary software alternatives such as: UMN Mapscript to provide mapping capabilities; JFreeChart for charting; Apache Tomcat as the web server; and PostgreSQL/PostGIS as the spatial database. The proof of concept phase initially focused on two test data sets. The first set was derived from a learning and educational perspective concentrating on the specific geographic in Brisbane’s North. The second was an industry mapping initiative already begun in the suburbs of Stafford, Geebung, Northgate and Virginia. The idea was to grow the mapping incrementally applying results as the pilot progresses through both existing and developing collaborations. The stages involved in the proof of concept for the pilot project involved: • • • • •
model development, resource availability and logistical requirement mapping; integration of data into a common GIS compatible format; data analysis and interpretation of GIS standard data compiled from all data sources; application of dataset in GIS formation and interpretation of data; and development of GIS visualisations and proof of concept.
Outcomes This pilot project has brought together representatives from the disciplines of social science, business, mathematics, and information technology and members of the regional community to work collaboratively towards sharing and developing geographic community socio-economic data and visualisations. The results from this pilot project and the prototype CIS have informed both the discussion and strategic planning for cross-sectoral and multi-disciplinary objectives. Not only has an open source web-based prototype been developed, but also it has been used to layer existing data from the various parties to create real time new data. Information that is now available and is being used to identify gaps, potential collaborations, interventions and service provision evaluations. The pilot project and prototype CIS however has and continues to concentrate on the delivery and management of a regionally based decision support and evaluation alternative. Examples of this are shown in the following thematic visualisations. Displayed below are three figures depicting screenshots from the CIS prototype: • • •
Figure 2. Screen shot of the Main Page of the CIS displaying spatial representation for the Northern Corridor Education Precinct (NCEP); Figure 3 Screenshot: CIS Layer Control - Classification Wizard – Census Population Demographic 2001 Figure 4 Screenshot: CIS layered Visualisation of Figures 2 and 3
6
Figure 2. Screenshot: CIS Main Page
Figure 3. Screenshot: CIS Layer Control - Classification Wizard
7
Figure 4. Screenshot: CIS layered Visualisation of Figures 2 and 3
GIS Technology Using Publicly Available Data Thematic Applications The GIS/CIS model provides a powerful insight into contemporary community and organisational issues in a spatial, temporal and visual form. It is particularly suited to studies involving surveys and large data sets that historically have represented the complex social domain. The use of visualisation capacities within GIS programs has evolved and provides an opportunity for QUT Carseldine to position as a lead agency in this field and become an informed and active commentator on regional socioeconomic issues. In particular issues that affect the education sector, interests and aligned discussions. This initiative in turn contributes significantly to a coordinated and evidence based approach to enhance community relationships both internal and external to the sector and throughout the region. Detailed below are three examples in which the pilot project the GIS concept and CIS Prototype has been used Application 1 – Northern Corridor Education Precinct (NCEP)
This case examines the use of the prototype CIS in the NCEP pointing to specific issues identified as a result of this application and associated process. The Northern Corridor region of South-East Queensland, evolved from research by Dr Marguerite Nolan who conducted a research project, initiated by the then North Point Institute of TAFE (NPIT) and QUT in 1999. The research found that the corridor included areas that exhibit high youth unemployment, low education retention rates, a large number of families from low socio-economic backgrounds, a significant numbers of ‘at risk’ students and families where no member has accessed tertiary education.
8
In this context, QUT, and specifically the NCEP, is confronted with reconciling the principles articulated at National and State levels with the need to develop specific strategies for regional and organisational implementation. The Northern Corridor is a rapidly growing region with a projected population increase of over 50% by 2026. This statistic raises issues about future infrastructure and resource needs for education and service provision in the corridor. Specifically, it was found that a key issue in successfully engaging the different regional education stakeholders for mutual benefit was common access to information/knowledge about socio-economic, demographic and behavioural patterns at the spatial and organisational levels relevant to cross-sectoral education delivery and management. This situation formed the context in which QUT attempted to develop a specific engagement strategy in the Northern Corridor through a program theory approach that embeds them within the NCEP objectives and the emerging articulated systemic policy framework and utilises GIS technologies and visualisations as a programme mechanism. During this period conscious decisions have been made to create a space for engagement and discussion to occur outside the organisational, agency and politically determined artificial boundaries. A space of engagement in which a regional level discourse supported by the unprecedented sharing of data has emerged, the result of which is the ability to create new knowledge and understanding beyond the available data sets. As a result of the collaborations educators have begun to use both GIS and visualisation technologies to assist in the mapping and gapping of various data sets at a regional level. This application assists regional sector level understanding, planning and evaluations, interventions and the socio-economic environment in which they and their constituent communities operate. Outcomes from this application of the prototype CIS and collaboration model include the mapping of education catchment and flow, analysis of layered socio-economic and demographic profile and projected regional growth forecasts. This has been used to evaluate and comment on current infrastructure planning proposals through a coherent and evidence based approach. In addition the pilot project was instrumental in GIS technologies being included in the geography programs of a number of local secondary schools as part of the cross-sectoral collection of socioeconomic data designed to link the schools with their communities and foster a greater degree of engagement. Resultant data sets will be used to contribute to the development of a systematic regional knowledge base, which will be compatible with emerging technologies, shared with our BNDF partners and eventually made publicly available through the prototype CIS. Application 2 – Brisbane North Development Forum (BNDF) BNDF is a regional community and business collaboration with the aim of enhancing the liveability of Brisbane’s northern corridor through socio-economic development and proactive representation of local issues. The Forum has members from a wide spectrum of the community, government, non-government agencies, and institutions who have mutually decided to work towards the shared vision above. QUT has been an active participant in BNDF since its inception in 2002 and led the regional mapping agenda using GIS technologies.
9
The pilot project and resultant prototype CIS emerged from the foundation work of the BNDF and NCEP members led by QUT. Initially, through the lot level industry mapping designed to understand regional supply chains, the clustering of industry groups and the skills mix requirements of the region. This has since developed into a complex system of regional level cross-sectoral mappings designed to spatially record: temporal changes to socio-economic demographic data; employment patterns requirements and profiles; service delivery and comparatives; all levels of infrastructure including social, capital and industrial; current and projected skills requirements; and regional capability assessments. All in order to capture, analyse and evaluate potential development, needs and service requirements for the region. Direct outcomes from the BNDF collaboration and the mapping exercises include the prototype CIS, federal funding to facilitate industry cluster development identified by the process, and potential funds to map the regions social infrastructure and service delivery supported or funded by all levels of government BNDF, NCEP and QUT. Specifically, this work is planned in two major projects. The first with the Queensland Department of Communities and the Office Economic and Statistical Research in relation to cross-sectoral service delivery catchment mapping. The other a BNDF, QUT and Brisbane Airport Corporation application to examine the effect of and capability for the region to respond socially, economically, and strategically to the airports expected 300% workforce and business growth up to 2026. The information is then planned to form part of a larger exercise designed to use regional level evidence to inform future implementation and integration of industry and community developments designed to support sustainable regional growth and liveability. Application 3 - Youth at Risk Alliance (YARA) As part of the prototype CIS proof of concept, the pilot project embraced an application to investigate how regional based Human Services NGO, YARA located on the Gold Coast could benefit. As a result it was agreed to identify any inconsistencies or gaps in relation to service provision by the various member organisations and affiliates. This case study was used to justify a more comprehensive study, which will embrace the leading social issues in that region. The project was undertaken in order to demonstrate the way that human services and publicly available data could be visualized using GIS technology and to assess the perceptions of service providers and stakeholders in the field of human services regarding the utility of a spatial information tool such as GIS in service integration efforts. One of the key objectives was to demonstrate how GIS technology could be used to identify disparities between existing service provision, service need and layered socio-economic data to provide a regional profile. The pilot has demonstrated the potential for applied GIS technology in a social context and program evaluation to be further utilised in the social planning process, raising questions regarding community service provision, program implementation and points of thematic interest to organisations such as YARA. A more detailed examination of this case study is provided in Heffernan et al (2005).
10
Discussion and Future Goals The prototype CIS/GIS based model has wide application across disciplines and organisational boundaries with the capacity to link contemporary socio-economic issues that are relevant to particular communities. Specifically, it provides a significant potential role in the “Sustainable Living” domain with complimentary capacity across the disciplines involved. Representing this cross disciplinary and institutional approach, discussions have been held with a consortium from UTS, Loyola, and the Science Shopfront in Europe to extend the pilot project from the current membership to national and international collaborations through an ARC Linkage application in 2006 designed to validate the model at a global level. The pilot has identified that a key application of GIS technology in relation to community and regional engagement is that of priority mapping. Priority mapping enables the aggregation of relevant variables that can be used to identify areas of need and represent them spatially. For example Kaneko, Takano and Nakamura (2002) completed a study in relation to community health needs. One of the key objectives of their study and also applying to our pilot project was to utilise the prototype CIS/GIS-based model and in the words of Kaneko, Takano and Nakamura (2002: 241) “support appropriate resource allocation, inter-sectoral collaboration and greater transparency in planning and implementing services, by visualising locations of community health needs” This type of concept was also applied in a study conducted the in United Kingdom using priority mapping to identify areas for intervention in relation to youth at risk and detailed in Craglia and Signoretta (2004). Generally, priority mapping could be applied in developing a community needs assessment framework in South East Queensland in collaboration with community organisations. At the local level discussions are currently underway with the Greater Brisbane Area Consultative Committee (GBACC), Community Renewal, Brisbane North Development Forum (BNDF) and the Northern Corridor Education Precinct (NCEP) and the Queensland Government to explore the potential of mapping SE Queensland from a socio-economic perspective. Such an outcome will not only benefit the community but also assist greatly in our continued regional education sector engagement and allow for enhanced decision- making at the regional and organisational levels. The prototype CIS/GIS-based model provides a powerful insight into contemporary community issues in a spatial, temporal and visual form. It is particularly suited to studies involving surveys and large data sets that historically have represented the complex social domain. The use of visualisation capacities within the GIS programs has evolved and provides an opportunity for QUT Carseldine to establish as a lead agency in this field and the regional commentator on socio-economic issues. During 2003 it was realised that an inexpensive visual data modelling tool for communities (local and regional) designed to gain insight in real time into the social and physical parameters affecting their way of life was needed. This realisation is further enhanced with the alignment of GIS developments with the emerging three dimensional holographic visualisation technologies and with that of network capacity mapping for social, community, organisational, relationship and partnership interactions. This entire intervention strategy is operating in a way that would lend itself to strategies for engagement for the purposes of regional development. Observations to date suggest that the visual representation of data directly pertinent to stakeholders’ interests in the region in a way that is accessible collectively (in real or virtual environments) appears to provide for the sharing of horizons and contexts and the development of practical and enduring relationships between stakeholders and their constituents.
11
References
Barndt, M. (1998) Public Participation GIS- Barriers to Implementation. Cartography and Information Systems Barndt, M., (2002) A model for evaluating public participation GIS, in Community Participation & Geographic Information Systems, W.J. Craig, T.M. Harris, and D. Weiner, Editors., Taylor & Francis: London. Blough, D., (2003) ‘Integrating GIS into the Survey Research Process’, New Directions for Institutional Research’, No.120, Winter, pp 37-52 Brey, P., (1997) ‘Philosophy of Technology meets Social Constructivism”, Society for Philosophy and Technology, vol. 2, no 3-4 pp 1-17 Boucher, G., Conway, C., and Van Der Meer, E. (2003) ‘Tiers of Engagement by Universities in their Region’s Development’ Regional Studies, vol. 37, no. 9, pp 887897 Burkhardt, J. (2002) ‘Boundary-Spanning Leadership in Higher Education’, Journal of Leadership Studies, vol.8, no. 2, pp145-150 Chrisman, N.R., (1999) What Does 'GIS' Mean? Transactions in GIS. Craglia, M. and Signoretta, P. (2004) GIS for Join-up Government: the Case Study of the Sheffield Children Service Plan In Applied GIS and Spatial Analysis ed. J.Stillwell and G.Clark. 137 -149 West Sussex: John Wiley and Sons Ltd. Curtin, M. (1993). "Beyond the Vast Wasteland: The Policy Discourse of Global Television and the Politics of American Empire." Journal of Broadcasting & Electronic Media, vol. 37 no. 2, pp. 127-145. Delaforce, W. (2004) Building Community University Engagement: A Program Theory Approach, Social Change in the 21 st Century Conference Proceedings, Centre for Social Change Research, Queensland University of Technology. Delaforce, W., Adkins, B., Rich, B. and Buckley, J. (2005) Breaking Down Boundaries - A Regional Approach to Community and Organisational Collaboration using GIS - An Education Sector Perspective, “Lord of the regions - the myths, magic and mix for regional innovation". Economic and Regional Development Conference, Proceedings, Manukau, New Zealand. Elwood, S.A., (2002) GIS use in community planning: a multidimensional analysis of empowerment. Environment and Planning Ghose, R., (2001) ‘Use of Information Technology for Community Empowerment: Transforming Geographic Information Systems into Community Information Systems” Transaction in GIS, vol. 5, no. 2, pp 141-163 Gibbons, M., (1999) ‘Science's new social contract with society’ Nature: Impacts of Foreseeable Science, vol. 402, no. 6761; pp. C81 – C84 Gunasekara, C., (2004) ‘Universities and Communities: A case study of Change in the Management of a University’, Prometheus, vol. 22, no. 2, pp 201-211
12
Hefferman, M., Hall, C., Ingamells, A., Delaforce, W., Rich, B. and Buys, N. (2005) ‘Mapping Youth at Risk: A Pilot Study Using Geographic Information Systems to Enhance Community Decision Making’ Manuscript, Social Change in the 21 st Century Conference Proceedings, Centre for Social Change Research, Queensland University of Technology. Jankowski, P. and Nyerges, T., (2001) ‘GIS-Supported Collaborative Decision Making: Results of an Experiment, Annals of the Association of American Geographers, vol. 91, no. 1, pp 48-70 Kaneko, Y., Takano, T. and Nakamura, K. (2002) ‘Visual localisation of community health needs to rational decision-making in public health services’ in Health and Place 9 Keane, J and Allison, J. (1999) ‘The intersection of the learning region and local and regional economic developments: Analysing the role of higher education’, Regional Studies, vol.33, no. 9, pp 896-892 Lee, R., (1995) ed. Information Technology for the Social Scientist. UCL Press Ltd: London. Marlow, M. and Nass-Fakai, J. (2000) ‘Collegiality, Collaboration and Kuleana: Three Crucial Components for Sustaining Effective School-University Partnerships’, Education, vol. 121, no. 1, pp 188-194 Masser, I. (1999) All shapes and sizes: the first generation of national spatial data infrastructures. International Journal of Geographical Information Science. McTaggart (1992) Reductionism and Action research: Technology versus Convivial forms of Life, in Bruce, C.S. and Russell, A.L. (Eds.) (1992) Transforming tomorrow Today: Proceedings of the Second World Congress on Action Learning, Action Learning, Action Research and Process Management Association Incorporated, Griffith University, Nathan. Pauleen, D. and Yoong, P. (2001) ‘Relationship building and the use of ICT in boundary-crossing virtual teams: a facilitator’s perspective’, Journal of Information Technology, vol. 16 pp 205-220 Queensland University of Technology, (2004) the blueprint2004, Brisbane Rivard, J., (2002) Geographic Information Systems (GIS) and community empowerment, in GIS.: New South Wales. Voss, A., Denisovich, I., Gatalsky, P., Gavouchidis, K., Klotz, A., Roeder, S., Voss, H. (2004) ‘Evolution of a participatory GIS’ Computers, Environment and Urban Systems, vol. 28, pp635-651 Whyte, W.F. (Ed.) (1989) Action research for the Twenty-first Century: Participation, Reflection and Practice. American Behavioural Scientist, 32, 5. Whyte, W.F., Greenwood, J. and Lazes, P. (1989) Participatory Action Research: Through Practice to Science in Social research. American Behavioural Scientist, 32, 5, 513-551.
13