GIS-Based Quantification and 3D Rendering of Water Level Fluctuation Impacts to Littoral Zone Habitat: Conowingo Hydroelectric Project, Susquehanna River, MD/PA
Bryan Strawn, Barry Baker, Marjorie L. Zeff URS Corporation HydroVision 2014
Privileged and Confidential: Prepared at the Request of Counsel in Anticipation of Litigation
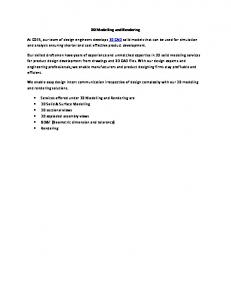
27,510 mi2
444 mi
RM 56 RM 32 RM 24 RM 10
MDNR
Holtwood
Muddy Run
York Energy Peach Bottom Chester Water
Baltimore
Conowingo
Project Flow Constraints
Minimum downstream flow requirements range 3,500 - 10,000 cfs, or natural river flow, whichever is less
Weekly Average Water Level Fluctuation in Conowingo Pond (Jan 2004 – Sept 2010) 111
110.2 110
Pond Elevation (ft) (NGVD 1929)
109
108
107
summer
106
105
104
103
102
101.2 101 0
5
10
15
20
25
30
35
40
45
50
Week of the Year 2004
2005
2006
2007
2008
2009
2010
Permitted Minimum Elevation
Permitted Maximum Elevation
55
Water Level Fluctuation Magnitude, Frequency, Duration, Rate of Change, and Timing
Quantify impacts of reservoir fluctuation from Project operations on littoral habitat in the Pond
http://www.waterontheweb.org/under/lakeecology/10_biological_lakezones.html
“The Challenge” 1. Develop 1-foot contour plan of river bottom from El. 101.2110.2 ft NGVD 2. Operational and logistical constraints 3. Impractical to use a single survey method (water-based bathymetry or aerial-based LiDAR) 4. Merge 2 surveys a.
Traditional bathymetry (El. 96-108 ft NGVD)
b.
Helicopter-mounted LiDAR (El. 106-112 ft NGVD)
Habitat Substrate (acres) Elevation
Total Acres Bedrock
Gravel
Sand
Silt
110-110.2
0.50
1.27
0.00
0.02
1.78
109-110
2.64
7.15
0.13
0.15
10.07
108-109
2.68
6.68
0.16
0.48
10.00
107-108
3.21
10.51
0.30
0.56
14.59
106-107
3.99
29.70
2.77
0.77
37.23
105-106
4.97
19.33
37.18
1.68
63.16
104-105
4.05
28.40
60.80
5.04
98.28
103-104
4.19
41.56
25.89
13.05
84.69
102-103
3.12
11.51
16.57
49.90
81.09
101.2-102
2.46
6.68
12.24
31.18
52.56
Total
31.79
162.80
156.05
102.84
453.48
SAV coverage greatest at El. 104-105 - 88 percent
Sand is preferred substrate
Cumulative SAV Coverage (acres) 350
14 Coontail Eurasian watermilfoil
12
300
Canadian waterweed Water stargrass
250
10 Hydrilla
8
200
6
150
4
100
2
50
0
0
110.2
110
109
108
107
106
105
Elevation (ft) (NGVD 1929)
104
103
102
101.2
Hydrilla
Not Hydrilla
Unidentified (Side Scan ID)
Summary and Conclusions Water level fluctuations attributable to Project operations do not adversely impact littoral habitat within the Study Area. This was demonstrated by the findings of the quantification analysis. • Coverage of SAV in acres notably drops above El. 106 ft NGVD in concurrence with the reduced availability of unconsolidated substrate. However, Project water level fluctuations are primarily confined between El. 107 ft and 109 ft NGVD and rarely fall below El. 106 ft NGVD. • Water levels below El. 106 ft NGVD (potential dewatering) typically occur over brief periods that do not overlap with the optimal time of the year for SAV growth (summer). • The limited occurrence of EAV is due to geology and not to water level fluctuations. Pond shoreline at favorable elevations is comprised of steeply sloping shorelines and boulder substrates unsuitable for EAV growth.
Questions?
[email protected] Booth 1020