Data Science Journal, Volume 8, 30 March 2009
GOOGLE EARTH AS GEOSCIENCE DATA BROWSER PROJECT: DEVELOPMENT OF A TOOL TO CONVERT JAMSTEC RESEARH VESSEL NAVIGATION DATA TO KML 1
1
1
1
2
3
Y Yamagishi* , H Nagao , K Suzuki , H Tamura , T Hatakeyama , H Yanaka and S Tsuboi
1
*1
Institute for Research on Earth Evolution, Japan Agency for Marine-Earth Science and Technology, 3173-25 Showa-machi, Kanazawa-ku, Yokohama, 236-0001 Japan Email: 2
[email protected] Information Processing Center, Okayama University of Science, 1-1 3 Ridai-cho, Okayama-shi, 700-0005 Japan Fujitsu Co. Ltd, 1-9-3 Nakase, Mihama-ku, Chiba-shi, 261-8588 Japan
ABSTRACT We have developed a new system using Google Earth as a data browser to visualize navigation data obtained by JAMSTEC research vessels. An XML-based language called Keyhole Markup Language (KML) is used to plot data on Google Earth. We developed a program, called a KML generator, to convert navigation data to KML. The generator enables us to quickly visualize on Google Earth the cruise track of any JAMSTEC vessel. The visualized image is a powerful tool for managing information on research cruises of various JAMSTEC vessels. Keywords: KML, Visualization, Data Conversion Tool, Google Earth, Java Application
1
INTRODUCTION
Since the 1990s, research data have increased drastically in various geoscience disciplines due to rapid improvement in analytical technologies in geochemistry and geophysical observation equipments. Visualization is a key for interpreting the results of the observations and analyses. To process these huge data sets, a quick visualization system is required. Research projects for investigating the Earth’s interior are often composed of scientists from multidisciplinary fields. To promote these cross-disciplinary projects, it is important to interpret the results from different field studies comprehensively. A system that can overlay the different types of geoscientific data visualizations is useful for the comprehensive interpretation of the data and should advance these cross-disciplinary research projects. In general, data acquisition tools are inherently different across research fields, which produces different data formats even though the observed data might have similar attributes, such as longitude, latitude, and elevation. Therefore, to visualize the data of different disciplines together, it is necessary for researchers to be able to analyze each data format and to acquire skills to use unfamiliar presentation tools customized to display particular data. These are complicated procedures. Here we have developed a new visualization system that is easy to handle and is able to accept various types of geoscientific data regardless of the discipline. Our visualization system uses Google Earth, a program that visualizes a three-dimensional digital globe. It is provided free of charge by Google Inc. Google Earth has become a popular presentation tool in a variety of fields including geoscience (Butler, 2006; Nourbakhsh, Sargent, Wright, Cramer, McClendon, & Jones, 2006; Yuan, Liu, Yuen, Chen, Pergler, & Shi, 2008). We use Google Earth as a browser for viewing different types of geoscientific data. Google Earth uses an XML-based language schema called Keyhole Markup Language (KML). To visualize any original geographic data on Google Earth, it must be turned into KML. Therefore, we have developed a series of programs called ‘KML generators’ to convert various original geophysical and geochemical data files to KML files. Our target data to visualize on Google Earth are 1) seismic tomography model data (Yamagishi et al., submitted), 2) geochemical data on rocks, 3) geomagnetic field model data, and 4) observation data obtained during research cruises. We have developed a KML generator for each type of data. Now our system can visualize these various types of geophysical and geochemical data on Google Earth. In this paper, we show the visualization of observation data produced by research vessels belonging to the Japan Agency of Earth-Marine Science and Technology (JAMSTEC).
S85
Data Science Journal, Volume 8, 30 March 2009
JAMSTEC possesses several research vessels. More than a dozen research cruises are conducted every year by each vessel. Various observation instruments are mounted on each vessel, such as a gravimeter, a magnetometer, a sea water sampling system, and a sampler to obtain seafloor sediment core. Every year, a large amount of geophysical and geochemical observational data is produced during the research cruises and compiled into the JAMSTEC database system. The data are organized according to year and vessel. The navigation data, which is one type of observational data, are recorded and published for all cruises regardless of the vessel. The data contains information about the cruise details and various observation results. Therefore, we have developed a conversion tool, a KML generator, to visualize the navigation data on Google Earth. With this KML generator, visualized images of the observation data can be obtained without any complicated procedures. In addition, several cruise tracks can be displayed together regardless of year and the vessel. The kinds of available data obtained by each cruise can also be displayed. Therefore, our overlay visualization system is a powerful tool to handle information about research cruises and would be useful for proposing new research cruises.
2
CONVERSION FROM NAVIGAION DATA TO KML
With the KML generator we have developed, the cruise track of each vessel can be displayed on Google Earth. The sea surface temperature and the water depth along the cruise track can also be displayed.
2.1
Input file for the KML generator
All vessels belonging JAMSTEC have these observation instruments: GPS receiver, thermometer, Doppler sonar, multi-narrow beam echo sounder, and anemometer. The data obtained by these instruments are time, location (longitude and latitude), velocity, and direction of the vessel, which are recorded continuously as navigation data during a cruise. Data on the atmospheric temperature, wind direction and velocity, sea surface temperature, water depth, and ocean current direction and velocity are also collected. The quality-controlled (QCed) data are recorded every minute. The data are written in plain text and separated by commas. The data of one cruise are compiled into one data file. The QCed data file has a common format for all vessels of JAMSTEC. The KML generator requires a text file with the navigation data file, in which the information about the research cruise is described. The information file contains the cruise number, cruise period, and descriptions of the kinds of available data obtained during the cruise. The format of the description is name of the information data (Key word) = value1, value2, value3… The information text file is named ‘info.txt’ and placed in the directory where the navigation data file is located. The navigation data are available from JAMSTEC’s online database system, but publication of the navigation data must acknowledge the use and specify the research cruise that obtained the data.
2.2
Data format conversion to KML
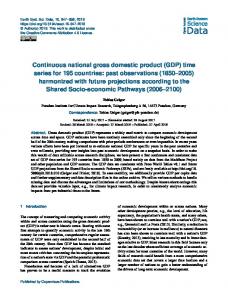
The KML generator reads the navigation data file with its information file and produces a KML file to display a cruise track on Google Earth (see Figure 1). The cruise track is created by the KML tag , which specifies putting a path on Google Earth. This tag needs the coordinates (longitude, latitude, and altitude) of the start and end point of a path. One cruise track is composed of a large number of short paths where the vessel moves for one or several minutes. This time interval varies automatically according to the degree of variation of the traveling direction of the vessel. The date can also be displayed. Whether or not to display the date is controlled by a check box in the left panel of Google Earth. Figure 1a shows the whole cruise track and Fig. 1b demonstrates that the cruise track is reproduced in detail.
S86
Data Science Journal, Volume 8, 30 March 2009
Figure 1. Cruise track of KAIREI, which is one of JAMSTEC’s research vessels. The cruise number is KR03-08. a. Whole cruise track with dates. b. Expansion of the red rectangle in a showing a detail of the cruise track.
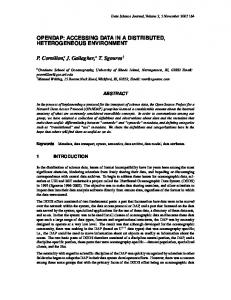
The sea surface temperature and the water depth can also be shown (see Figure 2). In this case, the cruise track is displayed above the ocean surface by setting a co-element of to be “relativeToGround”. The displayed path is connected to the ground by setting a co-element called at “1”. Then a wall is constructed along the cruise. The variation of the sea surface temperature along the cruise track is indicated by the color of the wall. The wall height changes in accordance with the increase or decrease of the water depth. In the latter case, the topography of the sea floor is shown (see lower panel in Figure 2). The temperature color scale is one of the parameters for the KML generator.
S87
Data Science Journal, Volume 8, 30 March 2009
S88
Data Science Journal, Volume 8, 30 March 2009
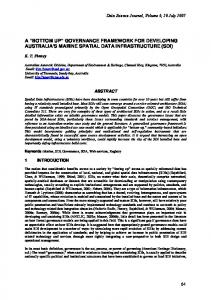
Figure 2. Upper panel. Variation of sea surface temperature and water depth along the cruise track of KR03-08. The wall color varies from red to blue with temperature change. The height of the wall varies proportionally to the water depth. Lower panel. The wall becomes higher as the water depth decreases. The variation of the wall height shows the topography of the sea floor beneath the track. Information about the cruise is also displayed (see Figure 3) by KML tag , which specifies that user-supplied text appears in the balloon. The database system in which the available data obtained in the cruise are stored is linked from the information shown on Google Earth. This is because in , several html formats are supported.
Figure 3. Information about a research cruise described in the balloon. The cruise title, period, and the kinds of available data obtained during this cruise are listed. Underlines indicate Internet links to Websites containing detailed descriptions of the vessel, the cruise report, and the available data obtained during this cruise. It is noted to refer to the Google Earth User Guide site (http://earth.google.com/userguide/) for details about the KML tag.
2.3
Operating system of the KML generator
We have developed the KML generator as a Java application (SE 5.0). Therefore, the generator can work on any terminal with Java Runtime Environment (JRE) 5.0 or later installed, regardless of the operating system. The KML generator outputs a file described in KML 2.2.
3
CRUISE TRACKS OF KAIREI, NATSUSHIMA, AND YOKOSUKA
Figure 4 shows cruise tracks of KAIREI, NATSUHIMA, and YOKOSUKA, research vessels belonging to JAMSTEC. One of the advantages of using Google Earth as a data browser is that we can overlay multiple cruise tracks of different research vessels on the same display panel. Also, it is possible to control which cruise tracks are displayed by clicking the check boxes of the side panel of Google Earth. The kinds of observation data obtained during each
S89
Data Science Journal, Volume 8, 30 March 2009
research cruise are also displayed. This overlay image could provide a list of available research cruises for a specific region, for example, the Izu-Bonin-Mariana Region, regardless of the vessel. The list would be useful to manage the various sets of observation data and would help researchers propose future research cruises for that region. In addition, Internet links to the site, from which the observation data obtained in the research cruise are available, appear in the cruise information displayed on Google Earth (see Figure 3). Google Earth with cruise tracks of various vessels can be used as a portal site to access the observation data obtained in the research cruises.
Figure 4. Cruise tracks of NATSUSHIMA, KAIREI and YOKOSUKA. NT03-06-leg2, KR03-12, and YK03-07_leg2, were conducted by NATSUHIMA, KAIREI, and YOKOSUKA, respectively. These are research cruises in the Izu-Bonin-Mariana region.
4
CONCLUSION
We developed a new program called a KML generator to convert the navigation data of JAMSTEC research vessels into KML. The KML generator produces a KML file to display cruise track on Google Earth. The water depth and sea surface temperature variation along cruise track can also be displayed. This visualization method using the KML generator requires no complicated processes. With the KML generator, both the cruise track and information can be displayed on Google Earth for all vessels. Overlay images with multiple cruise tracks of various vessels can be displayed at once. This type of image should help organize new research cruises and promote oceanic research.
5
ACKNOWLEDGEMENTS
The navigation data used in this paper were obtained during the KR03-08, KR03-12, YK03-07-leg2, NT03-06-leg2 cruises of KAIREI, YOKOSUKA, NATSUSHIMA, Japan Agency for Marine-Earth Science and Technology (JAMSTEC). This work was supported by a Grant-in-Aid for Research and Development [JAMSTEC award] from JAMSTEC.
S90
Data Science Journal, Volume 8, 30 March 2009
6
REFERENCES
Burler, D., (2006) The web-wide world, Nature 439, 776-778.
Nourbakhsh, I., Sargent, R., Wright, A., Cramer, K., McClendon, B., & Jones, M., (2006) Mapping disaster zones, Nature 439, 787-788.
Yuan, X., Liu, Y., Yuen, D. A., Chen, B, Pergler, T., & Shi Y., (2008) An efficient system for creating synthetic InSAR images from simulations, Pure and Applied Geophysics 165, 671-691, doi10.1007/s00024-008-0328-6.
S91