Op
Open Access
Earth Syst. Sci. Data, 2, 71–78, 2010 www.earth-syst-sci-data.net/2/71/2010/ © Author(s) 2010. This work is distributed under the Creative Commons Attribution 3.0 License.
and Science Earth System
Science
Data
Arctic Ocean data in CARINA S. Jutterstr¨om1 , L. G. Anderson1 , N. R. Bates2 , R. Bellerby3,4 , T. Johannessen4,3 , E. P. Jones5 , R. M. Key6 , X. Lin6 , A. Olsen4,3,1 , and A. M. Omar3,4 1
Department of Chemistry, University of Gothenburg, Gothenburg, Sweden Bermuda Biological Station for Research Inc., St. George’s GE01, Bermuda 3 Bjerknes Centre for Climate Research, UNIFOB AS, Bergen, Norway 4 Geophysical lnstitute, University of Bergen, Bergen, Norway 5 Bedford Institute of Oceanography; Department of Fisheries and Oceans, Dartmouth, Nova Scotia, Canada 6 Atmospheric and Oceanic Sciences Program; Princeton University, Princeton, NJ 08544, USA 2
Received: 21 June 2009 – Published in Earth Syst. Sci. Data Discuss.: 21 August 2009 Revised: 12 January 2010 – Accepted: 14 January 2010 – Published: 10 February 2010
Abstract. The paper describes the steps taken for quality controlling chosen parameters within the Arctic
Ocean data included in the CARINA data set and checking for offsets between the individual cruises. The evaluated parameters are the inorganic carbon parameters (total dissolved inorganic carbon, total alkalinity and pH), oxygen and nutrients: nitrate, phosphate and silicate. More parameters can be found in the CARINA data product, but were not subject to a secondary quality control. The main method in determining offsets between cruises was regional multi-linear regression, after a first rough basin-wide deep-water estimate of each parameter. Lastly, the results of the secondary quality control are discussed as well as applied adjustments.
Repository-Reference: doi:10.3334/CDIAC/otg.CARINA.AMS.V1.2 Available at: http://cdiac.ornl.gov/ftp/oceans/CARINA/CARINA Database/CARINA.AMS.V1.2/ Coverage: 60 N to 90 N and circumpolar (0–360◦ ) Location Name: Arctic Ocean Date/Time Start: 1980-08-11 Date/Time End: 2005-05-20
The oldest data is from 1980 (77YM19800811) with the Swedish icebreaker Ymer and the latest is a Barents Sea cruise in 2005 (58JM20050520) with a Norwegian ship Jan Mayen. The parameters discussed in this paper include the carbon parameters (total dissolved inorganic carbon (TCO2 ), total alkalinity (TA) and pH), oxygen (O2 ) and nutrients (nitrate (NO3 ), phosphate (PO4 ) and silicate (Si)). However more parameters may be included in the data product itself. For the CFCs the reader is referred to the paper of Jeansson et al. (2009) describing the analyses of the Arctic Ocean and Nordic Seas CFCs.
1
2
Data coverage and parameter measured
Introduction
The CARINA data set contains 28 cruises collected in the Arctic Ocean, in the Arctic Ocean shelf seas including the Barents Sea and in the Canadian Arctic Archipelago (Table 1). For further information (e.g. responsible scientists, references etc.) about the individual cruises, the reader is referred to the following site: http://cdiac.ornl.gov/oceans/ CARINA/Carina table.html. Correspondence to: S. Jutterstr¨om (
[email protected]) Published by Copernicus Publications.
Determining offsets between cruises
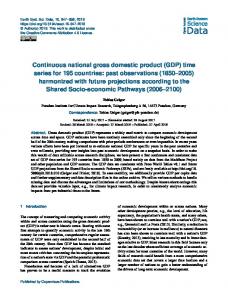
The difficulty of investigating the Arctic data is that the cruises are quite few and spread out both in time and location. Also, the separate basins show differences in the N/P ratios, Si concentrations, and oxygen saturation in the deepwater etc. Therefore, the investigations have been done for each individual basin of the Arctic Ocean. The disadvantage of this is of course that the scarcity of data makes it very difficult to quickly see which cruise is offset when there are only two or three others for comparison. Figure 1 shows the locations of all stations with the stations included in the secondary QC marked red.
¨ et al.: Arctic Ocean data in CARINA S. Jutterstrom
72
Table 1. Cruises and parameters included in the Arctic Ocean synthesis in CARINA listed together with the number of stations and samples (flagged 2 in the CARINA.AMS.V1.2). Note that the number of stations and samples can differ from the ones in the Carina table at CDIAC for that reason.
Cruise # 2 3 45 46 47 48 49 50 72 73 74 75 76 77 82 83 123 124 126 145 146 147 148 177 178 179 180 181 a b c
EXPOCODE
AREA
# stations (# samples)
TCO2
TA
CRMs used:
pH
NO3
PO4
Si
O2
06AQ19930806 06AQ19960712 18RD19980404a 18RD19990827 18SN19940724 18SN19970803 18SN19970831 18SN19970924 32H120020505a 32H120020718 32H120030911a 32H120040515a 32H120040718a 32H120040910 32PZ20020715 320620030705 58AA19991003a 58AA20000923a 58AA20010822a 58JM20030710a 58JM20040724a 58JM20050520a 58LA19860719a 77DN19910726 77DN20010717 77DN20020420b 77YM19800811 90AQ19940706
Central Arctic Central Arctic North Water Polynya North Water Polynya Central Arctic Canadian Arctic Archipelago Canadian Arctic Archipelago Central Arctic Central Arctic Central Arctic Central Arctic Central Arctic Central Arctic Central Arctic Central Arctic Central Arctic Storfjorden Storfjorden Storfjorden Barents Sea Barents Sea Barents Sea Barents Sea Central Arctic Central Arctic Nordic Seas Central Arctic Central Arctic
64 (1273) 63 (1087) NA NA NA 63 (1083) 64 (1109) 64 (1103) 64 (1126) 102 (2481) 78 (1216) 62 (915) Yes 82 (1264) 102 (2410) 102 (2421) 102 (2359) 102 (2431) 348 (6757) 72 (737) 63 (567) Yes NA 133 (1364) 123 (1275) 129 (1182) 64 (661) 40 (464) 40 (387) 40 (316) Yes NA NA NA NA NA 39 (1269) 39 (1021) 38 (914) Yes NA 38 (1084) 39 (1087) 38 (1034) 39 (1056) 24 (424) 24 (327) 24 (326) Yes NA 24 (352) 24 (356) 24 (356) 24 (353) 26 (379) 26 (328) 26 (298) Yes NA NA NA NA NA 16 (475) 16 (352) 16 (319) Yes NA 16 (452) 16 (452) 16 (452) 16 (475) 36 (1579) 28 (330) 28 (330) Yes NA 35 (778) 35 (778) 35 (767) 34 (528) 44 (1857) 42 (472)c NA Yes NA 44 (861) 44 (861) 44 (861) 44 (721) 186 (1197) NA NA NA 162 (937) 167 (961) 167 (959) 152 (810) 35 (1116) 31 (308) 31 (305) Yes NA 35 (588) 35 (588) 35 (590) 35 (455) 60 (2155) 56 (469) 55 (453) Yes NA 60 (1309) 60 (1310) 60 (1311) 60 (972) 117 (1555) NA NA NA 113 (829) 113 (833) 113 (833) 113 (782) 63 (506) NA NA NA 59 (474) 63 (494) 63 (495) NA 326 (3642) NA NA NA 326 (3446) 326 (3446) 326 (3444) 326 (3427) 71 (374) 61 (286) 59 (275) Yes NA 71 (369) 71 (366) 71 (372) NA 168 (502) 168 (500) 168 (493) Yes NA 168 (498) 167 (496) 168 (499) 168 (492) 69 (266) 68 (261) 68 (256) Yes NA NA NA NA 69 (259) 4 (258) 4 (253) 4 (203) Yes NA 4 (246) 4 (244) 4 (245) NA 7 (79) 7 (79) 5 (56) Yes NA 7 (76) 7 (78) 7 (78) NA 9 (106) 9 (104) 9 (101) Yes NA 9 (104) 9 (104) 9 (105) NA 11 (55) 7 (33) 7 (31) No 11 (53) Titrated 11 (55) 9 (41) 11 (55) 11 (55) 54 (1618) 45 (1103) 44 (1121) No NA 54 (1599) 49 (1482) 53 (1585) 54 (1502) Cruise not included in the final synthesis, data consists of alkalinity data (samples were stored and analysed on shore) 92 (1569) 91 (1384) 92 (1498) Yes 92 (1503) 92 (1564) 92 (1564) 92 (1565) 92 (1546) 63 (1072) NA NA NA Nutrients not included in the synthesis 22 (240) 75 (137) 14 (69) 29 (91) NA NA NA NA 29 (91) 16 (76)
These cruises have been through primary QC and are in the data product, but they have not been through the repeated primary QC or the secondary QC. One section in the Fram Strait was used for comparisons, for more details of this cruise see Olsen (2009). Samples were stored and analysed on shore.
Figure 1. Map of all station locations of cruises included in Table 1,
all station locations of the cruises included in the secondary QC are labelled red.
Earth Syst. Sci. Data, 2, 71–78, 2010
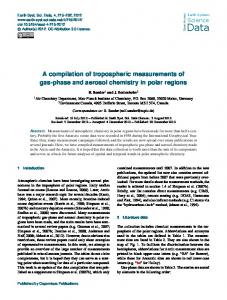
Many, but not all, cruises were investigated in a repeat primary QC fashion, which included examination of depth profiles, property-property plots etc. To see which cruises were not involved repeated primary QC see Table 1. However, only cruises with station depths deeper than 2500 m were involved in the secondary QC. This unfortunately excluded all except 8 cruises and left out many of the shelf cruises that did not have a section extending into the central basin, but these shallower waters show too much variability to make it possible to determine reliable offsets. As a first step, deep-water averages of each parameter were calculated for every separate basin in the Arctic Ocean (Fig. 2) for each of the 8 cruises included in the secondary QC (Table 2). This was also done to look at the spread of each parameter in the deep-water. The results show that there likely existed an offset between some of the parameters in different cruises. However, deep-water averages does not take into consideration the natural variability of water masses and other processes and a supplementary method to confirm the offsets found in the deep-water averages was sought. Crossovers between the Arctic cruises were carried out using the manual approach described by Tanhua et al. (2009), with modifications according to Olsen et al. (2009).
www.earth-syst-sci-data.net/2/71/2010/
¨ et al.: Arctic Ocean data in CARINA S. Jutterstrom
73
Table 2. Deep-water averages (depth >2500 m). Cruise # 50 73 3 47 177 3 47 177 2 3 47 177 179 180 a
EXPOCODE Canada Basin: 18SN19970924 32H120020718 Makarov Basin: 06AQ19960712 18SN19940724 77DN19910726 Amundsen Basin: 06AQ19960712 18SN19940724 77DN19910726 Nansen Basin: 06AQ19930806 06AQ19960712 18SN19940724 77DN19910726 Fram Strait: 77DN20020420 77YM19800811
TCO2
TCO2 -35a
TA
TA-35a
pH
O2
NO3
PO4
Si
Sal
2154 ± 3 2149 ± 1
2157 ± 3 2152 ± 1
2299 ± 5 NaN
2302 ± 5 NaN
NaN NaN
278.3 ± 2.6 285.0 ± 1.3
14.3 ± 0.1 14.5 ± 0.1
1.02 ± 0.01 1.03 ± 0.01
13.4 ± 0.5 13.2 ± 0.5
34.9554 ± 0.0013 34.9549 ± 0.0013
2148 ± 2 2159 ± 3 2157 ± 2
2150 ± 2 2162 ± 3 2160 ± 2
2296 ± 2 2328 ± 4 2289 ± 7
2299 ± 2 2331 ± 4 2292 ± 7
7.860 ± 0.003 NaN NaN
287.6 ± 1.6 288.7 ± 0.9 293.2 ± 1.3
13.8 ± 0.1 14.5 ± 0.04 14.8 ± 0.07
1.00 ± 0.02 1.04 ± 0.01 0.99 ± 0.004
12.6 ± 0.3 13.4 ± 0.3 11.9 ± 0.2
34.9519 ± 0.0015 34.9531 ± 0.0007 34.9544 ± 0.0016
2153 ± 8 2163 ± 2 2149 ± 5
2157 ± 8 2167 ± 2 2154 ± 5
2298 ± 3 2326 ± 2 2291 ± 11
2302 ± 3 2330 ± 2 2295 ± 12
7.856 ± 0.004 NaN NaN
298.8 ± 0.8 299.2 ± 0.5 302.1 ± 2.0
13.7 ± 0.2 14.5 ± 0.07 14.5 ± 0.1
0.97 ± 0.02 1.03 ± 0.01 0.97 ± 0.01
11.1 ± 0.2 12.2 ± 0.2 10.9 ± 0.2
34.9377 ± 0.0054 34.9339 ± 0.006 34.9361 ± 0.0064
2150 ± 3 2155 ± 3 2159 ± 2 2153 ± 4
2154 ± 3 2159 ± 3 2163 ± 2 2157 ± 4
NaN NaN 2320 ± 4 2298 ± 7
NaN NaN 2324 ± 4 2302 ± 6
NaN 7.855 ± 0.005 NaN NaN
278.9 ± 1.7 298.5 ± 1.3 298.9 ± 1.1 299.3 ± 2.6
13.6 ± 0.4 14.3 ± 0.3 14.5 ± 0.04 14.7 ± 0.2
0.97 ± 0.06 0.97 ± 0.02 1.03 ± 0.01 0.98 ± 0.02
11.4 ± 0.4 11.3 ± 0.3 12.9 ± 0.3 11.1 ± 0.2
34.9327 ± 0.0052 34.9381 ± 0.0047 34.9374 ± 0.0031 34.9399 ± 0.0044
2149 ± 3 NaN
2153 ± 3 NaN
2304 ± 4 NaN
2308 ± 3 NaN
7.885 ± 0.005 NaN
302.4 ± 2.0 303.2 ± 4.9
14.7 ± 0.1 12.3 ± 0.2
0.97 ± 0.02 0.86 ± 0.03
10.7 ± 0.1 10.3 ± 0.7
34.9314 ± 0.0074 34.9313 ± 0.0111
Data is normalised to a salinity of 35, TCO2 -35=TCO2 · 35/S alt. TA-35=TA · 35/Sal.
multi-linear regression function for a specific variable. The values calculated from the MLRs for each sample were then compared to the measured values. If the MLR supported the evidence from the basin averages we assumed that there is an offset and the magnitude then determines if a correction is needed. However, care must be taken when choosing the predictor variables of the MLR so that none of these are biased. A number of different MLRs were used for each variable and basin. Since we are not investigating the influence of one individual predictor variable, the MLR can consist of dependent variables. The following are examples of MLRs that were used, but other MLRs were run for every test to check that there was no bias in the results due to an offset in a predictor variable (note: the α1...n -coefficients are individual for each regression):
Figure 2. The basins of the Arctic Ocean.
Unfortunately, it was difficult to control which stations were included in the crossover so that all stations chosen were in the same basin. Also, keeping the crossover radius not too large often made the number of stations so few that no standard deviation could be calculated. Due to this, the crossover results will not be discussed. It is noteworthy that the crossover results did not contradict the basin average results. Trying another approach for the investigations, a regional multi-linear regression (MLR) was applied for each parameter (the MLR was applied to data deeper than 2500). For each basin, data from all the cruises were used to create a www.earth-syst-sci-data.net/2/71/2010/
TCO2 =α1 + α2 Salinity + α3 Theta + α4 NO3 + α5 Si + α6 AOU TCO2 =α1 + α2 Salinity + α3 Theta + α4 PO4 + α5 Si + α6 AOU TA=α1 + α2 Salinity + α3 Theta + α4 PO4 + α5 Si TA=α1 + α2 Salinity + α3 Theta + α4 NO3 + α5 Si Examples of MLRs for oxygen and nutrients (here also other sets of parameters were used): O2 =α1 + α2 Salinity + α3 Theta + α4 NO3 + α5 Si O2 =α1 + α2 Salinity + α3 Theta + α4 PO4 Si=α1 + α2 Salinity + α3 Theta + α4 PO4 + α5 AOU NO3 =α1 + α2 Salinity + α3 Theta + α4 Si + α5 AOU PO4 =α1 + α2 Salinity + α3 Theta + α4 NO3 + α5 Si For the evaluation of the MLRs, the adjusted R2 -value is checked as well as the root mean square error and the residuals. Earth Syst. Sci. Data, 2, 71–78, 2010
¨ et al.: Arctic Ocean data in CARINA S. Jutterstrom
74
Figure 4. MLR results for TCO2 in the Amundsen Basin Figure 3. MLR results for TCO2 in the Canada Basin (offsets in
µmol kg−1 ). The figure contains the predictor function at the top, followed by the adjusted R2 -value and the root mean square error. The boxes contain lines at the median and upper and lower quartiles. The whiskers extend 1.5 times the interquartile range of the sample. Values outside the whiskers are considered outliers and are marked by red +.
3
MLR-results
For an adjustment to be made, it was determined that the offset should be greater than 4 µmol for TCO2 , 6 µmol for TA, 2% for nutrients and oxygen and 0.01 for salinity. For salinity none of the deep-water averages showed any differences larger than 0.01 for any of the cruises in the same basin and salinity was not run with MLRs. The figures in this section showing the MLR results have the offset on the y-axis and the number on the x-axis corresponds to the Cruise # (see Tables 1 or 2) for each cruise involved in the MLR. 3.1 3.1.1
TCO2 The Canada Basin
The cruises that had TCO2 measurements in the deep-water in the Canada Basin were: 18SN19970924 (Cruise #50) and 32H120020718 (73). Both cruises used Certified Reference Materials (CRMs), however the TCO2 samples for 32H120020718 were poisoned and stored for analyses at shore. The deep-water averages of TCO2 show a 5 µmol offset between the cruises. The results from the MLRs showed only smaller offsets. Runs without AOU were also made since the deep-water averages of oxygen showed a discrepancy (Fig. 3). Those results showed a potential offset between the cruises of ∼2–3 µmol. Since it is difficult to say which of the cruises is offset as compared to the other and 32H120020718 only had three stations in deep-water and had stored samples, as well as the offset being just on the limit, no adjustment is advised. Earth Syst. Sci. Data, 2, 71–78, 2010
(offsets in µmol kg−1 ).
3.1.2
The Makarov Basin
The following cruises were part of the MLR in the Makarov Basin: 06AQ19960712 (3), 18SN19940724 (47) and 77DN19910726 (177). Of these 77DN19910726 did not have CRMs. From the deep averages the 06AQ19960712 cruise seems quite a bit lower than the others (∼10 µmol). This is not supported in the MLR functions using all three cruises, however when using 18SN19940724 and 77DN19910726 as master cruises for the MLRs the offset increases. As the MLRs are inconclusive and 06AQ19960712 has a greater number of stations in the Amundsen and Nansen basins no adjustments will be suggested at this point. 3.1.3
The Amundsen Basin
Cruises included in the Amundsen Basin MLR: 06AQ19960712 (3), 18SN19940724 (47) and 77DN19910726 (177) (no CRMs). The results show no significant offsets in the MLRs (Fig. 4) even though the spread is quite large, either when all cruises are used in the MLR or when 18SN19940724 and 77DN19910726 are used as master cruises for the MLR. 3.1.4
The Nansen Basin
Cruises included in the Nansen Basin MLRs were: 06AQ19930806 (2), 06AQ19960712 (3), 18SN19940724 (47), 77DN19910726 (177) and 77DN20020420 (179). The deep-water averages for 77DN20020420 and 06AQ19930806 suggested that these cruises had lower TCO2 than the others; this is only in part shown in the MLR (Fig. 5) with the 77DN20020420 cruise being somewhat lower than the others. For this cruise CRMs were used and it also had stations in the deep Greenland Sea, so any corrections would also have to take into account how it fits the other Nordic Seas cruises. Olsen (2009) investigated the www.earth-syst-sci-data.net/2/71/2010/
¨ et al.: Arctic Ocean data in CARINA S. Jutterstrom
Figure 5. MLR results for TCO2 in the Nansen Basin
(offsets in µmol kg ). −1
75
Figure 6. MLR results for TA in the Makarov Basin
(offsets in µmol kg−1 ).
TCO2 data in the Nordic Seas and did not find an offset large enough to validate an adjustment for this cruise. Therefore no adjustment of the TCO2 data from 77DN20020420 was made. 06AQ19930806 was also excluded in a test run to see the impact on the other cruises (O2 and NO3 seemed to be off when considering the deep-water averages), but only small differences resulted from this. The offset suggested by the deep-water averages for 18SN19940724 is not evident in any of the regional MLRs. Since the possible offset found in the Makarov Basin for 06AQ19960712 was not validated in the results for the Amundsen and Nansen basins where the major part of the stations were located, no adjustment was made. Figure 7. MLR results for TA in the Amundsen Basin
(offsets in µmol kg−1 ).
3.2
TA 3.2.3
3.2.1
The deep-water averages of TA in the Canada Basin only contain 18SN19970924. CRMs were used on this cruise and the value seems reasonable. No correction of TA is suggested.
Cruises included in the Amundsen Basin: 06AQ19960712 (3), 18SN19940724 (47) and 77DN19910726 (177). The results are very similar to those found in the Makarov Basin, although there is an even larger spread in 77DN19910726 and 06AQ19960712 data and a decrease in the MLR fit (Fig. 7). 3.2.4
3.2.2
The Amundsen Basin
The Canada Basin
The Makarov Basin
Included cruises in the Makarov Basin: 06AQ19960712 (3), 18SN19940724 (47) and 77DN19910726 (177). Deep-water averages show a large discrepancy in alkalinity. The MLRs support this (e.g. Fig. 6) especially with regards to the high offsets in the 18SN1994072 data. These cruises are also included in other basins so the correction must also depend on the results from the Amundsen and the Nansen Basin and will be discussed at the end of the TA results. www.earth-syst-sci-data.net/2/71/2010/
The Nansen Basin
Cruises included in the Nansen Basin: 18SN19940724 (47), 77DN19910726 (177) and 77DN20020420 (179). 06AQ19960712 had a breakdown of the TA system and did not have TA data in the deep Nansen Basin. The MLRs still suggest an offsets for 18SN19940724. 3.2.5
Discussion
TA data for 77DN19910726 seem lower than the other cruises in the Makarov and Amundsen Basins when looking Earth Syst. Sci. Data, 2, 71–78, 2010
¨ et al.: Arctic Ocean data in CARINA S. Jutterstrom
76
at the deep-water averages. No CRMs were used on this cruise which suggests that a correction is not surprising. Considering that most of the stations of this cruise were located in the Amundsen and Nansen Basin and only a few stations in the Makarov Basin it makes more sense to trust the Eurasian Basin results. Also, TA data were quite scattered in the deep-waters in the Makarov Basin. The MLRs in the Eurasian Basin do not support the differences found in the deep-water averages, even if there is a large spread in 77DN19910726 data as seen in Figs. 6 and 7. In conclusion, no correction to TA data is suggested for this cruise. For the 18SN19940724 cruise deep-water averages suggest that this cruise is almost 30 µmol higher than e.g. 06AQ19960712. This is supported in the MLRs giving positive offsets between 22–30 µmol kg−1 . In conclusion it is most likely that 18SN19940724 has a positive offset in TA of about 24 µmol kg−1 . 3.3
O2
For oxygen a clear offset in the deep-water averages (>2% from the average) was seen in one cruise in the Nansen Basin (06AQ19930806) and a smaller offset of just over 2% in the Canada Basin (between 18SN19970924 and 32H120020718). 3.4.1
(offsets in µmol kg−1 ).
pH
Only two cruises had measured pH (and, since they also measured TA and TCO2 on the same cruise, overdetermined the carbonate system): 77DN20020420 and 06AQ19960712. By doing “round-calculations”, i.e. using TA and TCO2 to calculate pH, TCO2 and pH to calculate TA and TA and pH to calculate TCO2 and then comparing the measured parameter to the calculated, it is possible to get an idea of whether any of the parameters are offset. This was done for the cruises mentioned above (using CO2SYS by Lewis and Wallace, with the constants from Mehrbach et al. (1973) refit by Dickson and Millero, 1987). The results show a difference in TA of about 3 µmol kg−1 between measured and calculated and the same for DIC. ∆pH has an average of 0.008 and in view of this no corrections of pH is suggested. Velo et al. (2009) evaluated the pH data in the CARINA data set, but since there were only three cross-overs for pH in the Arctic Ocean data, the authors drew no conclusions regarding possible adjustments. 3.4
Figure 8. MLR results for O2 in the Makarov Basin
The Canada Basin
The following cruises were part of the MLR in the Canada Basin: 18SN19970924 (50) and 32H120020718 (73). The results did not differ substantially between different predictor variables; the largest offset between the cruises was only about 2%. Since the deep-water averages and the MLR are on the limit, the suggestion is not to adjust. Earth Syst. Sci. Data, 2, 71–78, 2010
Figure 9. MLR results for O2 in the Nansen Basin
(offsets in µmol kg−1 ).
3.4.2
The Makarov and Amundsen Basins
Oxygen MLRs for the Makarov Basin (Fig. 8) and Amundsen Basin were run, although no results diverged from the conclusions of the deep-water averages. 3.4.3
The Nansen Basin
The following cruises were part of the MLR in the Nansen Basin: 06AQ19930806 (2), 06AQ19960712 (3), 18SN19940724 (47), 77DN19910726 (177), 77DN20020420 (179) and 77YM19800811 (180). Figure 9 shows an offset for 06AQ19930806, which was also indicated in the deep-water averages. However, 77YM19800811 is also somewhat offset. Looking closer at 06AQ19930806 and 77YM19800811 and the predictor variables, the 06AQ19930806 cruise seems to have a lower deepwater average in NO3 as well as oxygen and 77YM19800811 seem to be low in NO3 and PO4 , while the deep-water average for oxygen is not far off from the other cruises. Changing www.earth-syst-sci-data.net/2/71/2010/
¨ et al.: Arctic Ocean data in CARINA S. Jutterstrom
Figure 10. MLR results for NO3 in the Makarov Basin
(offsets in µmol kg−1 ).
the predictor variables to exclude NO3 and also other nutrients was done. The results were similar in the sense that the 06AQ19930806 cruise showed an offset of 14–23 µmol. 77YM19800811 varies between having a small offset (>2%) to having no offset. Excluding NO3 keeps 77YM19800811 within the limits and it is likely that this seems to be a question about the NO3 being too low rather than the oxygen being too high for this cruise. 3.5 3.5.1
Nutrients The Canada Basin
For the Canada Basin the deep-water averages for NO3 , PO4 and Si are not significantly (> 2%) offset between the different cruises, as can be seen in Table 2. MLRs in this basin support this. Testing different sets of predictor variables such as AOU/PO4 , AOU/Si or Si/PO4 or running MLRs of the other nutrients yielded the same results. 3.5.2
The Makarov Basin
In the Makarov Basin deep-water averages, the NO3 concentration for 06AQ19960712 is quite a bit lower than the other cruises in this basin. This is also seen in the Amundsen Basin. In the MLR it is instead 18SN19940724 that shows up a little bit on the high side (Fig. 10). Using other predictor variables does not give evidence either for a large enough negative offset for 06AQ19960712 or positive offset for 18SN19940724 to justify a correction of data. The P:N ratios for these cruises are the same: 1:14. The Si concentrations in the deep-water differ quite a bit, however when running MLRs, no conclusive offsets are found. 3.5.3
The Amundsen Basin
77
Figure 11. MLR results for NO3 in the Nansen Basin
(offsets in µmol kg−1 ).
Si values are quite varied. The results are quite similar to the Makarov runs. No conclusive offsets. 3.5.4
The Nansen Basin
In the Nansen Basin the clearest offsets in the deep-water nutrient averages are the NO3 average of the 06AQ19930806 cruise, the Si average of the 18SN19940724 cruise and the NO3 and PO4 averages of the 77YM19800811 cruise. The latter cruise also has rather low Si concentrations. Although this can be explained by the fact that the deep stations are close to Fram Strait and the deep-water concentrations of Si seem to decrease in this area this does not explain the very low NO3 values. In Fig. 11 the offset in NO3 for 77YM19800811 is quite clear and changing the predictor variables does not change the offset significantly. Since 77YM19800811 does not contain any carbon parameters in the CARINA data product, has few deep stations in the Arctic Ocean proper and is clearly offset in NO3 and PO4 , the suggestion is to exclude this cruise. Figure 11 does not show an offset for NO3 from the 06AQ19930806 cruise. However, when removing AOU as a predictor variable, since it was earlier determined to be offset for 06AQ19930806, the result show a clear negative offset of NO3 for 06AQ19930806. Changing predictor variables between PO4 and Si does not change this result. Therefore the suggestion is to adjust NO3 for the 06AQ19930806 cruise. An MLR where the AOU was calculated with adjusted oxygen values for 06AQ19930806 was created to see if the offset in nitrate would show and the result is shown in Fig. 12 where the nitrate is clearly offset. The high Si in the deep-water average for 18SN19940724 does show up to some extent in the MLR, but since this is not the case for the other basins and there are only a few stations for 18SN19940724 in the Nansen Basin there is no suggestion to adjust.
In the Amundsen Basin again the 06AQ19960712 cruise has a lower deep-water average of NO3 than the others and the www.earth-syst-sci-data.net/2/71/2010/
Earth Syst. Sci. Data, 2, 71–78, 2010
¨ et al.: Arctic Ocean data in CARINA S. Jutterstrom
78
References
Figure 12. MLR results for NO3 in the Nansen Basin (offsets in µmol kg−1 ), calculated using adjusted AOU for 06AQ19930806.
4
Applied adjustments
TCO2 : No adjustments. TA: 18SN19940724 is offset by 24 µmol kg−1 and was adjusted downwards by this amount in the data product. pH: No adjustments. O2 : 06AQ19930806 was adjusted upwards by 7% in the data product. Nutrients: Excluded 77YM19800811 from the synthesis, and NO3 concentrations for 06AQ19930806 were adjusted upwards by 5% in the data product. Salinity: No adjustments. Acknowledgements. This would not have been possible without the scientists and crews at sea spending countless hours and great effort to bring high quality data back from the Arctic Ocean. Also great thanks to the PIs responsible for sharing the data. The EU through IP CARBOOCEAN, contract no. 511176. Additional support provided as follows for: R,M. Key (grant NANA08OAR4320752 and NA08OAR4310820), X. Lin; NOAA grant NA08OAR4310820, A. Olsen (Research Council of Norway grant 178167/S30 (A-CARB)).
Dickson, A. G. and Millero, F. J.: A comparison of the equilibrium constants for the dissociation of carbonic acid in seawater media, Deep-Sea Res., 34, 1733–1743, 1987. Jeansson, E., Olsson, K. A., Tanhua, T., and Bullister, J. L.: Nordic Seas and Arctic Ocean CFC data in CARINA, Earth Syst. Sci. Data Discuss., 2, 493–536, 2009, http://www.earth-syst-sci-data-discuss.net/2/493/2009/. Lewis, E. and Wallace, D. W. R.: Program Developed for CO2 Systems Calculations. ORNL/CDIAC-105, Carbon Dioxide Information Analysis Centre, Oak Ridge National Laboratory, US Department of Energy, Oak Ridge, Tennessee, 1998. Mehrbach, C., Culbertson, C. H., Hawley, J. E., and Pytkowicz, R. M.: Measurement of the apparent dissociation constants of carbonic acid in seawater at atmospheric pressure, Limnol. Oceanogr., 18, 897–907,1973. Olsen, A.: Nordic Seas total dissolved inorganic carbon data in CARINA, Earth Syst. Sci. Data, 1, 35–43, 2009, http://www.earth-syst-sci-data.net/1/35/2009/. Olsen, A., Key, R. M., Jeansson, E., Falck, E., Olafsson, J., van Heuven, S., Skjelvan, I., Omar, A. M., Olsson, K. A., Anderson, L. G., Jutterstr¨om, S., Rey, F., Johannessen, T., Bellerby, R. G. J., Blindheim, J., Bullister, J. L., Pfeil, B., Lin, X., Kozyr, A., Schirnick, C., Tanhua, T., and Wallace, D. W. R.: Overview of the Nordic Seas CARINA data and salinity measurements, Earth Syst. Sci. Data, 1, 25–34, 2009, http://www.earth-syst-sci-data.net/1/25/2009/. Tanhua, T., van Heuven, S., Key, R. M., Velo, A., Olsen, A., and Schirnick, C.: Quality control procedures and methods of the CARINA database, Earth Syst. Sci. Data Discuss., 2, 205–240, 2009, http://www.earth-syst-sci-data-discuss.net/2/205/2009/. Velo, A., P´erez, F. F., Lin, X., Key, R. M., Tanhua, T., de la Paz, M., van Heuven, S., Jutterstr¨om, S., and R´ıos, A. F.: CARINA data synthesis project: pH data scale unification and cruise adjustments, Earth Syst. Sci. Data Discuss., 2, 421–475, 2009, http://www.earth-syst-sci-data-discuss.net/2/421/2009/.
Edited by: T. Tanhua
Earth Syst. Sci. Data, 2, 71–78, 2010
www.earth-syst-sci-data.net/2/71/2010/