Supplement of Earth Syst. Sci. Data, 10, 969–984, 2018 https://doi.org/10.5194/essd-10-969-2018-supplement © Author(s) 2018. This work is distributed under the Creative Commons Attribution 4.0 License.
Supplement of Historical nitrogen fertilizer use in agricultural ecosystems of the contiguous United States during 1850–2015: application rate, timing, and fertilizer types Peiyu Cao et al. Correspondence to: Chaoqun Lu (
[email protected])
The copyright of individual parts of the supplement might differ from the CC BY 4.0 License.
This supplementary material includes the followings: 1) Data sources of historical state-level N consumption. 2) Partitioning of national N fertilizer use in different sectors. 3) Percentage of N fertilizer use in nonfarm, permanent pasture, and cropland pasture to national N fertilizer use. 4) Data source of historical national average crop-specific N use rate. 5) Comparison between cubic spline method and distance-weighted method in interpolating the missing values. 6) Regression models for gap-filling the missing values. 7) Gap-filling the raw state-level crop-specific N use rates with referernced N use rates by regression model. 8) Data source of N fertilizer application timings. 9) Reconstructing national consumption history of 11 N fertilizer types 10) Data sources for state-level N consumption of 11 single N fertilizer types. 11) Reconstructing historical state-level N consumption of 11 fertilizer types. 12) Estimating the ratio of application timings for 11 single N fertilizer types. 13) Fraction of N fertilizer use rate in four application timing to annual N use rate in 2015. 14) Comparison of spatial distribution of N fertilizer use rate in 1997 between Ruddy et al. (2006) and this study. 15) Comparison of national crop-specific application timing ratio between Wade et al. (2015) and this study. 16) Temporal change of ratio of the sum consumption of 11 single N fertilizers to national total. 1 Data sources of historical state-level N consumption We harmonized the state-level N fertilizer consumption from Mehring et al. (1957) for period of 1930-1953, USDA (1971) for period of 1954-1969, USDA (1977) for the year 1976 and 1977, and Brakebill and Gronberg (2017) for period of 1987-2012 (Table S1).
Supplementary table S1. Data sources for state-level N consumption Data sources
Period
Mehring et al. (1957)
1930-1953
USDA (1971)
1954-1969
USDA (1977)
1976-1977
Brakebill and Gronberg (2017)
1987-2012
2 Partitioning of national N fertilizer use in different sectors Commercial nitrogen fertilizer is applied to different plants in the U.S., such as nonfarm, permanent pasture, cropland pasture, and crops. But the defination of these categories varies among different organizations, institutions, and reports. For example, “nonfarm” was defined as the grassland (permanent pasture) and lawns by Ruddy et al. (2006), Brakebill and Grinberg (2017), and IPNI (2018). In comparison, the legislature of many states of the U.S., Mehring et al. (1957) defined “nonfarm” as lawns, parks, airports, and home gardens. “Grassland”, on the other hand, was defined as temporary (cropland pasture) and permanent pasture by the Heffer et al. (2017) and FAO. We adopted the defination from Mehring et al. (1957), USDA (1957), Ibach et al. (1964), Ibach and Adams (1967), and Nickerson et al. (2011) to clarify the N fertilizer use in the U.S. (Supplementary table S2). We first seperated “Nonfarm use” from the national / state-level total N fertilizer consumption. Nonfarm N fertilizer use is for lawns, parks, airports, and home gardens. We further excluded “Permanent pasture” from grassland as “Non-agricultural land”. “Cropland pasture” was regrouped into “Agricultural land” because it is considered as crop rotation and accounted for about 14% of all cropland in 2002 (Nickerson et al., 2011). Supplementary table S2. Category of N fertilizer use in the U.S. National / state-level N fertilizer use
Nonfarm use Farm use
Home garden, lawns, etc. Non-agricultural land
Permanent pasture
Cropland pasture Corn Soybean Winter wheat Spring wheat Agricultural land
Cotton Sorghum Rice Barley Durum wheat Others
3 Percentage of N fertilizer use in nonfarm, permanent pasture, and cropland pasture to national N fertilizer use To exclude N fertilizer use in nonfarm and permanent pasture from national/state total N fertilizer use as non-agricultural fertilizer use and introduce the N fertilizer use in cropland pasture (Supplementary table S2), we integated the state-level nonfarm, permanent pasture, and cropland pasutre N fertilizer use proportion based on Mehring et al. (1957) for 1927, 1938, 1942, 1946, and 1950, USDA (1957) for 1954, Ibach et al. (1964) for 1959, Ibach and Adams (1967) for 1964, Brakebill and Grinberg (2017) for 1987-2012 (nonfarm use only), and Heffer et al. (2017) for 2015 (permanent pasture and cropland pasture only). According to the latest data set published in Heffer et al. (2017), permanent pasture and cropland pasture in the U.S. together accounted for 11.3% of total N fertilzier consumption. We used the individual ratio of these two pastures of 1964 to split 11.3% to 3.8% for permanent pasture and 7.5% for cropland pasture in 2015. Thus, we calculated the increase rates of these two pastures from 1964 to 2015 and increased state-level percentage with the same rate. We assumed the state-level ratio before 1927 kept the same as the ratio of 1927 and adopted linear interpolation to gap-fill the missing years from 1927 to 2015. Supplementary
Fig. S1 shows how the national percentage of N fertilizer use in nonfarm (red line), permanent pasture (green line), cropland pasture (blue line), and nonfarm and permanent pasture together (black dashed line) changed from 1927 to 2015.
Supplementary Figure S1: Percentage of N fertilizer use in nonfarm, permanent pasture, and cropland pasture (classification can be found in Table S2 of Supplementary information) in the U.S. from 1927 to 2015. Red line represents nonfarm, Green line is permanent pasture, Blue line is cropland pasture, and Black dashed line is sum of nonfarm and permanent pasture.
4 Data source of historical national average crop-specific N use rate National average crop-specific N rates were derived from Mehring et al. (1957), USDA (1957), Ibach et al. (1964), Ibach and Adams (1967), USDA-ERS (2013), and USDA-NASS (2017). The
number of crop types was reported differently between these data sources. In Mehring et al. (1957), N used in seven crop types, including corn, soybeans, wheat (sum of N used in spring wheat, winter wheat, and durum wheat), cotton, rice, barley, and cropland pasture, were recorded. While in comparison, USDA (1957), Ibach and Adams (1967), and USDA-ERS (2013) provided N use in all nine major crops and cropland pasture in 1954, 1959, and 1964, including three wheat types. For the period from 1964 to 2015, USDA reported all nine major crops without cropland pasture. In addtion, crop-specific N use documented in Mehring et al. (1957) is the sum of N, P, K, and trace nutrient fertilizers (Table S3). Supplementary table S3. Data sources for national average crop-specific N use rate Data sources
Period
Crop types
Data form
Mehring et al. (1957)
1927, 1938, 1942,
7a
Total fertilizer consumption
1946, 1950 USDA (1957)
1954
10b
N use rate
Ibach et al., (1964)
1959
10b
N use rate
Ibach and Adams. (1967)
1964
10b
N use rate
9c
N use rate
USDA-ERS (2013) and -NASS (2017) 1965-2015
The number of crop types recorded in different sources varied. a, crop types included corn, soybeans, wheat (spring wheat, winter wheat, and durum wheat in total), cotton, rice, barley, and cropland pasture. b, crops included all nine major crops and cropland pasture. c, crops only included nine major crops but not cropland pasture. Total fertilizer of each crop type reported in Mehring et al. (1957) contained all N, P, K, and trace fertilizers.
5 Comparison between cubic spline method and distance-weighted method in interpolating the missing values We adpoted two methods, cubic spline method (for gaps less than three years) and distanceweighted method (Eq. 2, for gaps larger or equal to three years), to gap-fill the missing values in state-level crop-speicific N use rates. It is of high probility that the trend of reference rates are reverse to the row rates in short periods (less than three years), which may produce abrupt biases while using distance-weighted method (Fig. S2a&b). Whereas cubic spline could interpolate the
missing values more smoothly because it adoptes the third-order polynomials to interpolate the missing values, in which the function fits through at most four points at side of the gap. In comparison, cubic spline may over-fit the N use rates and fail to capture the long-term interannual variation of the N use rates in a long period (larger than three years) (Fig. S1c&d). However, the distance-weighted approach, which considers the contribution of the weight of the neatest value and uses the trend of referenceded rate (Fig. S3c) as a base-line, is capable to reproduce the interannual variation of N use rates.
Supplementary Figure S2: Difference between distance-weighted imputation and cubic spline interpolation on different length of gaps. (a) One missing year gap-filling based on distanceweighted method, (b) Two missing years gap-filling based on distance-weighted method, (c) Comparison of two gap-filling methods in N use rate of corn in Maryland, (d) Comparison of two gap-filling methods in N use rate of corn in Delaware. Grey line is referenced rate, red line is N fertilizer rate gap-filled by distance-weighted imputation, blue line is N fertilizer rate gap-filled by cubic spline approach, triangle is the gap-filled value, and dots are the raw data.
6 Regression models for gap-filling the missing values The referenced state-level crop-specific N use rates generated in section 2.1 of Main text combined national crop-specific N use rates with state-level N use rates, which can potentially provide the referenced interannual variation and temporal trend for gap-filling the missing values in the raw state-level crop-specific N use rates. But since national crop-specific N use rates and state-level N use rates are the average of N used by a given crop across the nation and by all crops within a given state, their combination, here we named the referenced state-level crop-specific N use rates, mismatchs the magnitude and changing rate of the state-level crop-specific N use rates more or less (Fig. S2a). So we built regression models (Table S4) between the referenced crop-specific rates and raw state-level crop-specific rates to tune these two data sets to the same amplitude and changing rate (Fig. S2b&c). Supplementary table S4. Regression models used to gap-fill raw state-level crop-specific N use rates Model Equation Quadratic Model 𝑦𝑦 = 𝑎𝑎𝑥𝑥 2 + 𝑏𝑏𝑏𝑏 + 𝑐𝑐 Cubic Mode 𝑦𝑦 = 𝑎𝑎𝑥𝑥 3 + 𝑏𝑏𝑥𝑥 2 + 𝑐𝑐𝑐𝑐 + 𝑑𝑑 Exponential Model 𝑦𝑦 = 𝑎𝑎𝑒𝑒 𝑥𝑥 + b Logarithmic Model 𝑦𝑦 = 𝑎𝑎𝑎𝑎𝑎𝑎𝑎𝑎(𝑥𝑥) + 𝑏𝑏 Where y is the raw state-level crop-speicific N use rates, x is the referenced state-level cropspecific N use rates.
7 Gap-filling the raw state-level crop-specific N use rates with referernced N use rates by regression model We combined the national crop-specific N use rates and state-level N use rates as the reference for gap-filling the raw data of state-level crop-specific N use rates. However, there are discrepancy in the magnitude and the changing rate between the referenced N use rates and raw N use rates (Fig S3a), which produces abrupt values (outliers) during the gap-filling. Thus, we first built the regression models (Table S4) between referenced rates and raw rates (Fig. S3b) in order to correct the magnitude and changing rate of the referenced rates (Fig. S3c). Then we gap-filled the missing values based on the corrected reference (Fig. S3d).
Supplementary Figure S3. Gap-fill the missing N use rate of Spring wheat in South Dakoda during 1954-2015. (a) Referenced rate and raw data (blue line means there is no missing years between the data points). (b) Regression model we built between raw data and referenced rate, which was used to correct referenced rate for better magnitude and changing rate (The Cubic Model is the best regression model with high R2 of 0.96). (c) the referenced rate (black line) and corrected reference (gray line) based on cubic model in figure b. (d) Final product of gap-filled values (green line) by using weighted-distance approach and corrected reference.
8 Data source of N fertilizer application timings N fertilizer application timing information was derieved from the survey conducted by USDAERS (2016). The survey started from 1996 and collected the data periodically for each crop in each state (Table S5). The surveyed years of different crop types might vary. For example, corn plantings were surveyed in 1996-2001, 2005, and 2010, while soybean plantings were surveyed in 1996-2000, 2002, 2006, and 2012. Moreover, the surveyed year of a specific crop type in different states might also vary. We adopted the latest surveyed years for each of the all nine crops. For the lastest surveyed year, USDA-ERS (2016) only reported the average application timings at all
survey states for sorghum (year 2011) and rice (year 2013). We therefore used the prior surveyed years to generate state-level application timings for sorghum (2003) and rice (2006) (Table S5). Supplementary table S5. The survey years of application timing we adopted for nine crops Crops
Survey years
Corn
1996-2001, 2005, 2010
Soybeans
1996-2000, 2002, 2006, 2012
Winter Wheat
1996-1998, 2000, 2004, 2009
Spring Wheat
1996-1998, 2000, 2004, 2009
Cotton
1996-2000, 2003, 2007
Sorghum
2003, 2011 (Average timing only)
Rice
2006, 2013 (Average timing only)
Barley
2011
Durum Wheat
1996-1998, 2000, 2004, 2009
The years with bold font were the survey years we mostly adopted for each crop in this study. But the specific year of a given state may vary due to the different survey schedule in each state. The reported application timings data for sorghum and rice in their latest surveyed years were average over all surveyed states.
9 Reconstructing national consumption history of 11 N fertilizer types Historical national consumption of 11 N fertilizers from 1900 to 2011 were collected from Mehring et al. (1957), USDA (1966), USDA-ERS (2013), and FAO (2017) (Table S6). We assumed the fraction of NH4+-N and NO3--N remained unchanged before 1900 because the commerical N fertilizer was mainly extracted from natural organic products and mineral deposits (Sheridan, 1979). Diammonium Phosphate (DAP) and Monoammonium Phosphate (MAP) were not reported during 1900-1960 due to their consumption were relatively small and were incorporated in Ammonium Phosphates (APs). After 1960, however, the consumption of these two fertilizers increased to a very high amount and were reported separately.
Supplementary table S6. Data sources used to reconstruct historical consumption record of 11 N fertilizers across nation Fertilizers
AnA
AqA
AN
AS
NS
SN
Urea
CN
1900-1953 1954-1959
\
DAP
MAP
\
\
\
\
APs
1960-2003 2004-2011 Red: Mehring et al. (1957), Green: USDA (1966), Blue: USDA-ERS (2013), Yellow: FAO (2017). AnA: Anhydrous Ammonia. AqA: Aqua Ammonia. AN: Ammonium Nitrate. AS: Ammonium Sulfate. NS: Nitrogen Solution. SN: Sodium Nitrate. CN: Calcium Nitrate. DAP: Diammonium Phosphate. MAP: Monoammonium Phosphate. APs is the integration of Ammonium Phosphates, before 1960, the consumption of DAP and MAP were relatively small, so these two fertilizers were incorporated in APs, after 1960, however, the consumption of these two fertilizers increased to very high amount and were reported separately.
10 Data sources for state-level N consumption of 11 single N fertilizer types Mid-decade (every sixth year of one decade) state-level N consumption of 11 single N fertilizers were derieved from mulitiple data sources, including USDA (1966) for 1946 and 1956, USDA (1971) for 1966, USDA (1977) for 1976, and AAPFCO (1986, 1996, 2006, and 2012) for 1986, 1996, 2006, and 2012 (Supplementary table S7). We gap-filled Calsium Nitrate (CN) from 1946 to 1985 based on the data of 1986, and imputed Diammonium Phosphate (DAP) and Monoammonium Phosphate (MAP) from 1960 to 1985 based on the data in 1986 and set their consumption to zero for years before 1960. Supplementary table S7. Data sources used to reconstruct historical state-level consumption of 11 N fertilizers Fertilizers AnA AqA AN
AS
NS
SN Urea CN
DAP MAP
1946
\
\
\
1956
\
\
\
APs
1966
\
\
\
1976
\
\
\
1986 1996 2006 2012 Green: USDA. (1966). Orange: USDA (1971). Purple: USDA (1977). Blue: AAPFCO (1986, 1996, 2006, and 2012). AnA: Anhydrous Ammonia. AqA: Aqua Ammonia. AN: Ammonium Nitrate. AS: Ammonium Sulfate. NS: Nitrogen solution. SN: Sodium Nitrate. CN: Calcium Nitrate. DAP: Diammonium Phosphate. MAP: Monoammonium Phosphate. Aps: The integration of Ammonium Phosphates
11 Reconstructing historical state-level N consumption of 11 fertilizer types Due to the lack of annual state-level N use of 11 major N fertilizer types from 1850 to 2015, we utilized the state-level N use of the mid-decade year (every sixth year in a decade) as a reference to infer the state-level N use of 11 N fertilizers in that decade. We calculated the percentage of each N fertilizer type consumed by a given state to all states and analyzed the interannual variations of this percentage from 1963 to 1969 to verify the representativeness of 1966 for the rest years in the 1960s. Here only the percentages of Anhydrous Ammonia (AnA), Ammonium Nitrate (AN), Nitrogen Solution (NS), and Urea (Fig. S4) were showed, accounting for 83% of the total 11 N fertilizers consumption. The interannual variations of percentage for most states were relatively small within seven years (Fig. S4). The percentages of some states showed larger fluctuations but were in a reasonable range. A few largest interannual changes were found in Iowa for AnA (13.3±3.1%), Missouri for AN (5.4±1.6%), Illinois for NS (8.6±2.4%), and Indiana for Urea (5.2±1.9%).
Supplementary Figure S4. State-level proportion of Anhydrous Ammonia, Ammonium Nitrate, Nitrogen Solution, and Urea fertilizer use to national total consumption during 1963-1969.
12 Estimating the ratio of application timings for 11 single N fertilizer types Due to the physical and chemical differences between N fertilizer types, applying N fertilizers at specific timings can enhance crop production and reduce N loss. To assign consumption of each N fertilizer type into four application timings, namely, Fall (previous year), Spring (before planting), At planting, and after planting, we took the Agronomy Guide of applicatoin timings (Mengel et al., 2017) as reference (Table S8). We set the N use ratio for timings that is classified as Unadapted in Guide as zero. The N ratios in other timings were assigned according to the relative priority of Poor, Good, and Excellent. Take Ammonium Nitrate as an example, the ratios of Fall, Spring, At planting, and After planting were assigned as 0, 0.3, 0.3.5, and 0.3.5, respectively. Nevertheless, the practical situation may be different to the Guide due to the use of nitrification inhibitors and variations in seasonal fertilizer price. We further adjusted the timing ratios according to the survey from Bierman et al. (2012).
Supplementary table S8. Agronomy Guide of application timings for 11 N fertilizer types (Mengel et al., 2017) Fertilizer Material Fall Spring At planting After planting Dry Solid Forms Ammonium Nitrate Unadapted Good Excellent Excellent Ammonium Sulfate Excellent Excellent Excellent Good Sodium Nitrate Unadapted Good Excellent Excellent Urea Excellent Excellent Excellent Good Calcium Nitrate Unadapted Good Excellent Excellent Diammonium Phosphate Excellent Excellent Excellent Excellent Monoammonium Phosphate Excellent Excellent Excellent Excellent Ammonium Phosphates Excellent Excellent Excellent Excellent Liquid Forms Anhydrous Ammonia Excellent Good Excellent Unadapted Aqua Ammonia Excellent Good Excellent Unadapted Nitrogen Solutions Poor Excellent Excellent Unadapted Sodium Nitrate and Monoammonium Phosphate were not listed in the original guide, we assumed they were suggested the same as Calcium Nitrate and Diammonium Phosphate, respectively.
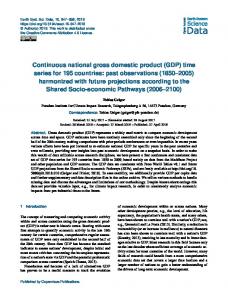
13 Fraction of N fertilizer use rate in four application timing to annual N use rate in 2015 To explore the N use characteristics at different application timings across the contiguous U.S., we divided the total N use rate by N use rate of each application timing and generated the fraction of N use at four timings in 2015 (Fig. S5). In most regions, such as the Northwest, the east of the Northern Great Plains, the Midwest, the Southeast, and the Northeast, the majority of N fertilizer was applied in spring and after planting (>40%) (Fig. S5b&d). Meanwhile, farmers in some regions preferred applying N fertilizer in fall or at planting due to the late growth season of some specific crop types or the habits of fertilizer use. For example, the winter wheat in the Southern Great Plains and the north of the Northwest received most of fall-applied N fertilizer (Fig. S5a), which is equivalent to the fertilizer use before planting for other crops and contributed to the rise of winter wheat yield (Mahler et al., 1994). Moreover, corn and soybeans in Minnesota, Iowa, and Michigan in the Midwest received over 30% of annual N in fall, which may be related to the lower fertilizer price and favorable weather and soil conditions in the season (Dinnes et al., 2002). In comparison, At planting N fertilizer uses for spring wheat and barley were only found in Montana and Wyoming (Fig. S5c).
Supplementary Figure S5. The fraction of N use rate at four timings to total N use rate in 2015. a, Fall (previous year); b, Spring (before planting); c, At planting; d, After planting.
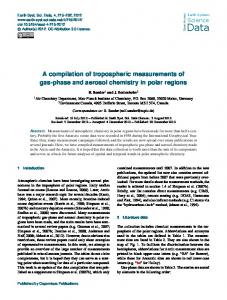
14 Comparison of spatial distribution of N fertilizer use rate in 1997 between Ruddy et al. (2006) and this study We compared the spatial distribution of N use rate in 1997 between Ruddy et al. (2006) and our map (Fig. S6). Ruddy et al. (2006) used top-down approach to obtain the N use rate by dividing the total county-level N consumption by agricultural area within the county. While we adopted the bottom-up approach to generate the N use rate based on the state-level crop-specific N use rate and cropland distribution map developed by Yu and Lu (2017) and Yu et al. (2018).
Supplementary Figure S6. N fertilizer application rate across the contiguous U.S. in 1997. (a) Ruddy et al. (2006); (b) this study
15 Comparison of national crop-specific application timing ratio between Wade et al. (2015) and this study We estimated state-level crop-specific application timing ratio based on the survey from USDAERS (2016). We further compared our results with the national application timing ratio of corn, cotton, spring wheat, and winter wheat reported by Wade et al. (2015). The differences between
our study and Wade et al. (2015) are relatively small (0-6 %), with the largest difference found in after-planting cotton (6%) (Table S9). Supplementary table S9. Comparison of national application timing percentage of corn, cotton, spring wheat, and winter wheat from Wade et al. (2015) and this study, respectively. Application timing
Wade et al. (2015) (%)
This study (%)
Difference (%)
Fall-corn
20
18
2
Fall-cotton
7
8
1
Fall-spring wheat
21
22
1
Fall-winter wheat
36
36
0
Spring-corn
50
50
0
Spring-cotton
28
31
3
Spring-spring wheat
42
43
1
Spring-winter wheat
5
5
0
After planting-corn
22
23
1
After-cotton
59
53
6
After-spring wheat
5
6
1
After-winter wheat
45
44
1
Fall refers to the fall in previous year. Spring refers to the time before planting. Difference is the absolute difference between Wade et al. (2015) and this study.
16 Temporal change of ratio of the sum consumption of 11 single N fertilizers to national total We calculated the temporal change of the ratio of 11 N fertilizers in sum to the national N consumption (Fig. S7). Generally, the ratio was below 50% before 1950 and increased rapidly to above 85% after 1980. The rest of percentage represents small fraction of other single N fertilizers and large fraction of mixed N fertilizers used. Due to a lack of data and the difficulty in accounting
N content in mixed N fertilizers, we adopted the 11 major single N fertilizers to estimate the NH4+N and NO3--N fraction of historical N fertilizer use in each state. However, according to Mehring et al. (1946), ammonium N accounted for only 2% of mixed fertilizer N in 1900 but gradually rose to 72% of mixed N fertilizer from 1925 to 1944. Therefore, we might overestimate the NH4+-N fraction before 1925 while underestimate the fraction after 1925.
Supplementary Figure S7. Temporal percentage of 11 N fertilizers to total N consumption.
Reference Association of American Plant Food Control Officials (AAPFCO): Commercial Fertilizers (1986, 1996, 2006, 2012), available at: http://www.aapfco.org/publications.html, last access: 19 November 2017, 2017. Bierman, P. M., Rosen, C. J., Venterea, R. T., and Lamb, J. A.: Survey of nitrogen fertilizer use on corn in Minnesota, Agr. Syst., 109, 43-52, 2012. Brakebill, J. W. and Gronberg, J. M.: County-Level Estimates of Nitrogen and Phosphorus from Commercial Fertilizer for the Conterminous United States, 1987-2012, U.S. Geological Survey
data release, Available at: https://doi.org/10.5066/F7H41PKX, last access: 19 October 2017, 2017. Dinnes, D. L., Karlen, D. L., Jaynes, D. B., Kaspar, T. C., Hatfield, J. L., Colvin, T. S., and Cambardella, C. A.: Nitrogen management strategies to reduce nitrate leaching in tile-drained midwestern soils, Agron. J., 94, 153-171, 2002. FAO (Food and Agriculture Organization of the United Nations): FAO online database, available at: http://www.fao.org/faostat/en/#data/RF, last access: 19 October 2017, 2017. Heffer, P., Gruère, A., and Roberts, T.: Assessment of Fertilizer Use by Crop at the Global Level 2014-2014/15, International Fertilizer Association (IFA) and International Plant Nutrition Institute (IPNI) Report A/17/134 rev, available at: https://www.fertilizer.org/En/Statistics/Agriculture_Databases/Agriculture_Committee_Databa ses.aspx?New_ContentCollectionOrganizerCommon=1#New_ContentCollectionOrganizerCo mmon, last access: 16 March, 2018, 2017. Ibach, D. B. and Adams, J. R.: Fertilizer Use in the United States by Crops and Areas, 1964 Estimates, USDA-Economic Research Service and Statistical Reporting Service, Statistical Bulletin No. 408, Washington, D. C., 1967. Ibach, D. B., Adams, J. R., and Fox, E. I.: Commercial Fertilizer Used on Crops and Pasture in the United States, 1959 Estimates, USDA-Economic Research Service and Agricultural Research Service, Statistical Bulletin No. 348, Washington, D. C., 1964. IPNI (International Plant Nutrition Institute): A Nutrient Use Information System (NuGIS) for the U.S. Norcross, GA. November 1, 2011, available at: www.ipni.net/nugis, last access: 1 Marth 2018, 2018. Mahler, R. L., Koehler, F. E., and Lutcher, L. K.: Nitrogen Source, Timing of Application, and Placement: Effects on Winter Wheat Production, Agron. J., 86, 637-642, 1994. Mehring, A. L., Wallace, H. M., and Drain, M.: Consumption and trends in the use of fertilizer in the year ended June 30, 1944, USDA, Washington, DC, 1946. Mehring, A. L., Adams, J. R., and Jacob, K. D.: Statistics on Fertilizers and Liming Materials in the United States, USDA-Agricultural Research Service, Statistical Bulletin No. 191, Washington, DC, 1957. Mengel, D.B.: Types and Uses of Nitrogen Fertilizers for Crop Production, available at: https://www.extension.purdue.edu/extmedia/AY/AY-204.html, last access: 19 November 2017, 2017. Nickerson, C., Ebel, R., Borchers, A., and Carriazo, F.: Major uses of land in the United States, 2007, USDA, Economic Research Service, available at: https://www.ers.usda.gov/publications/pub-details/?pubid=44630, last access: 19 October 2017, 2011. Ruddy, B. C., Lorenz, D. L., and Mueller, D. K.: County-level estimates of nutrient inputs to the land surface of the conterminous United States, 1982–2001, USGS Scientific Investigations Report 2006–5012, 17 pp., available at: http://pubs.usgs.gov/sir/2006/5012/, last access: 19 November 2017, 2006. Sheridan, R. C.: Chemical fertilizers in southern agriculture, Agr. Hist., 53, 308-318, 1979.
USDA (U.S. Department of Agriculture): Fertilizer Used on Crops and Pasture in the United States, 1954 Estimates, USDA-Agricultural Research Service, Statistical Bulletin No. 216, Washington, D. C., 1957. USDA (U.S. Department of Agriculture): Consumption of Commercial Fertilizers and Primary Plant Nutrients in the United States, 1850-1964, and by STATES, 1945-64, USDA-Statistical Reporting Service, Crop Reporting Board, Statistical Bulletin No. 375, Washington, D. C., 1966. USDA (U.S. Department of Agriculture): Consumption of Commercial Fertilizers, Primary Plant Nutrients, and Micronutrients, 1850-1969, USDA-Statistical Reporting Service, Crop Reporting Board, Statistical Bulletin No. 472, Washington, D. C., 1971. USDA (U.S. Department of Agriculture): Commercial fertilizers consumption for year ended June 30, USDA-Statistical Reporting Service, Crop Reporting Board, Washington, D. C., 1977 USDA-ERS (U.S. Department of Agriculture-Economic Research Service): Fertilizer Use and Price, available at: https://www.ers.usda.gov/data-products/arms-farm-financial-and-cropproduction-practices/, last access: 19 November 2017, 2013. USDA-ERS (U.S. Department of Agriculture-Economic Research Service): Tailored Reports: Crop Production Practices, available at: https://www.ers.usda.gov/data-products/fertilizer-use-andprice/, last access: 19 November 2017, 2016. USDA-NASS (U.S. Department of Agriculture-National Agricultural Statistics Service): Agricultural Chemical Use Program, available at: https://www.nass.usda.gov/Surveys/Guide_to_NASS_Surveys/Chemical_Use/index.php, last access: 19 November 2017, 2017. Wade, T., Claassen, R., and Wallander, S.: Conservation-practice adoption rates vary widely by crop and region, U.S. Department of Agriculture-Economic Research Service, EIB-147, available at: https://www.ers.usda.gov/publications/pub-details/?pubid=44030, last access: 19 November 2017, 2015. Yu, Z. and Lu, C. Q.: Historical cropland expansion and abandonment in the continental U.S. during 1850 to 2015, Glob. Ecol. Biogeogr., 27, 322-333, DOI: 10.1111/geb.12697, 2017. Yu, Z., Lu, C., Cao, P., and Tian, H.: Long‐term terrestrial carbon dynamics in the Midwestern United States during 1850‐2015: Roles of land use and cover change and agricultural management, Glob. Change Biol., 24,2673-2690, DOI: 10.1111/gcb.14074, 2018.