Tomihisa Welsh, Klaus Mueller, Wei Zhu, Nora Volkow, Jeffrey Meade. State University of New York at Stony Brook and. Brookhaven National Laboratory.
Graphical Strategies to Convey Functional Relationships in the Human Brain: A Case Study Tomihisa Welsh, Klaus Mueller, Wei Zhu, Nora Volkow, Jeffrey Meade State University of New York at Stony Brook and Brookhaven National Laboratory dition or for an experimental group. Despite the popularity of this basic approach, it does not directly explore the functional relationships between different brain regions. The limitation of this approach is that it treats each voxel as an isolated entity. In reality, neurons in the brain have many connections to other neurons and form a network of connected activity. There are other limitations and practical problems with a voxel-based approach. One issue is the low statistical power from the large number of comparisons using a small spatial region [9]. Another issue is how to combine multiple subjects into a single image given the anatomical variability in human brains. Typically all images are transformed into a common anatomical coordinate system (i.e. Talairach-Tournoux [lo]) before being combined. The anatomical locations of active voxels are identified by the corresponding locations of these voxels in the stereotaxic atlas. The problem with this technique lies in the inaccuracy of the transformation to stereotaxic space given the wide variable in human brain structure. These limitations have led to an approach where voxels are combined into manually defined anatomical regions for each subject. Statistically active voxels are counted or intensities are averaged over an anatomically defined ROI for each subject. This approach also allows a more powerful statistical test given the same number of subjects in the voxel-based approach [4]. Another advantage of this technique over the voxel-based approach is that by collapsing data for anatomically similar voxels into one measurement, we are able to quantify relationships between userdefined regions rather than image-defined voxels. Thus brain function can be modeled as a network of correlated regions in addition to associating metabolic activity with an experimental condition. The difficulty of this approach is that given n ROIs, there are approximately n2 relationships which must be quantified and visualized. In this paper we will discuss the statistics we used to study functional connectivity and our approach to visualizing the dataset.
ABSTRACT
Brain imaging methods used in experimental brain research such as Positron Emission Tomography (PET) and Functional Magnetic Resonance W R I ) require the analysis of large amounts of data. Exploratory statistical methods can be used to generate new hypotheses and toprovide a reliable measure of a given effect. Qpically, researchers report theirjndings by listing those regions which show significant statistical activity in a group of subjects under some experimental condition or task. A number of methods create statistical parametric maps (SPMs) of the brain on a voxelbasis. In our approach statistics are computed not on individual voxels but on prede3ned anatomical regions-of interest (ROIs). A correlation coefficient is used to quanti& similarity in responsefor various regions during an experimental setting. Since the functional inter-relationships can become rather complex and spatially widespread, they are best understood in the context of the underlying 3 - 0 brain anatomy. Howevel; despite the power of the 3-0 model, the relative location of ROIs in 3 - 0 can be obscured due the inherent problem of presenting 3-0 spatial information on a 2-0 screen. In order to address this problem, we have explored a number of visualization techniques to aid the brain researcher in exploring the spatial relationships of brain activiy, In this paper; we present a novel 3-0 interface that allows the interactive exploration of correlation datasets. 1 INTRODUCTION The study of the brain has benefited enormously from brain imaging technology such as Positron Emission Tomography (PET) and Functional Magnetic Resonance Imaging (fMRI). Both technologies are used for functional mapping of the brain by associating brain activity with an experimental condition. In particular, regional activation under fMRI is associated with blood oxygenation level. Using PET technology, a wide range of positron-emitter compounds can be measured in the brain including oxygen and glucose (FDG) to measure metabolic activity and radiolabeled drugs such as cocaine [ll]. With both technologies, data is acquired as a 3-D volume consisting of voxels where each voxel represents a single value of brain activity in a rectilinear grid. The traditional approach of analyzing brain imaging data involves creating statistical parametric maps (SPMs) for a brain dataset. SPMs are images of a single or multiple (combined) subjects where each voxel has an associated statistic. Thus, SPMs can be used to test a hypothesis about the function of a given brain region by examining the activity on the voxel level with an associated statistic. The researcher then examines the brain volume to reveal which brain regions are active during an experimental con-
2 STATISTICAL METHODS Presently, linear relationships are explored with correlation analysis and principal component analysis (PCA). Both measures are used to quantify response for a group of subjects during two conditions: control and drug state. 2.1 Correlation Analysis Traditionally, the brain functional connectivity is defined in terms of correlations or covariances [3]. In a typical PET study, two images are acquired with and without drug influence. Given a measured difference in intensity values between the two conditions, ROIs are positively correlated if intensity values vary across subjects in the same direction during the two conditions. Negative correlations indicate activity which varies in the opposite direction between conditions. Further, high correlation indicate a high connectivity between the two ROIs or similar sensitivity to the drug.
contact: { tfwelsh, mueller} @cs.sunysb.edu: WWW: http://www.cs.sunysb.edu/-tfwelsh/BrainMiner
0-7803-7200-x/01/$10.0002001 IEEE.
48 1
A correlation matrix is generated to represent all possible inter-relationships between ROIs. In addition, multiple ROIs can be combined into groups to form a hierarchical structure. A pvalue is also generated in order to set the threshold. Further, correlation coefficient differences are calculated in order to display the difference between two groups of subjects.
2.2 Principal Component Analysis (PCA) PCA is concerned with explaining the variance-covariance structure of a set of variables through a few linear combinations of these variables. Its general objectives are data reduction and interpretation. An analysis of principal components often reveals relationships that were not previously suspected and thereby allows interpretations that would not ordinarily result. In addition, we sometimes find that the components have a natural physical meaning. For example, in the process of measuring various characteristics of an organism, the first component may provide an overall measure of size, and the second an overall measure of shape. In terms of functional connectivity, a principal component represents a distributed brain system with high inter-correlations. Furthermore, since the principal components are mutually orthogonal, these systems are functionally independent (unconnected) from each other although any brain region may be implicated in more than one system. PCA has been widely applied in brain connectivity studies with PET, SPECT, fMRI or EEG [1][12]. For instance, Andersson et al. [I] studied brain networks affected by synchronized sleep visualized by PET. Herbster et al. [8] examined functional connectivity in auditory-verbal short-term memory in Alzheimer's disease.
Figure 2. The 3-D interface. an intuitive means for the brain researcher to explore the functional relationships represented by the ROI correlation matrix. The correlation matrix contains the correlation value (ranging from -1.0 to 1 .O) between every ROI. Since the correlation matrix contains n2 relationships, it is not feasible to show all of the relationships at the same time. We designed the interface so that the user selects a "root" ROI; the color of the other ROIs indicates the correlation value in relation to the current root ROI. In order to aid the researcher in identifying the ROI locations in relation to a standard brain, the ROIs are drawn in 3-D with an MRI volume, an iso-surface of a brain and a digitized version of the Talairach atlas. Since most researchers are accustomed to viewing brain images in 2-D slices, a side window also displays the current slice from the Talairach atlas or the MRI volume (not shown in figures). The objects can be rotated using a virtual trackball interface [2]. The MRI volume is sliced in three orthogonal directions to provide axial, coronal and/or sagittal views simultaneously. Figure 1 is a screenshot of the Graphical User Interface (GUT) of the system, where a basic view with a few ROIs is shown. Because the number of ROIs can be quite large (about 400 in our system), the user can select both a positive and negative threshold for correlation values so only the most significant relationships are displayed. The software will automatically fit the full range of the rainbow color map to the selected range of correlations. Figure 3 shows the detailed steps of a typical session. The figure shows how the system can be used to explore spatial relationships between regions in 3D. In addition, the figure demonstrates how ROT networks are explored interactively. By viewing the difference in activity between the two patient groups, regions which differ significantly are highlighted. This provides a mechanism for discovering new significant areas which might not have been noticed previously. Because we are displaying 3-D relationships on a 2-D screen, it becomes very difficult for the user to tell the 3-D positions of the individual ROIs. To overcome this difficulty, a number of techniques were investigated to provide depth cues for the ROIs (see Figure 4 at end of paper):
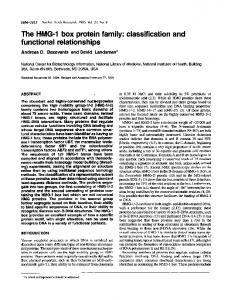
3 VISUALIZATION The traditional approach to viewing fMRl and PET data is to overlay functional images over a high resolution MRI. The 3-D volume is explored either a slice at a time or all at once using a light box display (Figure 1).
Figure 1 . The 2-D interface. The decomposition of the dataset into 2-D slices for visualizing 3-D relationships becomes limiting when functional relationships are widely spread over the brain. When activity is spread across an axis, the researcher is forced to look at many different slices to view a single relationship. To account for the problems with the 2-D approach, we have also developed (in addition to a 2D viewer), a 3-D visualization interface. The primary goal of the 3-D interface (Figure 2) is to provide
1. A movable, semitransparent Talairach atlas slice (or an MRI slice) helps the user determine which ROIs are on the same slice. Figure 4a shows a movable sheet that maps the slice of the Talairach atlas at the specified height, ROIs that intersect the sheet are highlighted by a circle.
482
5 CONCLUSIONS ROI-based statistical analysis of imaging data is a promising means of studying hnctional connectivity of brain regions. We have found that an interactive 3-D interface can be used effectively to explore a correlation matrix. Using a 3-D interface, the grouping of ROI networks can be observed in one scene, rather than being split by an arbitrary slicing scheme as with a 2-D interface. By combining a surface of the brain, a sliced MRI volume and digitized slices of the Talairach atlas we were able to provide familiar clues to the researcher on the spatial information for each ROI along with the relevant statistical information. As a matter of fact, the concept of viewing statistical data in their native domain seems to have practical value in other fields as well. Generally, statisticians view their data in domain-neutral plots. By inserting the data in the domain they originated from, perhaps hypothesis could be drawn more effectively, especially when non-statisticians are involved. There are a number of statistical measures that we are currently implementing in this project to aid in data exploration. First, we hope to use cluster analysis to aid in pattern recognition and data reduction. Second, we plan to expand the statistical measures to include univariate procedures such as the t-test, z-test, F-test, ANOVA, ANCOVA and multiple regressions. Finally, will use a "ranking" statistic to aid in identifying ROIs which show the strongest relationships. By combining a multitude of statistical measures with 3-D visualization we hope to provide a versatile tool for data exploration. Resident brain researchers use the system routinely in their research. A public release is planned in the future.
2. A single light source is placed above the volume in a fixed position: This provides specular lighting cues for the height and depth of each ROI sphere (Figure 4b and Figure 4a-d). 3. ROIs are enhanced by colored halos or coasters, where the colors code their height and depth on a rainbow color scheme. The ROIs are connected by dashed iso-height and iso-depth lines to the MRI volume which suggests the ROls position in 3-D space (Figure 4c). 4. A colored grid of iso-lines can be projected onto the two volume slices, again encoding height and depth in a rainbow map. Colored shadows cast onto the third exposed volume slice provide additional cues (see Figure 4d). 5. ROIs are projected onto the brain iso-surface (Figure 4e). Since the ROIs are mainly located close to the brain surface (i.e. on the brain cortex), one can generate a comprehensive, EEG-like view by projecting the ROIs onto the closest cortex surface and by painting the projection in the correlation color. 6. Spatially clustered ROI networks are grouped into composite polygonal objects, thus reducing the object complexity of the scene (Figure. 40. For now we simply increased the radius of the ROI spheres until they touched. This relatively simple approach is quite effective. In the future we plan to estimate the actual hull of a set of ROIs of similar brain function and display this hull as a polymesh.
4 RESULTS The visualization software was written in C++ using libraries for OpenGL and the Fast Light Toolkit (FLTK) [7]. Versions were compiled for Irix 6.4 (MIPS compiler), Windows 2000 (Microsoft Visual C++ 6.0) and Linux (GCC 2.7) and run on an SGI 0 2 / R1000, a Pentium 11 class laptop and a Pentium 233 respectively. The MRI slices were drawn using 2-D texture mapping; each slice for each axis was pre-loaded into memory in order to increase rendering speed. The surface of the brain was also displayed as a triangular mesh generated from the Marching Cubes algorithm. The original mesh consisted of 92,000 vertices and 154,000 triangle faces. The triangular mesh was decimated to eight varying levels ranging from 10,000 to 154,000 triangle faces using Qslim software [6][5]. The user could select the decimation level in order to adjust rendering speed and surface resolution. ROIs were rendered as spheres. The correlation value was represented for each ROI as a color intensity in relation to a selected "root" ROI. Because correlation values were clustered around a low absolute value, the color map was scaled using a square root function to increase contrast. PET fluoro-18-deoxyglucose (FDG) images were analyzed and displayed for two major drug addiction studies. The first study included 30 subjects the second included 40 subjects both under baseline and drug conditions. Metabolic activity was measured for each subject as the average intensity signal for a given ROI defined by a trained medical doctor. ROI locations for the first study included 424 anatomically significant regions while the second study included 120 regions. Correlation matrices were generated for each of these ROI datasets (i.e. 424x424 and 120x120 correlation matrices. Interactive exploration of both the 120x120 and 424x424 correlation data was possible at reasonable frame rates for all platforms. In addition, the user interface was able to display correlation data for each ROI along with an MRI volume and a digitized version of the Talairach atlas.
ACKNOWLEDGMENTS We thank the Center for Data Intensive Computing (CDIC) at Brookhaven National Laboratory for fimding this project.
REFERENCES J. Andersson, H. Onoe, J. Hetta, K. Lidstrom, S. Valind, A. Lilja, A. Sundin, K. Fasth, G. Westerberg, J. Broman, Y. Watanabe, B. Langstrom. Brain Networks Affected by Synchronized Sleep Visualized by Positron Emission Tomography. J Cereb Blood Flow Metab. 18(7):701-15, July 1988. M. Chen, S.J. Mountford, A. Sellen. A Study In Interactive 3-D Rotation Using 2-D Control Devices. SIGGRAPH '88, pp. 121-129, 1988. J. J. Eggermont. The Correlative Brain- Theory and Experiment in Neural Interaction. Springer-Verlag, New York, 1990. K. J. Friston, A. P. Holmes, K. J. Worsley, J. P. Poline, C. D. Frith, R. S. J. Frackowiak. Statistical Parametric Maps in Functional Imaging: A General Linear Approach. Hum. Brain Map. 2, pp. 189-210, 1995. M. Garland, P. Heckbert. Surface Simplification Using Quadric Error Metria. SIGGRAPH '97, 1997. http://graphics.cs.uiuc.edu/-garland/software/qslim.html http://www.fltk.org A. Herbster, T. Nichols, M. Wiseman, M. Mintun, S . DeKosky, J. Becker. Functional Connectivity in Auditory-verbal Short-term Memory in Alzheimer's Disease. Neuroimage, 4(2):67-77, October 1996. A.P. Holmes. Non-parametric Analysis of Statistic Images From Functional Mapping Experiments. Ph.D. Thesis, Univ. of Glasgow, 1994. J. Talairach, Co-Planar Stereotactic Atlas of the Human Brain, Thieme:Stuttgart, 1988. N. D. Volkow, B. Rosen, L. Farde. Imaging the Living Human Brain: Magnetic Resonance Imaging and Positron Emission Tomography. Proc. Natl. Acad. Sci. 94, pp. 2787-2788, 1997. B. Weder, N. Azari, U. Knorr, R. Seitz, A. Keel, M. Nienhusmeier, R. Maguire, K. Leenders, H. Ludin. Disturbed Functional Brain Interactions Underlying Deficient Tactile Object Discrimination in Parkinson's Disease", Hum. Brain Map. 1l(3): 13 1-45, November 2000.
483
(a) Data is loaded into the default view. This particular dataset contains correlations for a control group and an alcohol group. (b) The user selects a threshold. The colormap will scale to fit the selected range of the threshold interval in order to maximize the use of all of the colors in the colormap. Also, a particular view is selected by rotating the brain with the mouse.
(c) The user explores spatial relationships. The brain volume can be sliced along three orthogonal axes. The Talairach atlas provides a familiar context for the ROI positions. (d) The user picks an initial region of interest for the alcohol group. The “root” ROI is selected by double-clicking on the region. The patient group is selected by clicking on the buttons in the lower right of the interface.
Figure 3 . A typical sesssion. Color images can be viewed on the conference CD-ROM or at the author’s website: http://www.cs.sunysb.edultfivelshiBrainMiner.
484