Graphical User Interface to Generate Waveforms for a Wrist Pulse Simulator Used in Traditional Chinese Medicine Education Joseph Maestri, Sarah Borges, George Halkidis, Mona Boudreaux,* G. Faye Boudreaux-Bartels, and Ying Sun Department of Electrical, Computer, and Biomedical Engineering, University of Rhode Island, Kingston, RI 02881, USA; * A Circle in Time, Wonder Lake, IL 60097, USA. Correspondence email:
[email protected]
Abstract—Pulse diagnosis in traditional Chinese medicine (TCM) involves palpating the radial arterial pulses with three fingers and using the determined pulse characteristics such as strength, depth, and rate to ascertain particular ailments of the patients. TCM specialists are able to detect approximately 28 pulse patterns. Previously, a wrist pulse simulator was developed to generate the palpating forces directly with solenoids, but showed a limited flexibility in specifying the pulse waveforms. This study aimed to improve the previous system by modifying the software, redesigning certain components with 3D printing, and creating a graphical user interface that allows for generation of any desired pulse waveform. By linking hand-drawn waveforms to palpation feelings, the device has provided an innovative pedagogical tool for teaching the practice of pulse diagnosis. Keywords—pulse diagnosis; simulator; graphical user interface; traditional Chinese medicine
I. INTRODUCTION Traditional Chinese Medicine (TCM) uses the pulse diagnostic technique as an essential tool for diagnosing certain patient illnesses and diseases [1]. With three fingers (index, middle, and ring fingers) the practitioner palpates the radial pulse at the wrist [2]. The characteristics of the pulse are tested and noted at three different finger depression pressures: “superficial” pressure, “intermediate” pressure, and “deep” pressure [3]. This information enables practitioners to determine the causes of a variety of patient’s symptoms. Previously, a pulse diagnosis simulator was developed based on three solenoids under the control of an embedded microprocessor [4]. In the present study, the original design was further improved and extended in its functionality. The main focus of this project was on the development of a graphical user interface (GUI) such that pulse waveforms can be easily specified and downloaded to the embedded processor for execution. The core of the GUI was an image analysis software capable of tracing a curve in an image and converting it to a time sequence of digital data points. The pulse waveforms could be physiological pressures recorded digitally or on a strip chart. Moreover, because the pulse palpation feelings are often a more abstract concept difficult to describe verbally, the GUI was designed such that hand-drawn waveforms can easily be traced and turned into pulse pressure waveforms delivered via the pulsations of the three solenoids.
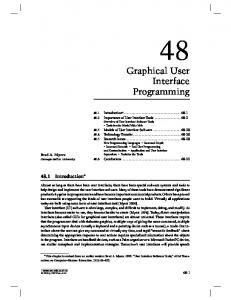
Fig. 1: Schematic diagram of the pulse simulator that uses three solenoids to produce the wrist pulse pressure waveforms.
II. METHODS A. System hardware As shown in Fig. 1, three solenoids were fitted into a plastic container created by using SolidWorks (Waltham, MA) and 3D printing. The container was placed inside a customized hand model made of silicone rubber. The solenoids moved the plastic pushers that were the contact points for the user's three fingers. The pulsations of the solenoids (SMT-1632S12A-R, Jameco Reliapro) were controlled by the microcontroller (PIC18F4525, Microchip, Chandler, AZ) via three 12-bit serial digital-toanalog converters (TLC5616, Texas Instruments, Dallas, TX) using Darlington-pair transistors as current drivers. A pressure sensor (A401-25, Tekscan, South Boston, MA) was used to record the magnitude of applied pressure via the thumb and, based on the magnitude and the corresponding pulse pressure
42nd Annual Northeast Bioengineering Conference, SUNY Binghamton, Vestal, NY, April 5-7, 2016
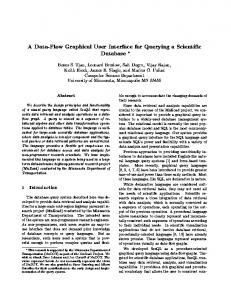
setting, adjusted the pulsations of the solenoids accordingly. The firmware for the microcontroller was developed in the C language using the MPLAB integrated development environment (Microchip, Chandler, AZ). B. Software development Software development for the graphical user interface (GUI) was accomplished in the C++ language using the crossplatform wxWidgets tool (www.wxwidgets.org). The GUI allowed a hand-drawn pressure waveform to be digitized and downloaded to the pulse simulator for execution. The waveform could be either created with a graphic software or drawn on paper and then scanned to an image. The curve tracing process started with a thinning algorithm based on a 4neighbor connectivity threshold filter [5]. The 4-neighbor connectivity filter used in this design scanned the image with a 3x3 pixel mask, checking the four edge connected pixels to the center pixel against a threshold. If all four edge connected pixels satisfied the threshold requirement, the center pixel was sampled. A median filter was used as an option to smooth the curve while preserving the edges. Then, the x and y coordinates were extracted sequentially from the curve to form a time sequence representing the pressure waveform. The GUI allowed the user to load an image, select the grayscale threshold for the filter, and specify the desired amplitude and time scale for the resulting waveform. The final output was a series of 8-bit numbers corresponding to the coordinates of each pixel satisfying the user selected threshold requirement, as well as a timer value for the hardware. The amplitude of the waveform was scaled to fit within a user selected range, then shifted to the correct starting amplitude for the hardware. The waveform was integrated into the C code in MPLAB, downloaded to the PIC18F4525 microcontroller, and implemented in a custom wave mode in addition to the other preset waveform modes. III. RESULTS The wrist pulse simulator was successfully constructed. The GUI was developed on a PC laptop. A selection of drawn waveforms were used to test the GUI and the pulse simulator. As shown in Fig. 2 (left), three conceptual arterial pressure waveforms for young, older, and hypertension cases were drawn freehand. After the curve tracing process, the digitized waveforms were downloaded to the pulse simulator for execution. The output voltages of the D/A converters that drove the solenoids were able to represent the desired waveforms, as shown in Fig. 2 (right).
Fig. 2. Hand-drawn wrist pulse waveforms (left) and the corresponding simulator waveforms outputted by the digital-to-analog converters (right).
of the pulse simulator provides a unique possibility to create a certain palpation feeling by designing, drawing, and executing a conceptual wrist pulse pattern. For future work, the GUI will be further improved to allow for the specification of a set of waveforms that represent the time delays among the solenoids and the changes in response to the three different finger depression pressures (superficial, intermediate, and deep). In addition, the GUI will be ported to a handheld device such as a smartphone and the downloading of the waveforms will be made possible via a Bluetooth wireless link. ACKNOWLEDGMENT We would like to thank the URI Undergraduate Research Initiative Awards program for their generous financial support of this project. We would also like to thank Dr. Eugene Chabot, James Moretti, and the URI Image Processing Laboratory for their technical support and advice. REFERENCES [1]
IV. DISCUSSION The main contribution of this study was the development and implementation of a graphical user interface that traces and scales user defined pulse waveforms for the wrist pulse simulator. The wrist pulse diagnosis technique – capable of differentiating 28 pulse patterns – is a powerful and essential diagnostic tool in traditional Chinese medicine. However, teaching students to practice pulse diagnosis could be a challenge because of the lack of an effective demonstration for many less frequently occurring pulse patterns. Thus, the GUI
[2] [3]
[4]
[5]
Walsh, S., and E. King. Pulse Diagnosis: A Clinical Guide. 1st edition. Churchill Livingstone, ISBN-10: 0443102481, 2007. B. Flaws. The Secret of Chinese Pulse Diagnosis. 3rd edition. Blue Poppy Press, ISBN-10: 1891845586, 2012. S. Dharmananda, “The significance of traditional pulse diagnosis in modern practice of Chinese medicine,” http://www.itmonline.org/arts/ pulse.htm, August, 2000. S. McLellan et al., "A microprocessor-based wrist pulse simulator for pulse diagnosis in traditional Chinese medicine," 40th Annual Northeast Bioengineering Conference, April 25-27, 2014. Sonka, M., V. Hlavac, and R. Boyle. Image Processing, Analysis, and Machine Vision, 4th ed., CL Engineerin, ISBN-10: 1133593607, 2014.