Gravitational Approach to Supervised Clustering for Bi-class Datasets Umut Orhan, Mahmut Hekim Gaziosmanpasa University, Electronics and Computer Department, 60250 Tokat, Turkiye
[email protected],
[email protected] Abstract There have been many researches about supervised clustering. The problem of common supervised clustering is to train a clustering algorithm by avoiding overfitting. To solve this problem, we develop a new algorithm based on gravitational cluster centers. The novel method avoids overfitting by taking account of the gradient between the misclassification error and the number of gravity centers. Also, it detects the number of gravity centers and their locations from the dataset. Two dimensional synthetic dataset are used in order to provide several viewpoints into this new method. Also, it is tested by using a benchmark datasets.
1. Introduction Supervised clustering methods classify patterns in a dataset by using class labels. According to similarity concept which is very important measure for supervised clustering, similar patterns are assigned to the same clusters and cluster centers are selected as representatives among patterns of that clusters. There are two approaches to supervised clustering methods; the nearest neighbor and the minimum distance. In the nearest neighbor approach, each pattern is a cluster, and in the minimum distance approach, each class has only one cluster. The approaches which have more than one cluster for each class are more successful. Learning vector quantization (LVQ) is a supervised clustering method which finds representative patterns using cluster analyze [1] (Kohonen, 2001). Self generating neural tree is an iterational method [2] (Wen et al., 1992). Some other methods are based on hyper-spheres [3](Reilly, 1982), hyperellipsoids [4](Kositsky and Ullman, 1996) or hyper-rectangles [5](Salzberg, 1991). Expectation Maximization and Gaussian mixture models estimate the class densities [6](Hastie et al., 2001). [7] Kudo et al. (1996) and [8] Takigawa et al. (2004) offered a method based on minimum enclosing axis-parallel boxes. Two algorithms offered by Takigawa et al. [9](2009) are based on the minimum enclosing convex balls. There have been some methods related with logical analysis of box-based data ([10] Eckstein et al., 2002; [11] Alexe and Hammer, 2006), and ball-based combinatorial classifier ([12] Cannon et al., 2002; [13] Priebe et al., 2003; [14] Cannon and Cowen, 2004; [15] Marchette, 2004). The method offered by [16] Fayed et al. (2007) starts with one cluster per class, shifts patterns from a cluster to another, and then merges clusters. The most common problems of the methods above are the selection of initial locations and the number of clusters. Thus, they must be re-run several times for different number of clusters. In this paper, we offer a new supervised clustering algorithm for bi-class datasets coping with these problems. We focus on learning the number of clusters, their weights and the overfitting from patterns.
The paper is organized as follows. In Section 2, the structure of new supervised clustering is presented. In Section 3, we apply a synthetic and real datasets to verify the effectiveness of our method. Finally, the conclusions are given in Section 4.
2. Gravitational Approach to Supervised Clustering for Bi-class Datasets According to the law of gravitation, each gravity center affects its surroundings by proportion of its weight. Inspired by this law, suppose that each cluster center is a gravity center. The patterns far from a cluster center are less affected by that center; on the contrary, the points closer to a cluster center are more affected by that center. Each pattern in a dataset has a weight based on neighborhood. In order to see class of a pattern, the gravity effect of each known cluster on that pattern must be determined. For this aim, the weights of each pattern are calculated by using Equation 1. n
wi =
¦ j =1
1
(1)
2
xi − x j
where xi − x j is Euclidean distance between patterns xi and xj, and n is the number of patterns in dataset. The pattern xm which has maximum weight (wm) is selected as a cluster center (cm). The classification effect of Ck class over xi pattern is calculated by Equation 2. k
EiC =
¦
cm ∈C
wm k
cm − xi
2
, for k ∈ {0,1}
(2)
The estimated class of a pattern is determined by Equation 3. °C 0 xi ∈ ® °¯C 1
0
, E iC > E iC
1
for i =1, 2,…,n
(3)
, other
xi pattern is identified as a misclassified pattern if its label is not the same with the determined class. Then, the pattern with maximum weight among the misclassified patterns is assigned as a new cluster center. The gradient between misclassification error and the number of cluster centers is important for training the algorithm. In the region where the gradient is nearly zero, the learning process stops and overfitting starts. Therefore, the gradient must be controlled by the algorithm. Our learning algorithm consists of the following steps. Step 1. The weight of each pattern is calculated by Equation 1. The pattern with maximum weight is selected as a cluster center for each class.
II-398
0 0
Step 2. Calculate the classification effect for each pattern by Equation 2. Step 3. Determine the class label for each pattern by Equation 3. If determined class label of a pattern does not equal to its label in dataset, signify it as a misclassified pattern. Step 4. Calculate the gradient between misclassification error and the number of cluster centers. If it is less than a user determined threshold, stop the algorithm. Step 5. Select the misclassified pattern with maximum weight as a cluster center. Go to Step 2.
0
0
0
0
0
0 0
0
0
0
0
1
1 1
1
1
1 1
1 1
1 1
1
1
1
1
1
1
1
1
1
1
1
1
1
1
1
1
1
11
1
(a) 0 0 0
0
0
0
0
0
0
0
0
0 0
0
1 0
0
0 0
1
0
1
1
0 0
1
1
1
1
1
1
1 1
1 1
1
1 1
1
1
1 1
1 1
1
1 1
1
1
1
1
1
1
(a) 0 0 0
0 0
0
0 0
0
0
0
0
0
0 0 0
1
0
0
1 1
0
0
1 1
1
1
11
0
1
1 1 1
1 1
1
1 1
1 1
1
1
1
1
1 1
1
1 1 1 1
1
1
1
1 1
1
1
1
1 1 1 1 1
1 1 1 1
1
1 1
1
1
1
1 1 1 1
1
0 0
0 0
1
0
0
1 1 1
1
1
1
1 1
1
11
1
1
0,5 1 1 1 1 11
1 1 1
1
1 1
0
1
1
1 1
0 0 0
1
1 1
1 1
1
1
1
1
1
1
1 1
0
0
1
0
0
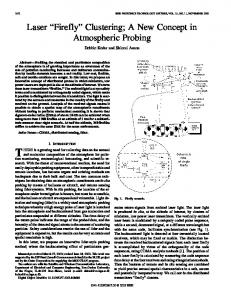
The method classifies this dataset which has 158 patterns with outliers. In Figure 2(a), the algorithm reaches success 96.84% by determining 2 cluster centers in case of avoiding overfitting. As seen in Figure 2(b), if the algorithm is continued until it is reached success 100%; it results in total 14 cluster centers. Figure 3 shows the gradient between misclassification error and the number of cluster centers for synthetic dataset.
1 1 1
1
00
0
0 0
1
0
0
0
1
1
0
1
1
1 1 1
11 1
0 0
1 1
0
0
0
1
0
0 0
(b) Figure 2. The classification of the method for a dataset including outliers (a) by avoiding overfitting (b) by not avoiding overfitting.
1
1
1
1 1
1 1
1
1
1
1
1 1
1
1 1
1
1
1
1
1 1
1
1
1
1
1
1 1
0 0
1 1
1 1
1
1 1
1
1 1
0
0 0
1
1 1 1
1
1 1
0 0
1
1 1
1
1
1
1
1
1
0
0 0 0 0 00 0
0
1
0 0
0
0 0 0
1
0 0
1
1
1
1 1
1
1
1
1
1 1
1
1
1 1
1 1
1
1
0 1
1
0
0 0 0
0
1
1 1
0
0
1
0 0
0 0 0
1
0
0
0 0
0
0
0
0
0
0
0
0
0
0 0
0
0
0
0
0
0 0 0 0
0
0
0
0 0
0 0
0
0
0
0
0
0 0
0 0
0
0 0
0
0 0
0
0
0
0
00 0
0
0
0
0 0
0
11
1
1
1 1
1
1 1 1 1 1
1 1 1
1
1 11 1 1
1
0,4 misclassification error
0
0
0
0 0
0
0
0
1
1
0 0
0
0
0
0 0
0
0
0
1
1
1 1
1
0 0
0
1 1
1
1 1 1
11 1
1
1
1
1 1
1 1
0
1
1 1 1
0
0 0
0
0 0
1 1
1
0
1
0
0
0 0 0 0
1
0 0
1
1
1
In this section, two dimensional synthetic dataset and multidimensional benchmark real dataset are used in order to provide several viewpoints into this new method. Figure 1 shows the classification of the novel method for another dataset which has no outliers.
0 1
1
0 0
0
0
0
1
0
0 0 0 00
0
0
0 0
0 0
0
1
0
0 0 0
0
0 1
1
0
0 0
0
1
0
0
0
0 0 0 0
1
0
0 0
00
3. Numerical Results and Comparisons
0
0
0 0
0 0
1
1
(b)
Figure 1. The classification of the method for two dataset without any outlier.
0,3
0,2
0,1
The classification constructed by using proposed method is illustrated in Figure 2(a) and 2(b) for a synthetic dataset with outliers.
0 0
2
4
6
8
10
12
14
the number of cluster centers
Figure 3. The gradient between misclassification error and the number of cluster centers for synthetic dataset with outliers.
II-399
misclassification error
For dataset in Figure 1, the success of the algorithm is 96.84% with 2 cluster centers, but this success increases only 3.16% even though 12 more cluster centers are added. In order to test our algorithm, we applied it to a benchmark dataset (Haberman’s Survivals) obtained from University of California at Irving Machine Learning Repository [17]. This dataset contains cases from a study that was conducted between 1958 and 1970 at the University of Chicago’s Billings Hospital on the survival of patients who had undergone surgery for breast cancer. The one of the classes is the patient died within 5 year and the other is the patient died within 5 year. The dataset contains 306 patterns with 3 attributes. For this dataset, the success of novel method is 74,84%. Figure 4 shows the gradient between misclassification error and the number of cluster centers for a benchmark dataset.
[7]
[8]
[9]
[10]
[11]
[12]
0,8 0,6
[13]
0,4
[14]
0,2 0 0
6
12
18
24
[15]
30
the number of cluster centers
[16]
Figure 4. The gradient between misclassification error and the number of cluster centers for Haberman’s Survival dataset.
[17]
As seen in Figure 4, overfitting starts when the number of cluster centers reaches to 6.
4. Conclusions In this paper, we proposed a new supervised clustering method. It selects cluster centers among patterns with dense neighborhood without overfitting. The main aim of this method is to learn the number of cluster centers and its locations. It also controls overfitting and does not require any input parameters.
5. References [1]
[2]
[3] [4]
[5] [6]
Kohonen, T., 2001. Self organizing maps. Springer Series in Information Sciences, 30, 3rd ed., Berlin, Springer Verlag. Wen, W.X., Jennings, A., Liu, H., 1992. Learning a neural tree, International Joint Conference on Neural Networks, Beijing, 751–756. Reilly, D., Cooper, L., Elbaum, C., 1982. A neural model for category learning. Biol. Cybernet. 45, 35–41. Kositsky, M., Ullman, S., 1996. Learning class regions by the union of ellipsoids. Proceedings of the 13th International Conference on Pattern Recognition (ICPR), vol. 4, 750–757. Salzberg, S., 1991. A nearest hyperrectangle learning method. Machine Learning 6, 277–309. Hastie, T., Tibshirani, R., Friedman, J., 2001. The elements of statistical learning: data mining, inference, and prediction. Springer, Stanford, CA.
II-400
Kudo, M., Yanagi, S., Shimbo, M., 1996. Construction of class regions by a randomized algorithm: a randomized subclass method. Pattern Recognition 29, 581–588. Takigawa, I., Abe, N., Shidara, Y., Kudo, M., 2004. The boosted/bagged subclass method. International Journal of Computing Anticipatory Systems, 14, 311–320. Takigawa, I., Kudo, M., Nakamura, A., 2009. Convex sets as prototypes for classifying patterns. Engineering Applications of Artificial Intelligence, 22, 101-108. Eckstein, J., Hammer, P.L., Liu, Y., Nediak, M., Simeone, B., 2002. The maximum box problem and its application to data analysis. Computational Optimization and Applications 23(3), 285–298. Alexe, G., Hammer, P.L., 2006. Spanned patterns for the logical analysis of data. Discrete Applied Mathematics, 154(7),1039–1049. Cannon, A.H., Ettinger, J.M., Hush, D., Scovel, C., 2002. Machine learning with data dependent hypothesis classes. Journal of Machine Learning Research, 2, 335–358. Priebe, C.E., Marchette, D.J., DeVinney, J.G., Socolinsky, D.A., 2003. Classification using class cover catch digraphs. Journal of Classification, 20, 3–23. Cannon, A.H., Cowen, L.J., 2004. Approximation algorithms for the class cover problem. Annals of Mathematics and Artificial Intelligence, 40, 215–223. Marchette, D.J., 2004. Random Graphs for Statistical Pattern Recognition. Wiley, NewYork. Fayed, H. A., Hashem, S.R., Atiya, A. F., 2007. Selfgenerating prototypes for pattern classification. Pattern Recognition, 40, 1498-1509. 2008, 12, 01, UCI Machine Learning Repository Available: http://archive.ics.uci.edu/ml