NOVEMBER 2015
BLUMBERG ET AL.
2305
Ground-Based Temperature and Humidity Profiling Using Spectral Infrared and Microwave Observations. Part II: Actual Retrieval Performance in Clear-Sky and Cloudy Conditions W. G. BLUMBERG Cooperative Institute for Mesoscale Meteorology Studies, University of Oklahoma, Norman, Oklahoma
D. D. TURNER NOAA/National Severe Storms Laboratory, Norman, Oklahoma
U. LÖHNERT Institute for Geophysics and Meteorology, University of Cologne, Cologne, Germany
S. CASTLEBERRY School of Meteorology, University of Oklahoma, Norman, Oklahoma (Manuscript received 19 December 2014, in final form 1 September 2015) ABSTRACT Although current upper-air observing systems provide an impressive array of observations, many are deficient in observing the temporal evolution of the boundary layer thermodynamic profile. Ground-based remote sensing instruments such as the multichannel microwave radiometer (MWR) and Atmospheric Emitted Radiance Interferometer (AERI) are able to provide profiles of temperature and water vapor through the boundary layer at 5-min resolution or better. Previous work compared these instruments through optimalestimation retrievals on simulated clear-sky spectra to evaluate the retrieval accuracy and information content of each instrument. In this study, this method is duplicated using real observations from collocated MWR and AERI instruments from a field campaign in southwestern Germany. When compared with radiosondes, this study confirms the previous results that AERI retrievals are more accurate than MWR retrievals in clear-sky and below-cloud-base profiling. These results demonstrate that the AERI has nearly 2 times as much information as the MWR.
1. Introduction Several reports published by the U.S. National Research Council (NRC) have highlighted a goal for the atmospheric community: the development of a national network of ground-based boundary layer thermodynamic profilers (NRC 2009, 2010). Such a network would eliminate a significant gap in the abilities of the current set of U.S. upper-air observing platforms (primarily satellites and radiosondes) in continuously observing the boundary layer and would assist various atmospheric scientists in the public, private, and academic sectors in
Corresponding author address: Greg Blumberg, OU/CIMMS, 120 David L. Boren Blvd., Norman, OK 73072. E-mail:
[email protected] DOI: 10.1175/JAMC-D-15-0005.1 Ó 2015 American Meteorological Society
meeting their missions. Therefore, this network would need to sense variables such as temperature, humidity, and wind at high temporal, vertical, and spatial resolution. Soon after the release of the NRC reports, efforts to identify current technologies that would meet the NRC requirements were begun. One workshop, funded by the National Weather Service and the National Center for Atmospheric Research, identified several ground-based passive and active remote sensing technologies that could constitute such a network (Hoff and Hardesty 2012). In particular, two passive remote sensors—the multichannel microwave radiometer (MWR) and the Atmospheric Emitted Radiance Interferometer (AERI)—were singled out as commercially available instruments that met many of the NRC requirements and could therefore act as thermodynamic profiling nodes of the proposed
2306
JOURNAL OF APPLIED METEOROLOGY AND CLIMATOLOGY
network. Because such a network requires a significant monetary investment, an understanding of the relative performance between the two instruments was needed. Both the AERI and MWR measure downwelling radiance emitted by the atmosphere. These radiance observations, which encompass spectral regions where different gases have a range of absorption features, contain information on the thermodynamic profile in the viewing direction of the instrument. By using retrieval algorithms, the thermodynamic profile can be derived from these radiance observations. This is an ill-defined and illconstrained problem because many different thermodynamic profiles are consistent with a single AERI or MWR observation within the instrument noise level. Many papers have been published that use various retrieval methods to derive thermodynamic profiles, ranging from fast, statistically based retrievals (e.g., Liljegren et al. 2005; Löhnert and Maier 2012) to more computationally intensive physically based retrievals (e.g., Hewison 2007; Feltz et al. 1998; Feltz et al. 2003). One physically based retrieval method, named the optimalestimation technique (Rodgers 2000), stands out because of its ability to provide retrieval-solution uncertainty estimates and information-content metrics in addition to the retrieved profile. Past papers have looked at the accuracy of optimalestimation retrievals applied to MWR and AERI observations (Hewison 2007; Löhnert et al. 2009; Cimini et al. 2010; Turner and Löhnert 2014), but a side-by-side accuracy and information-content comparison has not been performed with real instruments using the same retrieval framework and constraints. The comparison of retrievals from real data is essential to understanding the expected performance characteristics of the retrieved profiles from the two instruments. This study follows a method that is similar to the one outlined in Löhnert et al. (2009, hereinafter L09) in that it applies the optimal-estimation retrieval method to data collected by collocated AERI and MWR instruments. With these retrievals, we use collocated radiosondes to determine the expected accuracy and information content of each instrument.
2. Instrumentation This study analyzes data from a collocated first-generation Humidity and Temperature Profiler (HATPRO) MWR and an AERI instrument to characterize the performance of optimal-estimation thermodynamic retrieval algorithms on passive ground-based remote sensors. From April to December of 2007, these instruments were deployed to the Murg valley in Heselbach, Germany, as part of the Convective and Orographically-induced
VOLUME 54
Precipitation Study (COPS; Wulfmeyer et al. 2011). The AERI instrument was part of the U.S. Department of Energy’s Atmospheric Radiation Measurement (ARM; Mather and Voyles 2013) Mobile Facility (AMF; Miller and Slingo 2007) instrument suite. The University of Cologne provided the HATPRO instrument for this study. During this deployment, the AMF launched Vaisala, Inc., radiosondes four times per day at approximately 0500, 1100, 1700, and 2300 UTC. These radiosondes served as the truth profile for the AERI and HATPRO retrievals.
a. The AERI The AERI is a ground-based passive spectrometer that receives downwelling infrared radiation between the wavelengths of 3.3 and 19.2 mm (520–3000 cm21) at a spectral resolution of better than one wavenumber (Knuteson et al. 2004a). The AERI records a downwelling spectrum roughly every 30 s. It has a hatch that closes in precipitation to protect the instrument’s foreoptics, which makes retrieving profiles when liquid precipitation is falling impossible. For this experiment, the random noise in the observed AERI spectra was greatly reduced by a principal-component-based noise filter (Turner et al. 2006). In addition to the noise filter, 5-min averages of the spectra were taken before any retrieval was performed. The AERI uses two well-characterized blackbody targets to maintain its calibration. The emissivity of these targets is greater than 0.999, with the temperature of one blackbody fixed at 608C and the other floating at the ambient temperature. These targets are viewed approximately every 5 min. The regular viewing of these targets results in a calibration uncertainty that is better than 1% of the ambient radiance (Knuteson et al. 2004b). Each of the spectral channels of the AERI is calibrated independently, and thus the random errors in each channel are assumed to be independent of one another (Turner and Löhnert 2014). The first AERI retrieval algorithm developed, the ‘‘AERIprof’’ algorithm (Smith et al. 1999; Feltz et al. 1998, 2003), used two water vapor bands for moisture profiling (538–588 and 1250–1350 cm21) and four spectral regions in carbon dioxide (CO2) bands for temperature profiling (612–618, 624–660, 674–714, and 2223–2260 cm21). This study uses all of these channels except the 2223–2260 cm21 band to retrieve temperature and water vapor mixing ratio. Per the instrument-simulation study in L09, this excluded band has a limited impact on the retrieval accuracy, and modeling the solar scattering that occurs within this band accurately is computationally expensive (Turner and Holz 2005).
NOVEMBER 2015
BLUMBERG ET AL.
2307
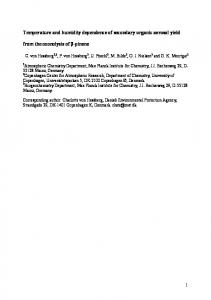
FIG. 1. Weighting functions computed using the U.S. Standard Atmosphere, 1976 for the channels used in the AERI and HATPRO retrievals. Shown are the weighting functions for channels used in the AERI (a) temperature and (b) water vapor mixing ratio retrievals. Here, 1 RU is equal to 1 mW (m2 sr cm21)21. In (b), the weighting functions for both the 538–588 cm21 (red curves) and 1250–1350 cm21 (gray curves) bands are given. Also shown are the weighting functions used for the MWR (c) temperature (51–60 GHz) and (d) water vapor mixing ratio (22.2– 31.4 GHz) retrievals. The brown curves in (c) indicate how the 58-, 57-, and 56-GHz channel weighting functions are modified by performing off-zenith scans at 158 above the horizon.
Weighting functions provide an indication of where in the atmosphere the AERI instrument is sensitive to changes in the thermodynamic profile. The weightingfunction value for a given wavelength and altitude is defined as the emission at that height multiplied by the transmission from that level to the instrument. Weighting functions for the AERI’s temperature-sensitive channels in the CO2 band (i.e., the 612–714 cm21 channels) are shown in Fig. 1a. Weighting functions from the water vapor–sensitive channels are shown in Fig. 1b for 538–588 cm21 (red curves) and 1250–1350 cm21 (gray curves). These weighting functions generally show much larger values near the surface that then decrease with
altitude, suggesting that most of the information in the AERI radiance (for these spectral channels) originates in the lowest 2 km of the atmosphere.
b. The HATPRO Like the AERI, ground-based MWRs receive downwelling radiation emitted by the atmosphere, but they do so in the microwave part of the electromagnetic spectrum. The HATPRO microwave radiometer (Rose et al. 2005) measures microwave radiation in 14 channels: 7 channels are distributed around the 22.2-GHz water vapor absorption line from 22.2 to 31.4 GHz (i.e., the K band) and the other 7 are on the long-wavelength
2308
JOURNAL OF APPLIED METEOROLOGY AND CLIMATOLOGY
side of the 60-GHz oxygen-absorption feature from 51.8 to 58.8 GHz (i.e., the V band). The K-band channels can be used to obtain column-integrated water vapor with limited information on the profile of humidity, whereas the V-band channels are primarily sensitive to the temperature-profile retrieval (Liljegren et al. 2001; Hewison 2007; Löhnert and Maier 2012). In addition, the K-band and lower-frequency V-band observations are sensitive to liquid water path, which has increasing absorption with frequency. Because of its filter bank and direct-detection architecture, the HATPRO is able to make observations in all channels simultaneously with a temporal resolution of 1 s. The information in MWR observations about the temperature profile can be increased if elevation scans are used in the retrieval (Crewell and Löhnert 2007). Because including these observations assumes that the atmosphere is horizontally homogeneous, only scans from channels with high optical depth (e.g., the 56-, 57-, and 58-GHz channels) are used in the retrievals, because more-transparent channels may sense atmospheric structures (e.g., clouds) that are not directly overhead. The HATPRO that was deployed took bilateral offzenith scans at 428, 308, 19.28, 10.28, and 5.48 from the horizon, and the observations were averaged to reduce the impact of any horizontal inhomogeneity of the atmosphere. These elevation scans were conducted roughly every 20 min, with 1-s zenith observations collected between scans. Because we desired the most accurate retrieval of thermodynamic profiles, we averaged the zenith observations nearest to the elevation scans to create a temporal sampling of roughly 20 min. Many of the 14 HATPRO channels generally have a much lower opacity than the AERI channels. This becomes clear by comparing the AERI water vapor weighting functions (Fig. 1b) with the water vapor weighting functions from the HATPRO (Fig. 1d): the latter are only weakly dependent on height and consequently HATPRO observations contain less height information on water vapor than do those of the AERI. For the V band, however, HATPRO elevation-scan weighting functions (Fig. 1c; brown curves) provide additional sensitivity to the temperature profile within the boundary layer so that, together with the zenith weighting functions, these become more comparable to those of the AERI (Fig. 1a). The HATPRO, like most ground-based MWRs, has an internal blackbody kept at the ambient temperature that is viewed regularly (typically every couple of minutes) to help to maintain its gain calibration, but the system noise (absolute offset) needs to be determined regularly, on the order of months. Two methods are applied to achieve this calibration. The first is the socalled tip-cal method, wherein observations are made by
VOLUME 54
low-opacity channels that respond linearly as the air mass increases (usually K-band channels) during an elevation scan in cloud-free, homogeneous sky conditions. Han and Westwater (2000) provide a detailed discussion of the tip-cal method, which has many subtleties. The tip-cal method cannot be applied to channels in which the transmissivity of the atmosphere is too low (such as the V-band channels at most surface locations), however. Instead, alternating views of the ambient internal blackbody and a second blackbody target filled with liquid nitrogen (LN2) at ;77 K are used to calibrate the instrument. This method must be done manually, and in practice it can be difficult to get an accurate calibration of better than 1-K total error (Maschwitz et al. 2013). Throughout the course of the COPS experiment, the HATPRO underwent several tip-cal and LN2 calibrations. Despite this procedure, additional postprocessing in the form of a bias-correction optimal-estimation retrieval was necessary to obtain better-quality thermodynamic retrievals from the HATPRO.
3. Optimal-estimation retrievals The optimal-estimation retrieval method used in this study is an iterative Gauss–Newton retrieval technique that uses a forward model F to relate the retrieved variables X to the observations Y (Rodgers 2000). The uncertainties specified in the retrieval are assumed to be Gaussian, which simplifies the matrix calculations. The Se matrix is the sum of the variances of the observation uncertainty SY and the forward-model uncertainty B and describes the total uncertainty of the radiometric observations. Because the retrieval problem is ill defined, an a priori dataset is used to constrain the solution, with Xa representing the prior profile and Sa being its covariance matrix. Because of the nonlinearity of the infrared and microwave radiative transfer models, at each iteration n the Jacobian of the forward model Kn is computed using finite differences; the Jacobian contains the sensitivity of the forward model to perturbations in the current estimate of the state vector Xn and thus provides the information on how the retrieval solution should change to get closer to the observation Y. The retrieval iterates, each time solving for an improved estimate of the state vector Xn11 until the retrieval converges upon a solution. The optimal-estimation equation used is 21 T 21 T 21 Xn11 5 Xa 1 (gS21 a 1 Kn Se Kn ) Kn Se
3 [Y 2 F(Xn ) 1 Kn (Xn 2 Xa )],
(1)
where superscripts 21 and T denote matrix inverse and transpose, respectively. The g factor is used to better constrain the retrieval in the early iterations (Masiello
NOVEMBER 2015
BLUMBERG ET AL.
et al. 2012) and allows thermodynamic profiles to be retrieved from the AERI even in cloudy conditions when the first guess of the state vector is poor (Turner and Löhnert 2014). In this study, two optimal-estimation retrieval algorithms (‘‘AERIoe’’ and ‘‘MWRoe’’) were used to obtain vertical profiles of temperature T(z) and water vapor mixing ratio Q(z). The retrieval algorithms used in this study to retrieve thermodynamic profiles from the AERI and HATPRO are virtually identical and follow the framework of Turner and Löhnert (2014). Both retrievals take in radiance measurements at specified frequencies, the surface pressure, and an estimate of the lowest cloudbase height from a collocated ceilometer. For information on the optimal-estimation equations and convergence criteria used by the retrievals in this study, see Turner and Löhnert (2014).
a. AERIoe AERIoe (Turner and Löhnert 2014) retrieves thermodynamic profiles and cloud properties from AERI spectra. AERIoe was designed as an alternative to the previous AERIprof algorithm, which has been used for studies on convection initiation and severe-storm forecasting (Feltz and Mecikalski 2002; Wagner et al. 2008). AERIoe overcomes many of the limitations of AERIprof in that it is able to retrieve in both clear and cloudy scenes and can reach convergence from any first guess. AERIoe utilizes the Line-by-Line Radiative Transfer Model, version 12.2 (LBLRTM; Clough et al. 1992; Turner et al. 2004; Clough et al. 2005), as its forward model. In addition to the thermodynamic profile, AERIoe retrieves cloud properties such as liquid water path (LWP) and effective radius. AERIoe accomplishes this by not using observations from the 1250–1350 cm21 water vapor band. Although this band is used in the AERIprof and L09 retrievals, AERIoe must neglect this band because the LBLRTM does not treat scattering and there is a large amount of scattering of infrared radiance by clouds in this band relative to other bands used in the retrieval (Turner and Löhnert 2014). Using only the 538– 588 cm21 water vapor band (i.e., vs using this band and the 1250–1350 cm21 band) reduces the information content contained within the AERI spectra.
b. MWRoe MWRoe was developed to apply the optimal-estimation framework to microwave radiometer observations. Its framework is virtually identical to the AERIoe algorithm, but MWRoe uses the Monochromatic Radiative Transfer Model (MonoRTM), version 4.2 (Clough et al. 2005), as its forward model and it only retrieves LWP in addition to the thermodynamic profiles. In addition, the observation
2309
uncertainty of the HATPRO instrument specified in the SY matrix was taken from the HATPRO noise levels specified in L09, which are typical generation-1 HATPRO noise values. It is important to mention that for this study the MWRoe and AERIoe retrievals used exactly the same prior information (Xa and Sa).
4. Refining the HATPRO calibration Thermodynamic profiles retrieved from the HATPRO data were initially found to be severely biased (Fig. 2; green curves), which stressed the need to characterize the instrument better before running MWRoe. Following the work done in Löhnert and Maier 2012, we began to determine HATPRO instrument characteristics by performing a clear-sky closure study on the microwave radiometer data. This closure study used a set of clear-sky HATPRO spectra paired with collocated radiosondes. Any radiosonde moisture biases were corrected by scaling its water vapor profile using the method in Turner et al. (2003) to agree with the precipitable water vapor values retrieved from a collocated AMF two-channel (23.8 and 31.4 GHz) microwave radiometer (Turner 2007). To perform our closure study, we modified the MWRoe MonoRTM [RT in Eq. (2)] by adding two forward-model parameters. The first parameter, a frequency offset Df added to frequency f, accounted for spectral biases in each HATPRO channel. Second, radiometric biases were characterized by adding a brightness temperature offset DTb to each calculated brightness temperature. The new MWRoe forward model F(Xn) for HATPRO brightness temperatures at iteration n and a single frequency is now F(Xn ) 5 DTb 1 RT[T(z), Q(z), LWP, f 1 Df ].
(2)
The frequency offset allows the MWRoe retrieval to characterize the instrument bandpass and any uncertainties in the exact center frequency of the HATPRO channel. The brightness temperature offset handles any biases imparted by a poor HATPRO calibration. These two offsets are specified in the forward model to separate the contributions of bias into time-dependent (DTb) and time-independent (Df) sources of error. These offsets were solved simultaneously through 14 separate optimal-estimation retrievals: one retrieval for each of the 14 HATPRO channels. Like MWRoe, each retrieval used Eq. (2) for the forward model to compute brightness temperatures, but, whereas MWRoe solves for T(z), Q(z), and LWP, these additional retrievals solve for Df and DTb using a set of known clearsky T(z) and Q(z) profiles. Therefore, the clear-sky
2310
JOURNAL OF APPLIED METEOROLOGY AND CLIMATOLOGY
VOLUME 54
FIG. 2. A sample comparison between the MWRoe retrievals performed without the bias correction (green curves) and with the bias correction (blue curves) for the HATPRO observations at 1130 UTC 18 Nov 2007. The black curves show the thermodynamic profile from a radiosonde launched around the same time as the HATPRO observations. Shown are the MWRoe (a) temperature retrievals and (b) water vapor mixing ratio retrievals. Also shown are (c) the observed zenith brightness temperature values Y minus the forward-model calculation F(X) using the thermodynamic profile from the final iteration of the MWRoe retrieval. The error bars in (c) are the MWRoe retrieval Se 1-sigma uncertainties.
paired HATPRO–radiosonde observations were used, and zenith brightness temperature observations from the 103 clear-sky HATPRO–radiosonde pairs found between April and December 2007 made up the retrieval observation vector Y. Each of the 14 retrievals retrieved one Df and a time series of DTb(t) values, where t represents a correction for a single clear-sky HATPRO–radiosonde pair. The Df made up the first element of the state vector X, and the remaining elements were DTb(t). The retrieval a priori Xa for all of these values were set to zero. The a priori 1-sigma uncertainty values Sa were estimated by using the generation-1 HATPRO bandpass values for the V-band channels shown in Fig. 1 of Löhnert and Maier (2012) and by analyzing the initial brightness temperature residuals between the biased MonoRTM calculation and HATPRO observations. In the retrieval, frequency offset values were only allowed for V-band channels because a priori estimates of frequency offsets for these channels were known; therefore, a priori 1-sigma uncertainties for the K-band frequency offsets were set close to 0. This setting stopped the retrieval from solving for a frequency offset for the K-band channels. All 14 retrievals converged, and the results indicated three primary periods in which the retrieved brightness temperature offsets were constant with time. Each period was separated by an LN2 calibration that was performed on the instrument (not shown). Only results from the last period are considered in this study, because they are relevant to the time period of data that we used to compare the AERI and HATPRO. The results from this last period (Table 1) suggested that the lowest four V-band frequencies should use frequency offsets ranging from 44 to 162 MHz to better characterize the radiometer. These retrieved frequency offsets are similar to those reported
in the generation-1 bias correction performed in Löhnert and Maier (2012), who note that some uncertainty exists in the actual central frequency of the radiometer. Table 1 also shows that the typical brightness temperature offset for the K-band channels ranged from 22 to 20.6 K. This range of brightness temperature offset values was similar for the V-band channels (from 22 to 0.1 K). Because the brightness temperature offsets and their uncertainties were generally stationary in time, they were linearly interpolated to provide brightness temperature bias corrections to HATPRO observations that were not used in the actual bias-correction retrievals. Sample MWRoe retrievals showed that this calibration fix (Fig. 2; blue curves) improved the quality of the TABLE 1. Retrieved median brightness temperature offsets DTb and frequency offsets Df from the bias-correction retrieval. Retrieved DTb below are from a single period of time bounded by an LN2 calibration. The dates of this period are from 2 Aug to 31 Dec 2007. Numbers in parentheses indicate the 1-sigma uncertainties from the retrieval. Table cells with an em dash correspond to values of less than 0.01 GHz. Frequency (GHz)
Median DTb (K)
Df (GHz)
22.24 23.04 23.84 25.44 26.24 27.84 31.40 51.26 52.28 53.86 54.94 56.66 57.30 58.00
22.0894 (0.01) 21.9020 (0.01) 21.6296 (0.01) 20.6965 (0.01) 20.7782 (0.01) 20.6753. (0.01) 20.7982 (0.01) 22.1686 (0.197) 21.8759 (0.197) 22.6201 (0.195) 20.2119 (0.094) 20.0308 (0.032) 20.0066 (0.022) 0.1169 (0.019)
— (—) — (—) — (—) — (—) — (—) — (—) — (—) 20.044 (0.01) 20.162 (—) 20.055 (—) 20.142 (0.01) 0.050 (0.04) 0.060 (0.04) 0.030 (0.05)
NOVEMBER 2015
BLUMBERG ET AL.
thermodynamic retrievals greatly relative to the initial runs. The MWRoe retrieval is able to more accurately retrieve the thermodynamic profile above 1 km with the inclusion of this bias correction. A benefit of using the optimal-estimation framework for the bias correction is that the uncertainties from the bias correction can be propagated through the MWRoe retrieval. Most optimal-estimation thermodynamic retrievals only consider the instrument random 1-sigma noise described in the SY matrix, but, by developing a Jacobian Kb that describes the sensitivity of the forward model to frequency and brightness temperature offsets, the uncertainties of the bias correction B can be included in the MWRoe retrieval by describing the total uncertainties of the spectral observations Se through the following equation:
2311
5. MWRoe and AERIoe retrieval experiments
Each retrieval algorithm assumed a single 300-m-thick cloud existed in the profile and used collocated ceilometer data to place the cloud using the lowest cloud-base height within a 20-min window. If no clouds were identified by the ceilometer in this window, the window was expanded to 3 h. If clouds still were not found, a default cloud-base height of 2 km was set, and if no LWP was retrieved from the instrument then the ‘‘cloud’’ optical depth was effectively zero. In our study, 773 radiosondes that were launched by the AMF during the COPS experiment were used to compute the prior Xa and its covariance Sa. The radiosonde profiles were first interpolated onto the 55-level height grid that had its highest vertical resolution (10 m) at the surface, with the resolution decreasing exponentially with height (1.5 km at 17 km). Both the AERI and MWR retrievals used the same height grid. In this study, the first-guess profile used to begin each retrieval algorithm was the mean prior Xa. Both the MWRoe and AERIoe algorithms were run on a subset of the total HATPRO and AERI data (ARM Climate Research Facility 1994a) that were collected at radiosonde (ARM Climate Research Facility 1994b) launch times. These launch times nominally occurred at 0500, 1100, 1700, and 2300 UTC each day at the AMF between September and December of 2007, which created a total of 295 profiles available for comparison.
a. Retrieval configuration
b. Quality control and classification
A clear-sky-retrieval dataset and a cloudy-skyretrieval dataset were created for analyzing HATPRO and AERI retrievals. To have common retrieval inputs for both datasets and to exclude scattering effects from clouds, the AERIoe algorithm used only the 538–588 cm21 spectral region for water vapor profiling, as was used in Turner and Löhnert (2014). Thus, the AERIoe run on real data used the traditional 538–588, 612–618, 624–660, 674–713 cm21 regions as well as several other window channels in the retrieval. The MWRoe algorithm utilized a combination of zenith and off-zenith observations taken by the HATPRO. Zenith observations from all 14 channels and off-zenith observations from the three strongestabsorbing V-band channels (56.65, 57.3, and 58.0 GHz) at 108, 198, 308, and 458 above the horizon were used in the retrieval. Using off-zenith observations from loweropacity channels would frequently have a negative impact on the retrievals, because the forward model assumes horizontally homogeneous conditions and actual contributions to the downwelling radiance (e.g., clouds) in the vertical column may not be the same along the off-zenith ray path. The retrieval settings to create these datasets are summarized in Table 2.
Before analysis, the data from these retrievals were quality controlled and classified. First, each retrieval pair was removed if either the AERI’s hatch was closed or if the HATPRO had dew or precipitation occurring on the instrument’s radome. This filter left roughly onehalf (166) of the original number of retrievals available, because 82 AERI observations had the hatch closed and 102 HATPRO observations were found to have rain or dew on the radome as the heater of the dew blower malfunctioned during the observation period. Second, only retrieval pairs that converged were kept, which left 162 retrievals (AERIoe and MWRoe converged 99% and 96% of the time, respectively). After the retrievals were quality controlled, the remaining retrievals were split up into a clear-sky dataset (s 5 82) and a cloudy dataset (c 5 45) using AERI-retrieved LWP thresholds. The AERI was primarily used to distinguish between clear and cloudy scenes, because it is more sensitive to low values of LWP than are microwave radiometers (Turner 2007). The clear profiles were identified by finding profiles for which AERIoeretrieved LWP was less than 6 g m22. Cloudy profiles were found when the AERIoe-retrieved LWP was
Se 5 SY 1 KTb B21 Kb .
(3)
This method of error propagation was implemented in MWRoe to provide a more accurate error analysis when real data were used in the retrieval, but the impact of using this more accurate error estimate for Se (Fig. 2c; blue error bars) is small relative to a retrieval that uses only uncertainties from the instrument noise (Fig. 2c; green error bars).
2312
JOURNAL OF APPLIED METEOROLOGY AND CLIMATOLOGY
VOLUME 54
TABLE 2. The input spectral regions, along with forward-model type and the retrieved state vector used in each retrieval algorithm to generate the instrument-comparison datasets. Here, T(z) corresponds to a temperature profile, Q(z) is the water vapor mixing ratio profile, LWP is liquid water path, and Reff is effective radius. The numbers in parentheses next to each spectral region respectively indicate the number of channels within that band and the typical average 1-sigma noise level for that band that is used to develop the SY matrix. The MWRoe off-zenith frequencies that were designated used the same noise levels as those in the zenith scans. Channels with an asterisk were not used in AERIoe runs that use real data. AERIoe Observations (Y, SY)
Forward model [F(X), Kn] Retrieved variables (X)
MWRoe
Zenith wavenumbers: 538–588 cm21 (104, 1.07 RU), 1250–1350 cm21 (207, 0.14 RU),* 612–618 cm21 (12, 0.35 RU), 624–660 cm21 (74, 0.26 RU), 674–713 cm21 (81, 0.16 RU), 860.1–864 cm21 (8, 0.13 RU), 872.2–877 cm21 (11, 0.13 RU), and 898.2–905.4 cm21 (15, 0.12 RU) Off zenith: Not applicable
LBLRTM, version 12.2 T(z), Q(z), LWP, and Reff
greater than 6 g m22 (i.e., there was a liquid cloud present) and the cloud base was between 0.5 and 3 km above the ground in order to analyze the accuracy of the belowcloud-base profile. Although both the AERI and the HATPRO were capable of retrieving in cloudy scenes, cloud bases were limited to above 0.5 km to help to compare their respective performances over a deeper layer.
6. Results a. Retrieval example To check our retrieval algorithms against the ones developed in L09, a single radiosonde was selected and used with the forward models to generate simulated clear-sky AERI and HATPRO spectra. These spectra were used as input for the retrievals to simulate the results as if ideal instruments were used, that is, as if the instruments were perfectly calibrated and the forward model was assumed to be perfect and unbiased (no offsets used). Because the L09 retrievals used both water vapor bands and because it was a clear-sky scene, this single run of AERIoe utilized both available water vapor bands. Random noise generated from the values in Table 2 was included in the simulated observations. Figures 3a and 3b show the retrieved temperature and water vapor mixing ratio from the simulated spectra, respectively. Both algorithms retrieve LWP values that are indicative of clear sky. Like the L09 single-retrieval results, the AERIoe retrieval matches the observed radiosonde profile more closely than does the HATPRO’s retrieval. The 1-sigma uncertainties derived from the diagonal of the posterior covariance matrix S for these retrieved profiles (Figs. 3c,d) also show that the AERI
Zenith frequencies: 22.24–31.40 GHz (7, 0.4 K), 51.25–54.93 GHz (4, 0.5 K), 56.65 GHz (0.3 K), 57.30 GHz (0.25 K), and 58.00 GHz (0.2 K)
Off-zenith frequencies: 56.65, 57.29, and 58.00 GHz Elev angles: 458, 308, 19.28, and 108 MonoRTM, version 4.2 T(z), Q(z), and LWP
retrieval has less uncertainty than the HATPRO retrieval in both the temperature and water vapor mixing ratio retrievals. Also, the cumulative degrees of freedom of signal (CDFS) profiles show that the AERI has 2 times as much information in both the temperature profile (Fig. 3e) and water vapor profile (Fig. 3f) as the HATPRO. The total degrees of freedom of signal (DFS) for both the temperature and water vapor mixing ratio retrievals from both instruments falls within the ranges indicated by L09. Next, the retrieval algorithms were applied to real AERI and HATPRO observations taken at the same time that the radiosonde used to generate the simulated data was released (Fig. 4). The retrieved profiles using real observations (not using the 1250–1350 cm21 band in AERIoe and using calibration offsets in MWRoe) are shown in Figs. 4a and 4b. The retrieved profiles that use real AERI and HATPRO observations are different from those that used simulated observations (Figs. 3a,b), but the AERIoe-retrieved temperature profile still outperforms the MWRoe (Fig. 4a). The AERIoeretrieved water vapor mixing ratio profile has a slight decrease in accuracy relative to the simulated observations, but the radiosonde profile is still within the 1-sigma error bars of the retrieval. In addition, the AERIoe retrievals that used real observations had significantly larger 1-sigma uncertainties (Figs. 4c,d) and lower CDFS profiles (Figs. 4e,f) than did the retrieval that used the simulated observations. These results are to be expected since the retrievals that used real observations used fewer spectral observations. The 1-sigma uncertainty profiles and the CDFS profiles from MWRoe were very similar to the retrievals that used the simulated observations, and the retrieved LWP
NOVEMBER 2015
BLUMBERG ET AL.
2313
FIG. 3. Retrieved (a) temperature and (b) water vapor mixing ratio (WVMR) from the simulated HATPRO (blue curves) and AERI (red curves) observations, where the simulated observations were computed from a radiosonde launched at the AMF site at 1130 UTC 18 Nov 2007 (green curves). Also shown are (c),(d) the 1-sigma uncertainty profiles of the retrievals and (e),(f) the CDFS profiles for temperature and water vapor, respectively. The vertical dashed lines in (e) and (f) denote the total DFS for temperature and water vapor, respectively. In this example, the AERIoe retrieval used both the 538–588 and 1250–1350 cm21 bands for profiling water vapor.
values in Fig. 4 indicate that both instruments are observing clear sky.
b. Bias and RMS-difference profiles in clear and cloudy scenes A common way to compare the accuracy of retrieved thermodynamic profiles is to compute bias and bias-free root-mean-square (RMS)-difference profiles using collocated radiosonde data as the truth profile. Figure 5 shows these profiles for cases in which the sky above the AERI and HATPRO was considered to be cloud free. The absolute value of the AERIoe temperature bias (Fig. 5a; red solid curve) is less than 0.5 K below 2 km and then slowly increases to 0.7 K by 2.5 km, after which it stays constant with height until 5 km. The AERIoe RMS difference (red dashed curve) is 0.3 K at the surface, increases to 1.2 K by 500 m, and is effectively constant with height above that level, with a slight increase to 1.5 K at 4 km. The MWRoe retrieval temperature bias (Fig. 5a; solid blue curve) was below 0.5 K up to 1 km and increased to 0.7 K at 3 km, and the temperature RMS difference (dashed blue curve) changed similarly to that of AERIoe but overall was more than that of AERIoe.
Overall, both the bias and the RMS difference for the AERIoe temperature results were smaller than those from the MWRoe algorithm. These results (Fig. 5a) support the conclusion of L09 that the AERI is superior to the microwave radiometer for clear-sky temperature profiling. The water vapor results between the two retrievals were very similar, with major differences only in the lowest 1.5 km. The absolute value of the AERIoeretrieved water vapor profile bias (Fig. 5b) is less than 0.5 g kg21 below 6 km, and the RMS difference is 0.6 g kg21 at the surface, increases to 1.2 g kg21 at 1.3 km, and then decreases to 0.5 g kg21 at 4 km. Although the MWRoe retrievals have slightly larger biases than do those of AERIoe below 3 km, above 3 km the bias is near zero. The MWRoe RMS difference below 1 km was also slightly larger (1 g kg21) relative to that of AERIoe. This larger bias may be due to errors in the two-channel ARM MWR for which we are unable to account in the bias correction step but is mostly within the error bars of the retrieval shown in Fig. 4d. Between 3 and 5 km, however, the HATPRO has a slightly smaller RMS difference than does the AERI. Except for the differences in
2314
JOURNAL OF APPLIED METEOROLOGY AND CLIMATOLOGY
VOLUME 54
FIG. 4. As in Fig. 3, except that the retrieved profiles came from real HATPRO and AERI observations taken at approximately 1130 UTC 18 Nov 2007. Unlike the simulated data, the AERIoe retrieval only included data from a single water vapor band (i.e., the 1250–1350 cm21 band was not included).
RMS difference in the lowest 1 km, there is no evidence in Fig. 5b that either the AERI system or the HATPRO system offers significantly more accurate profiles than does the other. Because atmospheric scientists would be using these instruments in all environments, it is equally important to assess their performance in cloudy scenes. Given that clouds are semitransparent in the microwave region of the electromagnetic spectrum and are effectively opaque in the infrared, the HATPRO has one advantage over the AERI: the HATPRO is sensitive to changes in temperature and humidity above cloud base (Löhnert et al. 2007). Because of this limitation for the AERI, this paper will investigate the performance of both instruments below cloud base; only bias and RMS-difference profiles up to cloud base were computed for the AERIoe and MWRoe retrievals, again using the radiosondes as truth. These profiles are shown in Figs. 6a and 6b (red curves for AERIoe, and blue curves for MWRoe). Figure 6 limits the profiles up to only 1 km, because above 1 km the number of available samples drops off significantly (Fig. 6c). The temperature results (Fig. 6a) show that the AERIoe and MWRoe biases below cloud base are less than 0.5 K up to 1 km. The temperature RMS difference
profiles show that AERIoe’s profile accuracy is better than that of MWRoe. This result suggests that, although both instruments are viewing a sky that contains a cloud, the AERI temperature profile below the cloud base leads in accuracy, similar to the clear-sky results shown in Fig. 5a. The water vapor results (Fig. 6b) are similar to the clear-sky statistics in that AERIoe and MWRoe profiles below cloud base have biases of less than 1 g kg21, and the AERIoe RMS-difference profile is less than that of MWRoe below the cloud base. These results support the idea that, at least up to 1 km, the AERI is as accurate below the cloud base as it is when there are no clouds overhead.
c. Taylor plots While not featured in L09, an additional set of plots can be used to evaluate how well each retrieved profile can capture the vertical shapes of its truth profile instead of the average accuracy of the whole dataset at each height (Figs. 5 and 6). These Taylor diagrams (Taylor 2001), which were used in Turner and Löhnert (2014) to evaluate the AERIoe algorithm, show Pearson’s correlation coefficient between the truth and retrieved profiles on the y axis and the ratio of the standard deviation
NOVEMBER 2015
BLUMBERG ET AL.
2315
FIG. 5. Bias (solid curves) and RMS-difference (dashed curves) profiles for clear-sky comparisons of the AERIoe (red curves) and MWRoe (blue curves) retrievals with radiosondes (s 5 82); shown are the statistics for the retrieved (a) temperature and (b) water vapor mixing ratio profiles.
of the retrieval to the standard deviation of the truth profile on the x axis. Because these remote sensors have the majority of their sensitivity in the lowest 4 km, the calculations of correlation coefficient and standard deviation only use data between 0 and 4 km. Retrievals that have a correlation coefficient of 1 and a standard deviation ratio (SDR) of 1 are considered to capture all structure in the truth profile perfectly (green dot in Fig. 7). Figures 7a and 7b shows these plots for the clear-sky MWRoe and AERIoe retrievals. For the temperature retrievals, both the HATPRO and the AERI perform well, with correlation coefficients above 0.85; the AERI retrievals have a slightly better ability to resolve structure in the profile as demonstrated by the higher correlation coefficients and SDR values that are closer to 1 relative to the MWRoe retrievals. Figure 7b shows that retrieving water vapor structure is much more difficult with both
remote sensors; the spread in the correlation coefficient is much larger for water vapor than for temperature, and the SDR range is also larger. As was suggested by the clear-sky bias and RMS-difference results below 1 km in Fig. 5, Fig. 7b suggests that the AERI may be slightly better at capturing the structure of the water vapor profile than the HATPRO as the AERI’s SDR bounds are slightly closer to 1 than the HATPRO.
d. Degrees of freedom for signal The CDFS profile metric helps to explain the results of the Taylor plots by showing how the information in the instrument observations is vertically distributed. Figure 8 shows the distribution of CDFS profiles from the clear-sky retrievals; the solid lines denote the median CDFS profiles for the 82 cases. When profiling temperature (Fig. 8a), the maximum DFS is 3 for the
FIG. 6. Bias (solid curves) and RMS-difference (dashed curves) profiles for cloudy-sky comparisons of the AERIoe (red curves) and MWRoe (blue curves) retrievals with radiosondes up to cloud base for all retrievals that had a cloud base between 0.5 and 3 km (c 5 45). Profiles are truncated at 1 km because of sampling issues within this portion of the dataset. Shown are the statistics for the retrieved (a) temperature and (b) water vapor mixing ratio profiles. Also shown is (c) the number of points below cloud base that were used in the computation of the statistics shown in (a) and (b).
2316
JOURNAL OF APPLIED METEOROLOGY AND CLIMATOLOGY
VOLUME 54
FIG. 7. Modified Taylor plots for the retrieved clear-sky (a) temperature and (b) water vapor mixing ratio using the AERIoe (red symbols) and MWRoe (blue symbols) datasets (s 5 82). Each symbol indicates the score for an individual profile, and the green dot centered at (1, 1) indicates a perfect score. The arms of the plotted crosses span the 10th–90th percentiles for the correlation coefficient (vertical arms) and the standard deviation ratio (horizontal arms). The intersection of the arms represents the location of the median correlation coefficient and standard deviation ratio of the given dataset.
HATPRO and 5.5 for the AERI below 6 km. For both instruments, most of this information (approximately 80% of the total information content) is below 1 km. The situation is similar for water vapor (Fig. 8b), but there is less of a gap in median CDFS and there is significantly more variability in the CDFS profiles for water vapor (seen by the spread around the median profile) than for temperature. The shape of the CDFS profiles demonstrates that the AERI has much more of its information in the lowest 1 km (nearly 2/ 3) and is approaching its maximum value by 4 km, whereas the HATPRO’s information content is more evenly distributed with height in the lowest 6 km. The AERI’s higher information content in the lowest 1 km helps to explain why the AERIoe RMSdifference profiles, in both clear (Fig. 5b) and cloudy
conditions (Fig. 6b), are better than the HATPRO retrievals in the lowest 1 km. These overall total DFS values for water vapor are lower than those found in the L09 study, however, because 1) the true observation error in the AERI was greater than that used in the theoretical study and 2) only one of the two water vapor bands was used in the retrievals that used real data.
e. Vertical resolution An additional metric that explains the information within the spectral observations is the vertical resolution of the retrieval (Hewison 2007). Between the two instruments, the AERI is generally able to resolve temperature structures better because it has a better median vertical resolution at all heights (0–4 km) than does the
FIG. 8. CDFS for (a) temperature and (b) water vapor mixing ratio for the clear-sky AERIoe (red) and MWRoe (blue) retrievals that used frequency offsets (s 5 82). The solid curves indicate the median DFS profile, and the shaded areas indicate the 10th–90th percentile of DFS values.
NOVEMBER 2015
BLUMBERG ET AL.
2317
FIG. 9. Vertical resolution for the (a) temperature and (b) water vapor mixing ratio profiles for the clear-sky AERIoe (red) and MWRoe (blue) retrievals (s 5 82). The thick solid lines indicate the median vertical resolution profile, and the shaded areas indicate the 10th–90th percentile of the values of vertical resolution.
HATPRO (Fig. 9a). This reason is why the AERI temperature retrieval in Fig. 4a is able to resolve the 1-kmdeep elevated inversion seen in the radiosonde profile better than the HATPRO. At the inversion height (1.5 km), the AERI temperature vertical resolution is typically 2 km versus the HATPRO’s 3 km. For the water vapor mixing ratio (Fig. 9b), the difference in vertical resolution between the AERI and HATPRO is smaller (less than 1 km from 0.5 to 2 km AGL), and from 3 to 5 km the HATPRO begins to have a better vertical resolution than the AERI as a result of its information in the middle troposphere from the lowopacity K-band channels (Fig. 1d). Because the AERI water vapor weighting functions (Fig. 1b) have shallower slopes, larger magnitudes, and a higher density in the boundary layer relative to the HATPRO K-band channels, the AERI can resolve features better in the lower portion of the atmosphere than can the HATPRO. As was discussed before, this advantage is small because the AERIoe retrievals in this paper are only using one water vapor band as opposed to two. Although this advantage is there, the HATPRO vertical-resolution values have less spread than those of the AERI, because the opacity of microwave wavelengths is less sensitive to variations in thermodynamic structure than is that of infrared wavelengths. Overall, a conclusion from Fig. 9 and Fig. 1 is that, although the AERI spectra are unable to ‘‘see’’ as deep into the atmosphere as the HATPRO, the AERI has a much sharper vision of boundary layer features in the lowest 3 km than does the HATPRO.
7. Conclusions In this study, optimal-estimation-based thermodynamic retrievals were performed on a collocated ground-based
AERI (an infrared spectrometer) and HATPRO (multichannel microwave radiometer) using data from a 4-month period from September to December of 2007 in the Black Forest in southwestern Germany. This study highlighted the challenge of using optimal-estimation retrievals on real AERI and HATPRO data. Within this study, we show for the first time a side-by-side comparison of retrievals from real AERI and MWR observations in which both retrievals use the same optimal-estimation framework. This study confirmed the results of L09 in that the AERI clear-sky temperature retrievals are superior to those of the HATPRO, which is due to the fact that the AERI has more independent pieces of information about the temperature profile. This paper extends this result to the below-cloud-base profile. Our water vapor results were different than those from L09, however; in particular, the total DFS values from the AERI were smaller when real observations were used. This result was because the AERI retrievals did not use the second water vapor band (1250–1350 cm21) in the retrieval to eliminate systematic errors that arise when that band is included and that are induced by neglecting the contributions of radiative scattering in cloudy situations. Nonetheless, the AERI-retrieved water vapor profiles were still more accurate than the HATPRO-retrieved profiles in the lowest 1 km for the clear-sky cases. In the cloudysky cases, the AERI displayed a greater accuracy than did the HATPRO; our study only considered the profile below the cloud base, however. These accuracy results from our AERIoe retrievals overall were similar to those shown in Turner and Löhnert (2014). In addition, this study also discovered that the AERI is able to capture temperature structures, such as inversions, better than the HATPRO because of its higher vertical resolution.
2318
JOURNAL OF APPLIED METEOROLOGY AND CLIMATOLOGY
Although these results show that the AERI is superior in information content and accuracy, it does not mean that the MWR has no value in a national network of thermodynamic sounders: the MWR can provide valuable information about the profile above the cloud base that the AERI cannot (Löhnert et al. 2007). Therefore, we anticipate that multi-instrument retrievals will be needed to blend the individual advantages of different upper-air remote sensing instruments (i.e., MWRs in the midtroposphere and above-cloud profile, AERIs in clear-sky and below cloud, and satellites for the mid- to upper troposphere) to improve the overall estimation of the thermodynamic profile of the entire troposphere (Ho et al. 2002; Ebell et al. 2013). Because of this need, future retrieval algorithms will merge these different datasets together. Two significant challenges existed in this study. The first was the ability to obtain the AERI’s full profiling capabilities since our retrievals did not include the second water vapor band. This fact highlights the need to expand the AERI channels used to maximize retrieval information content. Therefore, future work will investigate the use of a more optimal selection of spectral channels to use in the AERIoe retrieval (i.e., as in Merrelli and Turner 2012) to maximize the accuracy and information content in the retrieved profiles, instead of using traditional absorption bands (e.g., 538–588 cm21). The second challenge was the radiometric and spectral calibration of each instrument. The AERI has a radiometric calibration of better than 1% of the ambient radiance, and its spectral calibration is easily determined (Knuteson et al. 2004b). The HATPRO, on the other hand, required an additional step to correct for both the instrument calibration and instrument characteristics that the AERI did not require. Although we were able to characterize the HATPRO instrument biases because the radiometer was collocated with a radiosonde system, this may not be the case for other deployments. Acknowledgments. This work was supported by NOAA’s National Severe Storms Laboratory, the Department of Energy Atmospheric System Research (ASR) Grant DE-SC0006898, and the German Research Foundation (DFG) within the priority program SPP 1167 Quantitative Precipitation Forecast under Grants WU 356/4-2. The data used in this paper were collected as part of the ARM Climate Research Facility and are available from the ARM data archive (http://www.archive.arm. gov). The authors thank the ARM staff, for setting up the Black Forest Mobile Facility, and scientists and students at the University of Cologne, who operated the HATPRO. We also thank the three anonymous reviewers whose comments helped to improve the clarity of this paper.
VOLUME 54
REFERENCES ARM Climate Research Facility, 1994a: Atmospheric Emitted Radiance Interferometer (AERICH1) (updated daily). Atmospheric Radiation Measurement (ARM) Climate Research Facility Data Archive, J. Gero et al., Eds. Subset used: 1 Apr 2007–31 Dec 2007 at 48.54018N, 8.39688E for ARM Mobile Facility (FKB) Black Forest, Germany (M1), accessed 5 Mar 2014, doi:10.5439/1025143. ——, 1994b: Balloon-borne sounding system (SONDEWNPN) (updated hourly). Atmospheric Radiation Measurement (ARM) Climate Research Facility Data Archive, D. Holdridge, J. Kyrouac, and R. Coulter, Eds. Subset used: 2 Apr 2007–31 Dec 2007 at 48.54018N, 8.39688E for ARM Mobile Facility (FKB) Black Forest, Germany (M1), accessed 4 Mar 2014, doi:10.5439/1021460. Cimini, D., E. R. Westwater, and A. J. Gasiewski, 2010: Temperature and humidity profiling in the Arctic using groundbased millimeter-wave radiometry and 1DVAR. IEEE Trans. Geosci. Remote Sens., 48, 1381–1388, doi:10.1109/ TGRS.2009.2030500. Clough, S. A., M. J. Iacono, and J.-L. Moncet, 1992: Line-by-line calculations of atmospheric fluxes and cooling rates: Application to water vapor. J. Geophys. Res., 97, 15 761–15 785, doi:10.1029/92JD01419. ——, M. W. Shephard, E. J. Mlawer, J. S. Delamere, M. J. Iacono, K. Cady-Pereira, S. Boukabara, and P. D. Brown, 2005: Atmospheric radiative transfer modeling: A summary of the AER codes. J. Quant. Spectrosc. Radiat. Transfer, 91, 233–244, doi:10.1016/j.jqsrt.2004.05.058. Crewell, S., and U. Löhnert, 2007: Accuracy of boundary layer temperature profiles retrieved with multi-frequency, multiangle microwave radiometry. IEEE Trans. Geosci. Remote Sens., 45, 2195–2201, doi:10.1109/TGRS.2006.888434. Ebell, K., E. Orlandi, A. Hünerbein, U. Löhnert, and S. Crewell, 2013: Combining ground-based with satellite-based measurements in the atmospheric state retrieval: Assessment of the information content. J. Geophys. Res. Atmos., 118, 6940–6956, doi:10.1002/jgrd.50548. Feltz, W. F., and J. R. Mecikalski, 2002: Monitoring high-temporalresolution convective stability indices using the ground-based Atmospheric Emitted Radiance Interferometer (AERI) during the 3 May 1999 Oklahoma–Kansas tornado outbreak. Wea. Forecasting, 17, 445–455, doi:10.1175/1520-0434(2002)017,0445: MHTRCS.2.0.CO;2. ——, W. L. Smith, R. O. Knuteson, H. E. Revercomb, H. M. Woolf, and H. B. Howell, 1998: Meteorological applications of temperature and water vapor retrievals from the ground-based Atmospheric Emitted Radiance Interferometer (AERI). J. Appl. Meteor., 37, 857–875, doi:10.1175/1520-0450(1998)037,0857: MAOTAW.2.0.CO;2. ——, ——, H. B. Howell, R. O. Knuteson, H. Woolf, and H. E. Revercomb, 2003: Near-continuous profiling of temperature, moisture, and atmospheric stability using the Atmospheric Emitted Radiance Interferometer (AERI). J. Appl. Meteor., 42, 584–597, doi:10.1175/1520-0450(2003)042,0584: NPOTMA.2.0.CO;2. Han, Y., and E. R. Westwater, 2000: Analysis and improvement of tipping calibration for ground-based microwave radiometers. IEEE Trans. Geosci. Remote Sens., 38, 1260–1276, doi:10.1109/36.843018. Hewison, T. J., 2007: 1D-VAR retrieval of temperature and humidity profiles from a ground-based microwave radiometer.
NOVEMBER 2015
BLUMBERG ET AL.
IEEE Trans. Geosci. Remote Sens., 45, 2163–2168, doi:10.1109/ TGRS.2007.898091. Ho, S., W. Smith, and H. Huang, 2002: Retrieval of atmospherictemperature and water-vapor profiles by use of combined satellite and ground-based infrared spectral-radiance measurements. Appl. Opt., 41, 4057–4069, doi:10.1364/AO.41.004057. Hoff, R. M., and R. M. Hardesty, 2012: Thermodynamic profiling technologies workshop report to the National Science Foundation and the National Weather Service. NCAR Tech. Note NCAR/TN-4881STR, 80 pp. [Available online at http://nldr. library.ucar.edu/repository/collections/TECH-NOTE-000-000-000853.] Knuteson, R. O., and Coauthors, 2004a: Atmospheric Emitted Radiance Interferometer. Part I: Instrument design. J. Atmos. Oceanic Technol., 21, 1763–1776, doi:10.1175/JTECH-1662.1. ——, and Coauthors, 2004b: Atmospheric Emitted Radiance Interferometer. Part II: Instrument performance. J. Atmos. Oceanic Technol., 21, 1777–1789, doi:10.1175/JTECH-1663.1. Liljegren, J. C., E. E. Clothiaux, G. G. Mace, S. Kato, and X. Dong, 2001: A new retrieval for cloud liquid water path using groundbased microwave radiometer and measurements of cloud temperature. J. Geophys. Res., 106, 14 485–14 500, doi:10.1029/ 2000JD900817. ——, S. A. Boukabara, K. Cady-Pereira, and S. A. Clough, 2005: The effect of the half-width of the 22 GHz water vapor line on retrievals of temperature and water vapor profiles with a twelvechannel microwave profiler. IEEE Trans. Geosci. Remote Sens., 43, 1102–1108, doi:10.1109/TGRS.2004.839593. Löhnert, U., and O. Maier, 2012: Operational profiling of temperature using ground-based microwave radiometry at Payerne: Prospects and challenges. Atmos. Meas. Tech., 5, 1121–1134, doi:10.5194/amt-5-1121-2012. ——, E. van Meijgaard, H. K. Baltink, S. Groß, and R. Boers, 2007: Accuracy assessment of an integrated profiling technique for operationally deriving profiles of temperature, humidity, and cloud liquid water. J. Geophys. Res., 112, D04205, doi:10.1029/ 2006JD007379. ——, D. D. Turner, and S. Crewell, 2009: Ground-based temperature and humidity profiling using spectral infrared and microwave observations. Part I: Simulated retrieval performance in clear-sky conditions. J. Appl. Meteor. Climatol., 48, 1017–1032, doi:10.1175/2008JAMC2060.1. Maschwitz, G., U. Löhnert, S. Crewell, T. Rose, and D. D. Turner, 2013: Investigation of ground-based microwave radiometer calibration techniques at 530 hPa. Atmos. Meas. Tech., 6, 2641–2658, doi:10.5194/amt-6-2641-2013. Masiello, G., C. Serio, and P. Antonelli, 2012: Inversion for atmospheric thermodynamic parameters of IASA data in the principal components space. Quart. J. Roy. Meteor. Soc., 138, 103–117, doi:10.1002/qj.909. Mather, J. M., and J. W. Voyles, 2013: The ARM Climate Research Facility: A review of structure and capabilities. Bull. Amer. Meteor. Soc., 94, 377–392, doi:10.1175/BAMS-D-11-00218.1. Merrelli, A., and D. D. Turner, 2012: Comparing information content of upwelling far-infrared and midinfrared radiance spectra for clear atmosphere profiling. J. Atmos. Oceanic Technol., 29, 510–526, doi:10.1175/JTECH-D-11-00113.1.
2319
Miller, M. A., and A. Slingo, 2007: The ARM Mobile Facility and its first international deployment: Measuring radiative flux divergence in West Africa. Bull. Amer. Meteor. Soc., 88, 1229– 1244, doi:10.1175/BAMS-88-8-1229. NRC, 2009: Observing Weather and Climate from the Ground Up: A Nationwide Network of Networks. National Academies Press, 234 pp. ——, 2010: When Weather Matters: Science and Service to Meet Critical Societal Needs. National Academies Press, 182 pp. Rodgers, C. D., 2000: Inverse Methods for Atmospheric Sounding: Theory and Practice. World Scientific, 238 pp. Rose, T., S. Crewell, U. Löhnert, and C. Simmer, 2005: A network suitable microwave radiometer for operational monitoring of the cloudy atmosphere. Atmos. Res., 75, 183–200, doi:10.1016/ j.atmosres.2004.12.005. Smith, W. L., W. F. Feltz, R. O. Knuteson, H. E. Revercomb, H. M. Woolf, and H. B. Howell, 1999: The retrieval of planetary boundary layer structure using ground-based infrared spectral radiance measurements. J. Atmos. Oceanic Technol., 16, 323–333, doi:10.1175/1520-0426(1999)016,0323: TROPBL.2.0.CO;2. Taylor, K. E., 2001: Summarizing multiple aspects of model performance in a single diagram. J. Geophys. Res., 106, 7183– 7192, doi:10.1029/2000JD900719. Turner, D. D., 2007: Improved ground-based liquid water path retrievals using a combined infrared and microwave approach. J. Geophys. Res., 112, D15204, doi:10.1029/2007JD008530. ——, and R. E. Holz, 2005: Retrieving cloud fraction in the field-ofview of a high-spectral-resolution infrared radiometer. IEEE Geosci. Remote Sens. Lett., 2, 287–291, doi:10.1109/ LGRS.2005.850533. ——, and U. Löhnert, 2014: Information content and uncertainties in thermodynamic profiles and liquid cloud properties retrieved from the ground-based Atmospheric Emitted Radiance Interferometer (AERI). J. Appl. Meteor. Climatol., 53, 752–771, doi:10.1175/JAMC-D-13-0126.1. ——, B. M. Lesht, S. A. Clough, J. C. Liljegren, H. E. Revercomb, and D. C. Tobin, 2003: Dry bias and variability in Vaisala radiosondes: The ARM experience. J. Atmos. Oceanic Technol., 20, 117–132, doi:10.1175/1520-0426(2003)020,0117: DBAVIV.2.0.CO;2. ——, and Coauthors, 2004: The QME AERI LBLRTM: A closure experiment for downwelling high spectral resolution infrared radiance. J. Atmos. Sci., 61, 2657–2675, doi:10.1175/JAS3300.1. ——, R. O. Knuteson, H. E. Revercomb, C. Lo, and R. G. Dedecker, 2006: Noise reduction of Atmospheric Emitted Radiance Interferometer (AERI) observations using principal component analysis. J. Atmos. Oceanic Technol., 23, 1223–1238, doi:10.1175/JTECH1906.1. Wagner, T. J., W. F. Feltz, and S. A. Ackerman, 2008: The temporal evolution of convective indices in storm-producing environments. Wea. Forecasting, 23, 786–794, doi:10.1175/ 2008WAF2007046.1. Wulfmeyer, V., and Coauthors, 2011: The Convective and Orographically-induced Precipitation Study (COPS): The scientific strategy, the field phase, and first highlights. Quart. J. Roy. Meteor. Soc., 137, 3–30, doi:10.1002/qj.752.