, Vol. 6, No. 1, pp 37+44 c Iranian Aerospace Society, Winter 2009
JAST
Research Note
Gyroscope Random Drift Modeling, Using Neural Networks, Fuzzy Neural and Traditional Time-Series Methods A. A. Nikkhah1, P. Heydari2 , H. Khaloozadeh3, A.P. Heydari4 In this paper statistical and time series models are used for determining the random drift of a dynamically Tuned Gyroscope 5DTG7. This drift is compensated with optimal predictive transfer function. Also nonlinear neural-network and fuzzy-neural models are investigated for prediction and compensation of the random drift. Finally the di@erent models are compared together and their advantages are discussed.
INTRODUCTION
Dynamically Tuned Gyroscope 1DTG2 is a kind of Two-Degree-of-Freedom mechanical gyroscopes in which a dynamically tuned ;exure and gimbal mechanism both support the rotor and provide angular freedom about axes perpendicular to the spin axis. In this type of gyroscope, spinning rotor is related to gimbals by means of elastic torsion bars and rotor assay is spinning in a special speed, which is called tune speed. In this special speed, because of the adjustment of the gimbal inertia, ;exure spring rate, or the spin rate of a rotor suspension system, the dynamically induced 1negative2 spring rate cancels the spring rate of the ;exure suspensionC and makes the gyro free for small angles of rotation. In Inertial Navigation Systems 1INS2 based on Stable Platforms, DTG works as free gyro or Integrating gyro 1open loop2, and in Strapped down Inertial Navigation Systems 1SINS2, DTG works as Rate Gyro 1with a closed- loop control of gyro2. Usually DTGs are made with one or two gimbalsC however, theoretically it may have three or more gimbals I18L. The dynamically tuned gyroscope 1DTG2 is 1. 2. 3. 4.
Assistant Professor, Dept. of Aerospace Eng., K.N.Toosi Univ. of Tech., Tehran, Iran, Email:
[email protected]. Faculty Member, Islamic Azad Univ., Roudehen Branch, Tehran, Iran. Associate Professor, Dept. of Electrical Eng., K.N.Toosi Univ. of Tech., Tehran, Iran. M.Sc. Student, Dept. of Electrical Eng., Amirkabir Univ. of Tech., Tehran, Iran.
widely employed for its high reliability, low cost and long life. However, due to the in;uence of the DTG's making techniques and inherent structural character, drift is an intrinsic property of the DTG, and drift error is one of the main factors which aPect the precision of the DTG or even the inertial system I11L. In order to reduce the drift error, some drift models, including mathematical models and physical models, are initiated to Qnd the law of the drift error and then compensate for it. Mathematical modeling of gyroscope random drifts has been started with prototype production of the gyroscope simultaneously, and it is still continued. References I1-10L are several examples in this category. Models with Kalman Qlter and state space realization are presented in I1L, I4L. Also some models have been introduced for non stationary random processes in I2L and the Reference I10L only shows statistical modeling studies. In recent years in addition to linear traditional methods, nonlinear methods are also being used, especially neural network method, which is a powerful nonlinear tool, I6L, I7L. In reference I6L, a gray Qrst order model with wavelet processing is used for random drift modeling. Fan I5L addressed a grey modeling method based on the grey theory which was employed in the gyro drift model. However, it was only roughly done without any precision. Some of the above-mentioned models have advantages based on the type of the random drifts. For example, random drift with the long period, which is studied more has diPerent behaviors in comparison with the short period random drift. In long periods
38
A. A. Nikkhah, P. Heydari , H. Khaloozadeh, A.P. Heydari
of time, gyro random deviation is non-stationary, and the models presented for them are no more valid and accurate for short period deviations of gyro. As a result, every produced gyroscope based on its design, and assembly process, has a di@erent random drift, and needs its special studies. In this paper, statistical and time series models as well as nonlinear neural-network and fuzzy neural models are used for determining the random drift of a Dynamically Tuned Gyroscope FDTGGH and based on the models mentioned above, the short period random drift is compensated for with an optimal predictive transfer function. The rest of the paper is organized as follows. The Irst section brieJy describes the time series statistical modeling on DTG random drift time series. The second section discusses linear time series models AR FAuto RegressiveG, MA FMoving AverageG and ARMA FAuto Regressive Moving AverageG, for DTG random drift modeling. The random drifts are compensated for using an optimal predictive transfer function. In the last two sections, nonlinear neural network and Fuzzy neural methods are used to predict and compensate for gyro random drifts. STATISTICAL AND TIME SERIES MODELING
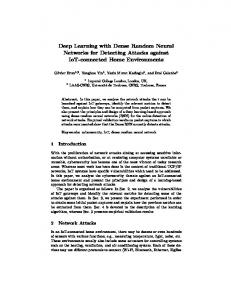
Statistical modeling of the random process is as an essential step in the modeling and description of random signals. The random process which occurs in the gyroscopes is called Random Drift. Exact deInition and methods of random drift testing is found in Q11S. BrieJy, random drift is the variance of mean drift in di@erent periods of time in the absence of any input signal. In Figure 1, the raw data of the measured output of random drift for a DTG is shown. A characterization of the noise and other processes in a time series of data as a function of averaging time is Allan variance. It is one half the mean value of
Figure 1. Raw data of tests of the DTG.
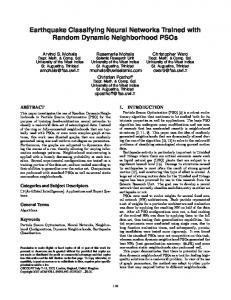
Figure 2. Variance of the random drift in di4erent periods of time.
the square of the di@erences of adjacent time averages from a time series as a function of averaging time. Figure 2 shows the Allan variance of the DTG random drift. Flat curve at the end of the graph shows that the random process is stationary at the interested period of time. Probability distribution density Function
The First and the most important characteristic of every random process is its probability distribution density function. Probability distribution density function transfers the space of input data to smaller subspaces. For example numbers between zero and twenty can be subdivided into ten equal sections, of which every one contains 2 numbers, and then using the simple relation of: P Fni G =
ni n
F1G
the occurrence probability of each section can be presented as a number between zero and one. In Relation F1G, n is number of data in each section, and n is the number of total data. Consequently, the area under the probability distribution density function will be equal 1. The simplest way to obtain probability distribution density function is to use traditional histograms in statistical methods. In addition to deriving histograms, there are other more accurate methods where by Itting an analytic curve into the primary histogram, one can obtain more smooth results for probability function distribution density. The probability distribution density function of the raw data of Figure 1, by using the advanced methods in Matlab software, is obtained and shown in Figure 3. We can get important results from the shape of the probability distribution density functionH for instance linear systems with Gaussian random input generate Gaussian output. According to Figure 3, unfortunately the random drift of the DTG does i
Nonlinear Models for Random Drift of Gyroscope not have a Gaussian probability distribution density function. For better analysis, the periodogram of the output data is presented in the next section.
Autocorrelation Function
In random process analysis, autocorrelation function is a good criterion of randomness and data disordering of the process. For instance, in the case of white noise, which is A100 random process and is not practically predictable, autocorrelation function is equal to zero across its entire domain, except in the zero point, which has a value equal to the power noise. Autocorrelation function also is a superior criterion of predictability of a system G16I, which shows the possibility of prediction and the proximity of the color noise to the white noise. The autocorrelation function estimation for a discrete system is determined as: 1 N ;! xMt + ! NxMtN M2N r^M! N = N
X t=1
where N is number of data, xMtN is data at time t. Most often the normalized autocorrelation function is
39 used as: r^M! N M3N xr = r^M0N Normalized Autocorrelation function for raw data of Figure 3 is sketched in Figure 4.
Power Spectral Density Function
To investigate frequency spectral in a random signal, power spectral density function is the best tool. Power spectral density function determines what would the frequency content of the signal be. For instance, if there is a systematic noise source in a speciUc frequency, one can omit it by using a Ulter or Unding and eliminating the noise source. For discrete data power, spectral density function can be obtained as: VxxM!N = 21& 'r^M! Ne;i!! M4N where r^M! N is the autocorrelation function. In this work we use the following suitable form of power spectral density function estimation, which is called Periodogram: V^ xx M!N 2 P^xx = M5N ! j
j
s
Figure 3. Probability distribution density function of raw
data.
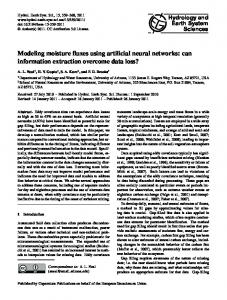
The !s is the sample frequency. Figure 5 shows the periodogram of raw data of random outputs of the DTG. Because of using a wind-up anti aliasing Ulter, for data acquisition, there is no frequency more then 50 Hz. In fact, the high frequency noises are omitted by bandwidth of system and low pass Ulter. The other problem is in the frequency near 32 Hz. In this frequency, occurs an unusual jump occurs in the amplitude of the power spectral density function. The main reason for existence of this output signal is the magnetic e\ect of motor current which has a frequency component at 167 Hz. This frequency jump occurs because of the data sampling frequency Mfs N of system, and is equal to 100 Hz. Based on the theory of data acquisition, frequencies greater than 50 Hz are aliased in lower frequencies, and alias frequency can be obtained by the following relation G17I: = n fs f M6N From the Relation M6N we can Und that the frequency 167 is aliased in frequency 33 Hz. In order to reduce the noise with a frequency of 30 Hz, and simultaneously maintain the bandwidth of the system, we can use a notch Ulter. Notch Ulter is a kind of Ulter which can omit a very narrow band of frequency. In order to eliminate this noise, an appropriate notch Ulter near 33 Hz has been employed.
fa
Figure 4. Normal autocorrelation function of raw data.
j
!
;
j
40
A. A. Nikkhah, P. Heydari , H. Khaloozadeh, A.P. Heydari
The periodogram of 9ltered data is shown in Figure 5. Figure 6 shows the power spectral density function of data, which passes through the notch 9lter. Also Figure 7 brieEy shows that the probability distribution density function of the DTG random drift is very close to the Gaussian form. Hence we conclude that the DTG random drift is aIected by a linear systemJ thus, linear models can describe it very well. One important demerit in using notch 9lter is omission of all the data in the frequency of 33 Hz, and the weakening of signals near this same frequency. In this case, by suitable insulation of input and output wiring, or use of suitable data acquisition rate higher than system bandwidth and omission of resultant noise in the frequency greater than the bandwidth, we can reduce the eIects of this noise on output. Also one can conclude that this noise has nonrandom sourcesJ thus, by using linear modeling and identi9cation methods without using a notch 9lter, the drift can be reduced.
Figure 5. Periodogram of raw data.
Figure 7. Probability distribution density function of -ltered data.
LINEAR MODELS
In this section, we present AR PAutoregressiveQ and ARMA PAutoregressive Moving AverageQ models to describe time series by means of the output error method. Time series models have been obtained for raw data of DTG random drift PFigure 1Q. Table 1 shows the values of widely used AIC PAkaike Information CriteriaQ for various AR model orders from 1 to 9. The utilized form of AIC is the following: AIC = N log VN P%N Q + 2p P7Q where N is the number of data, and VN P%N Q is root mean square error of predictive model. In spite of the good results for reduction of variance, AR models still have some problems. In Figure 8, the coe\cient of 25 lags for model AR P25Q has been shown. This 9gure shows that by increasing the lags PdelaysQ, the amplitude of the autocorrelation coe\cients doesn't decrease. This diagram, which is called partial autocorrelation function ^14_, is an important representative feature of the time series. In the AR model, it is assumed that there is a white noise in the system. If this assumption is not valid, then AR model can not describe the system exactly. According to Figure 8, since the AR models autocorrelation coe\cients are not reduced by increasing the lags, these models are poor for modeling the DTG random drift time series. To address this problem, the ARMA has been used to model noise signal as a colored noise. Table 2 shows variance of the DTG random drift. According to this data, the best selection for term MA in the ARMA model depends on the selected AR model. For example, in a model with AR P4Q, obtain the best MA Table 1. Di6erent autoregressive models and AIC criterion
Figure 6. Periodogram of -ltered data.
for them. AR 1 2 3 4 5 6 7 8 9 AIC 5.71 5.62 2.63 1.58 1.52 1.44 1.04 0.99 0.98
Nonlinear Models for Random Drift of Gyroscope term selection as MA729. Also when noise is a second order Markov process, with AR 759, the best MA term selection is MA 759. Resultant transfer function for model ARMA 74, 29 is obtained as below: 4 z 3 + 0:926z 2 7z 9 = z 4 ; 0:353zz 3++00::8534 03929z 2 ; 0:9666z + 0:384 789 According to the obtained model, an optimal predictable transfer function for prediction and reduction of the random drift of the DTG is proposed. However, existence of some small nonlinear factors, which can be found in all systems, leads us to the use of nonlinear models. Also, the result of compensation of output random drift of the gyroscope by one of the introduced methods 7ARMA 74, 299 is shown in Figure 9. As it can be seen in Figure 9, the DTG's random drift is reduced to 1R10 of its primary 7raw9 value.
NEURAL NETWORK MODEL
The purpose of this section is to give an artiScial neural network 7ANN9 for nonlinear modeling of DTG random drift. An artiScial neural network 7ANN9 is a mathematical model consisting of a number of highly interconnected processing elements organized into layers, geometry and functionality, which have been likened to that of the human brain. The network has one input
41
Figure 9. Random drift of the gyro after prediction and processing of raw data.
layer, one hidden layer and one output layer. Among the various kinds of ANN approaches that exist, the Multi Layer Perceptron 7MLP9 architecture with back propagation learning algorithm has been chosen in this study. It has been proven that MLP neural network with only one hidden layer of neurons and a speciSc type of activation function 7e.g. sigmoid function or hyperbolic tangent9 can approximate any functional relation arbitrarily well, provided that enough hidden neurons are available X12Y.A schematic description of the MLP is given in Figure 2. The tapped delay line 7TDL9 has been utilized for making the input layer with signal at the current time and the three previous input signals. In our neural network simulation, we have used a neural network with a hidden layer containing 20 neurons. Additionally, the nodes of the input layer just propagate input values to the nodes of the Srst hidden layer. The input[output relationship between each node of the hidden layers is given by: 4 W 17j' 19x7t ; j 9 + B 17j 9 799 Y =$ j =1 where x7t ; j 9 is the output from the jth node of the Input layer, W 17j' 19 the weight of the connection between the jth node and the current node, and B 1 is
0X @
1 A
Figure 8. Partial autocorrelation function of data. Table 2. Values of AIC criterion for di3erent types of ARMA models.
MA 1 2 3 4 5
1 5.5053 4.8434 2.1855 1.7828 1.7693
2
3
4
5
3.9065 1.1226 0.9963 0.9237 1.7036 1.6720 1.7149 1.6898 1.6937 0.7981
Figure 10. Schematic description of the MLP.
42
A. A. Nikkhah, P. Heydari , H. Khaloozadeh, A.P. Heydari is so close to white noise. The probability density function of ANN modeling in comparison with the raw data is given in Figure 12.
Figure 11. Autocorrelation function result after training process of proposed ANN.
FUZZY NEURAL MODEL In this section a class of fuzzy neural model referred to as ANFIS is introduced. The acronym ANFIS derives its name from adaptive neuro-fuzzy inference system. Figure 13 illustrates that the reason mechanism for the two if-then rules linear Sugeno fuzzy model under consideration has two inputs of x and y, and one output of z . The corresponding equivalent ANFIS architecture is as shown in Figure 13b, where each layer is described below. Layer1: In this layer A and B are fuzzy sets and outputs are the membership function values of the premise part. Here, the membership function for A and B are characterized by the generalized bell function: 1 ?11A ,?xA = i
i
i
i
!
1+
;ci
x
"2 #
bi
ai
where fa . b . c g is the parameter set. Q Layer2: In this layer, every node labeled used ?xA as fuzzy AND. Outputs the layer are: i
the bias of the current node. is a function that can be nonlinear, e:g: hyperbolic tangent Eq. ?9A: z A ; exp?;z A ?10A ?z A = exp? exp?z A + exp?;z A We have used % as a linear transfer function. W 2?j A are the weight of the connection between the jth node and the output node, and the B 2 is the bias of output nod. During the training process, the weights and biases in the network are adjusted to minimize the error in obtaining high performance in the solution. At the end and during the training error, mean squared error is computed between predicted outputs and targeted outputs. There are various training algorithms used in neural network applications. In this study, the used training algorithms were LevenbergQMarquardt ?LMA methods. Figure 11 shows the autocorrelation function result after the training process of proposed ANN for comparison with Figure 4. The results show the autocorrelation function of the proposed ANN model
i
= , ?xA # , ?yA ?12A Layer3: Output of this layer is called normalized Xring strength: Wi
Figure 12. Probability density function of ANN modeling in comparison with the raw data.
i
Yi W
Ai
Bi
= W W+ W
?13A
i
1
2
Layer4: In this layer, every node function is: Y f = WY ?p x + q y + r A W ?14A i i
i
i
i
i
where fp . q . r g is parameter set. The parameter in this layer will be referred to as consequent parameter. Layer5: the single node in this layer computes the overall output as summation of all incoming signals: i
XY
Wi fi
=
i
i
P Wf PW
i i
i
i
i
?15A
In the fuzzy model for prediction of x?t + 1A, four inputs from time t to t ; 3 are used like in the neural network model. Each input has two Gaussian transfer functions\ therefore, the total number of rules is 16. The learning of ANFIS models is performed by method of error back propagation. In Figure 14, periodogram of raw data ?up curveA and processed data ?down curveA on an ANFIS model is shown.
Nonlinear Models for Random Drift of Gyroscope
CONCLUSION
Physically un-modeled drifts of dynamically tuned gyroscopes, which are errors with random sources =disturbances and noises?, has a serious e@ect on sensor accuracy. This paper investigates the use of linear and nonlinear methods. Based on the theories of NeuralNetwork, Fuzzy logic and Time series methods, actual test data about random drift of a DTG has been processed, and the random drift is compensated for and is reduced. According to the obtained results, the DTG's random drift is reduced to 1K10 of its primary =raw? value. In Table 3, qualiOcation and ePciency of di@erent linear and non-linear models are compared. This comparison shows that, with adequate qualiOcation and simplicity in realization, the time series are the best solution for DTG random drift analysis and compensation.
=a?
=b?
Figure 13. Two if-then rules linear Sugeno fuzzy model with two inputs x and y, and one output z.
Figure 14. Periodogram of raw data 9up curve< and =ltered data 9down curve