©2009 Poultry Science Association, Inc.
Poultry growth modeling using neural networks and simulated data H. A. Ahmad1 Department of Biology, Jackson State University, Jackson, MS 39217 Primary Audience: Nutritionists, Geneticists, Poultry Producers SUMMARY Poultry growth is usually modeled with the Gompertz model or another nonlinear statistical model using average BW data over certain periods of time for a given strain of birds under specific farm management conditions. Constant selection in the genetic pool, nutritional factors, and environmental concerns, however, make such models limited in their utility because of the difficulty of fitting the growth curve across time, bird strains, and other determining variables. Moreover, generating data for every strain of birds under continually changing variables is difficult, expensive, and time consuming. The current model addresses 2 objectives: to simulate data using published literature for different growth periods, and to develop artificial intelligence models with various neural network architectures. By breaking down the actual broiler growth data into 5-d intervals, with known means and SD, normal distributions were generated for broiler growth using @Risk software. These simulated data were then used to recognize data patterns and model growth curves by using various neural networks. Three neural networks, namely, BackPropagation-3 (3 layers of back propagation, with each layer connected to the previous layer), BackPropagation-5 (5 layers of back propagation, with each layer connected to the previous layer), and Ward-5 (5 hidden slabs with various activation functions, using NeuroShell 2 Ward software) were used in this research. Once the networks were sufficiently trained, they were exposed to actual growth data to predict broiler growth over the next 50 d. The BackPropagation-3 neural network gave the best fitting line, with predictions fitting tightly to the actual data points. The R2 was 0.998, and nearly perfect. The R2 for the BackPropagation-5 and Ward-5 neural networks were 0.967 and 0.973, respectively. To test the approach further, the same methodology was applied in guinea fowl growth prediction, resulting in R2 of 0.96 both for the general regression and Ward-5 neural networks. Key words: growth modeling, simulation, neural network 2009 J. Appl. Poult. Res. 18:440–446 doi:10.3382/japr.2008-00064
DESCRIPTION OF PROBLEM The poultry growth curve in general, and commercial broiler growth in particular, is a nonlinear phenomenon often modeled by using the Gompertz or Laird model [1–3]. Parameters 1
Corresponding author:
[email protected]
for such models are determined by using empirical observations on BW gains of birds over several weeks. Such models, which are mathematically appropriate for the type of data at hand, are difficult to use in practice in terms of generating empirical data every time the param-
Ahmad: MODELING USING NEURAL NETWORKS eters of the model change, and thus offer fragmented answers under given sets of variables, both physiological and environmental. Poultry growth modeling using the above-mentioned approach is usually done under specific sets of biological and environmental constraints. Those constraints may include, but are not limited to, genetic variations, feeding regimen, climate control, and other farm management conditions. Thus, several variables need to be controlled before the BW can reasonably be determined. Once any of those variables changes, which is often the case, the response changes too. Thus, ideally one constantly has to perform empirical experiments to obtain new information. Such an approach is time and cost prohibitive. One alternative approach, as proposed in this paper, is to simulate body growth data from the published or unpublished literature by using sensical bounds (biological limits). Simulation on a variety of poultry growth data can be done using the Monte Carlo technique or other simulation methodologies [4]. However, the data on which the simulation is being performed must represent actual data (population in question) and should fall within biological limits, sometimes referred to as sensical bounds. Several published or unpublished data sets can be simulated by manipulating their respective means and SD after carefully examining the model parameter that needs to be adjusted. For example, if a heavy strain of bird needed to be simulated over lighter strain data, the means and SD should be adjusted upward after analyzing the strain to be studied. Such manipulation can be achieved by using management guides and expert opinions. Simulated data thus generated on BW may be used to train neural network models [5]. Neural Network Model A neural network is a computer program (series of instructions) that behaves somewhat like a biological brain. Millions of neurons in the biological brain work together in parallel, each trying to solve a tiny bit of a complex problem. Judging from the ability of humans, this type of problem solving (divide and conquer) seems very efficient with fuzzy data, when making decisions based on past experiences, and when
441
associating acquired knowledge and applying it to new situations. A brief introduction to neural networks can be found in a previously published paper [6]. A detailed description of neural networks is also available [5]. Neural network models, such as the BackPropagation-3 (BP-3; 3 layers of back propagation, with each layer connected to the previous layer), BackPropagation-5 (BP-5; 5 layers of back propagation, with each layer connected to the previous layer), general regression (GR), and Ward-5 (5 hidden slabs with various activation functions, , using NeuroShell 2 Ward software) models, recognize pattern classification in the data using their built-in computational architecture. More details on the architecture of such models can be found elsewhere [5–7]. Once the data bounds and their sensical limits are recognized, the data can be manipulated to answer various “what if” scenarios without the need to conduct several experiments for each scenario. One of the main advantages of neural network modeling, as compared with classical statistical modeling, is that modeling can be done on the single dependent variable alone by mapping variations in that variable, instead of using traditional independent variables to predict the dependent variable. This approach saves time, resources, uncertainty, and variability in generating data under various conditions. The current project used 2 independent methodologies to forecast broiler growth efficiently: data simulation and neural network models. Data simulation, using the sensical data bounds of broiler and guinea fowl growth, generated new representative data without actual empirical trials, whereas the neural network models used such data to train themselves. The trained network models then predicted future growth based on data to which they had not previously been exposed by using their training of data patterns and classification, thus mimicking the human brain.
MATERIALS AND METHODS The 2 simulated experiments were conducted using published broiler and guinea fowl data, respectively. Details of each experiment are given below.
JAPR: Research Report
442 Broiler Growth: Data Collection and Simulation Average daily BW of 25 individual male broiler chicks (Ross × Ross 308) from 1 to 70 d were selected from a recently published report by Roush et al. [8]. Assuming a normal distribution of those observations, the average BW were converted into 14 interval classes of 5 d each, with means and SD. These 5-d-interval classes of broiler growth reflect accurate growth patterns and curves in broilers. The 14 means and SD were used to simulate broiler growth data from 1 to 70 d by using the normal distribution of @Risk software [9]. Six simulations were performed, each with 1,000 iterations. On each 14 interval classes of 5 d, 100 data points were randomly drawn, for a total of 1,400 observations, representing 20 observations for each day up to 70 d. Only 50-d (7-wk) data were used for this research and were arranged in 1 row of a spreadsheet to determine examples for neural network training. Starting from d 1, the first 4 BW observations were used as inputs, whereas d-5 BW observations were used as the output, to constitute 1 training example, referred to as an epoch in the neural network literature, which can be compared with replicates in biological experiments.
The second training example consisted of the second, third, fourth, and fifth observations of d 1 BW as inputs, whereas the sixth observation of d 1 was used as the output. This process was iterated for 15 training examples, for each day of broiler BW growth from 1 to 50 d, generating a total of 750 examples. Various neural network models, such as the BP-3, BP-5, and Ward-5, were trained by using Neuro Shell 2 software [7] on these training epochs until no further improvements were noticed in such models. At that point, the training was stopped. The neural networks thus trained to predict the future broiler growth curve were tested using the actual data set of Roush et al. [8]; weekly examples, which were similar to the above-mentioned training examples, are given in Table 1. Guinea Fowl: Data Collection and Simulation Average weekly BW of 125 male 1-d-old, random-bred guinea keets of the French variety, were selected from a recently published report by Nahashon et al. [10]. By using weekly BW means and SD, 10 normal distributions were generated with @Risk software [9]. Those 10 normal distributions were subsequently simulated, each with 1,000 iterations. From these simulated data, 25 observations were randomly
Table 1. Test examples for neural networks using broiler data [8] and simulated guinea fowl data [10] Neural network epoch
Age, wk
Input 1, g
Input 2, g
Input 3, g
Input 4, g
Output, g
1 2 3 4 5 6 7
69 234 592 1,105 1,728 2,437 3,106
82 273 658 1,186 1,826 2,543 3,202
98 316 727 1,270 1,926 2,656 3,292
119 363 799 1,358 2,027 2,743 3,391
142 414 872 1,444 2,132 2,836 3,488
0 1 2 3 4 5 6 7 8 9
28 54 151 211 414 662 782 963 1,206 1,209
25 72 136 333 391 531 851 990 911 1,380
28 79 118 336 463 600 743 1,055 1,152 1,396
26 77 205 265 460 748 887 994 1,048 1,339
29 69 129 275 497 608 782 1,024 1,144 1,567
1
Broiler 1 2 3 4 5 6 7 Guinea fowl 1 2 3 4 5 6 7 8 9 10 1
Converted into weekly averages from the daily averages in the original data, although the neural networks for broiler growth were trained using the daily averages.
Ahmad: MODELING USING NEURAL NETWORKS
443
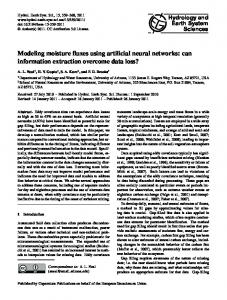
Figure 1. Broiler growth curve using the empirical data of Roush et al. [8].
collected for each 9 wk, starting from wk 0, to train various neural network models. The 250 observations were arranged in 1 row to create 200 complete training examples (epochs) and 1 testing example for each week, respectively, to train and test the neural networks. Test examples for guinea fowl are given in Table 1. Starting from wk 0, the first 4 BW observations were used as inputs, whereas d-5 BW observations were used as the output, to constitute 1 training example (epoch). The second training example consisted of the second, third, fourth, and fifth observations used as inputs, whereas
the sixth observation was the output. This process was iterated until 200 training examples and 10 testing examples were completed, for each week of guinea fowl BW growth from 0 to 9 wk. Various neural network models, such as BP-3, Ward-5, or GR, were trained on these training epochs by using Neuro Shell 2 software [7] until no further improvements were noticed in such models. At that point, the training was stopped. The neural network models thus trained to predict the future guinea fowl growth curve were tested using the test epochs not used for the training; these are given in Table 1.
Figure 2. Comparative broiler BW prediction using various neural network models. BP-3 NN = BackPropagation-3 neural network model (3 layers of back propagation, with each layer connected to the previous layer); BP-5 NN = BackPropagation-5 neural network model (5 layers of back propagation, with each layer connected to the previous layer); Ward-5 NN = Ward-5 neural network model (5 hidden slabs with various activation functions).
JAPR: Research Report
444
Figure 3. Comparative guinea fowl BW prediction using various mathematical and neural network models. BP-3 NN = BackPropagation-3 neural network model (3 layers of back propagation, with each layer connected to the previous layer); Ward-5 NN = Ward-5 neural network model (5 hidden slabs with various activation functions); GR NN = general regression neural network model.
RESULTS AND DISCUSSION Results of the neural network models for broiler and guinea fowl growth curves are given in Figures 1, 2, and 3 and in Tables 2 and 3. Figure 1 describes the actual growth curve of broilers using 70 d of empirical data from Roush et al. [8]. Figure 2 is a 50-d comparative growth prediction of broilers with the BP-3, BP-5, and Ward-5 neural network models using simulated data. Weekly results of these models are given in Table 2. The R2 (strength of the relationship) for the BP-3, BP-5 and Ward-5 models were 0.998, 0.967, and 0.973, respectively. In case of BP-3, the R2 was nearly perfect. The 2 curves (predicted and actual) overlapped each other, deviating only during wk 1 and 5, when the BP-3 network overpredicted growth (Table 2). The initial overprediction, however, tapered off after the first 10 d of growth. It is difficult to speculate about this overprediction, particularly in the first few days. It may be that the BP-3 model was stabilized after recognizing the initial test examples. Compared with the BP-5 and Ward-5 models, the BP-3 model gave the best results in terms of the overall fitted line and the strength of the relationship for broiler growth. The BP-5 and Ward-5 neural network models predicted growth with good efficiency, but not as precisely as the BP-3 model. The fitted lines in both cases ran parallel, with R2 of 0.967 and 0.973, respectively (Figure 2, Table 2). In general, both networks underpredicted growth,
except in the initial few days, when growth was overpredicted. The observed difference between the BP-3 and the BP-5 and Ward-5 neural networks may be attributed to the network architecture, test examples, and learning process within the respective network models. The comparative predictions of guinea fowl growth curves with different mathematical and neural network models are given in Figure 3 and Table 3. Results for the 2 mathematical models, the Gompertz and logistic models, are quoted from Nahashon et al. [10]. When compared with Table 2. Broiler growth prediction using various neural network models1 Age,2 wk 1 2 3 4 5 6 7 R2 r2 1
Actual BW, g
BP-3 NN
BP-5 NN
Ward-5 NN
142 414 872 1,444 2,132 2,836 3,488
225 414 814 1,406 2,150 2,913 3,477 0.998 0.998
151 301 641 1,190 1,930 2,682 3,181 0.967 0.994
83 291 706 1,247 1,886 2,633 3,238 0.973 0.9986
BP-3 NN = BackPropagation-3 neural network (3 layers of back propagation, with each layer connected to the previous layer); BP-5 NN = BackPropagation-5 neural network (5 layers of back propagation, with each layer connected to the previous layer); Ward-5 NN = Ward-5 neural network (5 hidden slabs with various activation functions). 2 Daily broiler growth predictions were converted into weekly data for simplicity.
Ahmad: MODELING USING NEURAL NETWORKS
445
Table 3. Comparison of guinea fowl growth predictions with mathematical and neural network models1 Age, wk 0 1 2 3 4 5 6 7 8 9 R2 r2
Actual BW, g
Logistic
Gompertz
BP-3 NN
Ward-5 NN
GR NN
28.90 74.80 160.10 296.20 465.70 561.40 810.90 1,017.30 1,145.60 1,312.50
61.39 103.33 170.55 273.02 417.88 602.25 807.89 1,006.10 1,171.99 1,295.21 2 NA2 NA
28.90 71.89 146.19 254.09 390.79 546.45 709.49 869.48 1,018.68 1,152.39 NA NA
−35.8 28.5 158.9 357.1 558.8 775.6 907.3 1,002.1 1,035.3 1,106.5 0.881 0.892
42.53 76.34 141.91 283.53 416.59 625.15 862.17 1,041.60 1,066.57 1,293.49 0.960 0.973
67.06 78.76 115.36 285.50 441.08 567.57 796.25 1,016.60 1,037.31 1,272.27 0.956 0.982
1
BP-3 NN = BackPropagation-3 neural network model (3 layers of back propagation, with each layer connected to the previous layer); BP-5 NN = BackPropagation-5 neural network model (5 layers of back propagation, with each layer connected to the previous layer); Ward-5 NN = Ward-5 neural network model (5 hidden slabs with various activation functions); GR NN = general regression neural network model. 2 NA = not available.
actual male BW, the Gompertz model consistently underpredicted guinea fowl growth. The logistic model initially (0 to 2 and 5 wk) overpredicted growth, but then underpredicted the latter part of growth (Table 3, Figure 3). The 3 neural network models used for guinea fowl growth were the BP-3, Ward-5, and GR. The output and detailed results of these 3 models are given in Figure 3 and Table 3. The BP-3 neural network for guinea fowl underpredicted growth during the initial 2 wk and also in wk 8 and 9. However, it overpredicted growth between wk 3 and 6, with an overall R2 value of 0.88. The first-week (wk 0) response was nonsensical, with −35.8 g, and should be treated as an outlier. It is difficult to explain the reason such an outlier occurred. The Ward-5 and GR neural networks produced similar R2 values of 0.96. In general, the Ward-5 model moderately overpredicted growth, except at wk 4, 8, and 9, when it underpredicted growth. In general, the GR neural network moderately underpredicted growth. The response discrepancy among the neural network models and between broilers and guinea fowl may be attributed to the data pattern, training and test examples, network architecture, and training process each model used. The current approach of neural network prediction using simulated data for poultry growth offers several benefits that save time and scarce resources, with better prediction efficiency. In-
stead of a fragmented approach as in empirical studies, simulated data offer a viable approach as long as data boundaries are adequately determined for the variable of interest. The neural network offers better insight into data variations. By intricately mapping variations in the variable of interest, neural network models can forecast better than their mathematical and statistical counterparts. Further research on growth curves and other variables in poultry production, such as egg production and nutrient requirements, may offer better insight into neural network stabilization and validation.
CONCLUSIONS AND APPLICATIONS
1. Data simulation offers a viable alternative to empirical studies if the historical data, with means and SD, can be manipulated effectively within biological and computational bounds. 2. Neural network models are easier to use, require a smaller number of variables, and can be more efficient compared with their mathematical counterparts in predicting poultry growth, provided the data are manipulated effectively for such predictions. 3. Further research, particularly in animal nutrient requirements, may help further elucidate these models.
JAPR: Research Report
446
REFERENCES AND NOTES 1. Aggrey, S. E. 2002. Comparison of three nonlinear and spline regression models for describing chicken growth curves. Poult. Sci. 81:1782–1788. 2. Gompertz, B. 1825. On the nature of the function expressive of the law of human mortality, and on a new method of determining the value of life contingencies. Philos. Trans. R. Soc. 115:513–585. 3. Laird, A. K., S. A. Tyler, and A. D. Barton. 1965. Dynamics of normal growth. Growth 29:233–248. 4. Metropolis, N. 1987. The beginning of the Monte Carlo method. Los Alamos Sci. (Special issue):125–130. http://library.lanl.gov/la-pubs/00326866.pdf Accessed Jan. 28, 2009. 5. Fausett, L. 1994. Fundamentals of Neural Networks: Architectures, Algorithms, and Applications. Prentice-Hall Inc., Upper Saddle River, NJ.
6. Ahmad, H. A., and M. Mariano. 2006. Comparison of forecasting methodologies using egg price as a test case. Poult. Sci. 85:798–807. 7. Ward Systems Group. 1993. Neuroshell 2 User’s Manual. Ward Systems Group Inc., Frederick, MD. http:// www.wardsystems.com Accessed June 2, 2008. 8. Roush, W. B., W. A. Dozier III, and S. L. Branton. 2006. Comparison of Gompertz and neural network models of broiler growth. Poult. Sci. 85:794–797. 9. Palisade Corporation. 2000. @Risk 4.0. Palisade Corporation, Ithaca, NY. http://www.palisade.com/risk Accessed June 2, 2008. 10. Nahashon, S. N., S. E. Aggrey, N. A. Adefope, and A. Amenyenu. 2006. Modeling growth characteristics of meat type guinea fowl. Poult. Sci. 85:943–946.