Dec 15, 2004 - nullsteering in the case of the interferences' DOAs in line-of-sight (LOS) situation. ..... In order to accommodate a larger number of subscribers and to provide ... A wider band and higher transmission rate will make this a more critical .... âadaptive (array) antennaâ [4], âsoftware antennaâ [77,78], or âdigital ...
Doctoral Dissertation
Hardware Implementation of Signal Processing in Smart Antenna Systems for High Speed Wireless Communication (高速移動通信を実現するスマートアンテナ技術の実用化における 信号処理部の実装に関する研究)
Submitted on
December 15, 2004
Committee : Prof. Hiroyuki Arai (Supervisor, Chair) Prof. Yasuo Kokubun Prof. Ryuji Kohno Associate Prof. Toshihiko Baba Associate Prof. Koichi Ichige
Minseok Kim Department of Electrical and Computer Engineering, Yokohama National University, Yokohama, Japan
c �Copyright, 2004, Minseok Kim
博士論文
高速移動通信を実現する スマート アンテナ技術の実用化における 信号処理部の実装に関する研究
平成 16 年 12 月 15 日 提出
審査委員会 新井宏之 教授 (指導教官) 國分泰雄 教授 河野隆二 教授 馬場俊彦 助教授 市毛弘一 助教授
金ミンソク 横浜国立大学 工学府 物理情報工学専攻 電気電子ネットワークコース
c �Copyright, 2004, Minseok Kim
Abstract Smart antennas basically attempt to enhance the desired signal power and suppress the interferers by beamforming toward the DOA (direction-of-arrival) of the desired signal and nullsteering in the case of the interferences’ DOAs in line-of-sight (LOS) situation. This paper considers a smart antenna system for cellular base station application. The signals at the base station are received through the scattering process from the local scatterers around the mobile station because the antenna is usually deployed higher than surrounding scatterers. In this case, although the fading across the antenna elements spaced by λ/2 is highly correlated, the AS is typically only a few degrees. Hence, the angle domain approach exploiting the DOA information can be useful. Moreover, only the DOAs are commonly useful channel information in both uplink and downlink channels of Frequency Division Duplex (FDD) systems where each link uses different frequency. This is because the average angular power spectrums in both links are almost identical. Thus, in an uplink, we can estimate the channel parameters with the received data that have passed the channel and apply the estimated DOA information to downlink beamforming. In a downlink channel, smart antenna transmitters can focus the energy to the desired user using the DOA information, and thus reduce the interference for other users. This is the most significant feature of the angle domain approach with DOA estimation. This paper mainly aims at the practical and general applications of signal processing implementation of a smart antenna system for wireless cellular basestation systems. While theoretical studies are useful for analyses and simulation purposes, their implementation in real hardware and their validation with actual measurement data will be a meaningful challenge. This paper studies general signal processing independent of specific communication systems and hardware platforms. This paper proposes the smart antenna system based on the DOA estimation of incident signals, which includes fast DOA estimation and beamforming processors. The prototype system integrating signal processors on field programmable gate arrays (FPGAs) was manufactured and the evaluation testbed was configured. The prototype system employs an 8-element antenna array for 5 GHz band and an RF transceiver for each branch. The functionality of the baseband smart antenna processor was verified through hardware simulations and laboratory experiments. The entire hardware system, including RF, antenna arrays, and air interface, at both the transmitter and receiver configurations were also tested in a radio anechoic chamber. Smart antenna systems, especially those based on DOA estimations, usually require high computational performance for array signal processing. Apart from the hardware complexity i
of multiple transceivers and an impractically high cost, the limited performance of the signal processing devices has been a big obstacle to its realization. With the general Von Neumann architectured processors such as the general micro processing unit (MPU) or the digital signal processor (DSP) with a single or few Multiplier-ACcumulators (MACs), it may be difficult to process a large amount of data from multiple antenna elements in real-time. They also inefficiently consume large power because they are not optimized for the specific purpose. In this paper, FPGAs are basically used as digital signal processors. Due to to the recent progress of Very Large Scale Integration (VLSI) technology, FPGAs have evolved from flexible logic design platforms to signal processing engines. FPGAs are now expected to be essential components of a software radio, which includes smart antenna technology, due to their high order of flexibility by SRAM-based structure and real-time processing capabilities. They are inherently suitable for high-speed parallel MAC functions. However, it is incorrect to assume that all DSP functions can always be implemented in FPGAs. Floating point operation is difficult to implement in FPGAs because a large amount of gate resources are wasted and the performance cannot be optimized. Further, processing involving matrix inversion (or scalar division) is also more suitable to a DSP or MPU platform. Therefore, FPGAs and DSP have coexisted for a long time, and a flexible platform usually includes their combination. This paper presents the fixed-point processors of a fast DOA estimator and beamformer implemented with FPGAs. A DOA estimator incorporates unitary MUSIC algorithm, termed “Unitary MUSIC Processor (UMP).” Unitary MUSIC algorithm has a super resolution capability and is suitable for integration on logic circuit devices such as FPGAs. The techniques suitable for FPGAs, such as the eigenvalue decomposition by a cyclic Jacobi processor based on COordinate Rotation DIgital Computer (CORDIC) and spectrum computation by the spatial Discrete Fourier Transformation (DFT), can be exploited to optimize the fixed point arithmetic. This paper also proposes a novel beamforming technique with extremely low complexity that can use the estimated DOA information in the UMP. This beamformer computes the optimum weight vector with a simple convolution operation of precomputed beam and notch patterns; thus, it is able to provide a fast beamforming performance without any matrix inversion in conventional techniques. The remainder of this dissertation is organized as follows. Chapter 2 introduces the developed hardware platforms of the smart antenna transceiver system and includes its implementation details. The hardware requirements in smart antenna technologies are also discussed. The benefits of FPGAs as array signal processors will be described in comparison with generalpurpose DSP processors. The prototype transceivers were designed taking into consideration of the reconfigurable IF processing based on software-defined radio concept as well as the adaptive control of antenna beampattern. In order to implement this, the prototype transceivers are achitectured by low-IF super heterodyne with undersampling at receivers/harmonic band generation scheme in transmitters. In this chapter, the sampling jitter effect, which determines the maximum IF input frequency, is quantified based on measurements. The implementation of the smart antenna signal processing is described in Chapters 3 and 4. Chapter 3 presents the fast DOA estimation processor using unitary MUSIC algorithm. First, the design of a
ii
fast eigenvalue decomposition processor based on a cyclic Jacobi method with the CORDIC technique is described. Second, the implementation of a fast DOA estimation processor termed UMP by FPGAs on a developed transceiver platform is described. The performance will be also quantified by fixed-point hardware level simulation. Chapter 4 proposes a novel beamforming technique with extremely low complexity and presents its performance and hardware implementation. Chapter 5 describes the experimental evaluation of the integrated system performance. The effects caused by real hardware imperfections, such as mutual coupling among antenna branches, are discussed and array calibration issues will be dealt with in this chapter. Finally, Chapter 6 summarizes the dissertation describing the contributions and remaining problems and outlines the future works to be examined.
iii
Acknowledgments I am deeply grateful to many peoples who supported me in their helpful comments and enlightening suggestions. • First of all, my supervisor, Prof. Hiroyuki Arai always gave me the courage to carry out my research in Japan (aboard for me) as well as the technical and mental supports. I wish to express my gratitude to the committee members of Prof. Yasuo Kokubun, Prof. Ryuji Kohno, Associate Prof. Toshihiko Baba and Associate Prof. Koichi Ichige for helpful comments and careful reviews of this dissertation. I would like to express special appreciation to Associate Prof. Koichi Ichige for a plenty of advices and criticism about my research work. I also thanks to Associate Prof. Nobuhiko Kuga for his kind advise for my special research work. • I would like to express deep thanks to Dr. Masahiro Fukuta, Mr. Hirotake Horiuchi and Dr. Li Chao Tan of Brains Corporation for financial support. I am also deeply grateful to Prof. Kwang-cheol Ko of Hanyang University, Seoul, Korea that Prof. Ko and Dr. Fukuta actually gave me the opportunity to study in Japan and participate in this research work. Dr. Fukuta also helped me the hardware support in designing and manufacturing testbed system and guided the hardware implementation skills. • I would like to thank to Dr. Masahiro Karikomi of Nihon Dengyo Kousaku, Dr. Yoshio Ebine and Dr. Keizo Cho of NTT DoCoMo, Inc. and Dr. Koichi Tsunekawa of NTT Corporation for their research co-operation and helpful comments. • My appreciation goes to my colleagues; Shintaro Muramatsu, Naoya Matsumoto, Tatsuo Fuji, Aiko Kiyono and Atsushi Nakajima for their reseach cooperation. I would like to thank to other colleagues in my research group; Yuki Inoue and Dr. Kohei Mori of Sony Corporation and Dr. Naobumi Michishita of National Defense Academy for their helpful discussion. I also would like to extend my gratitude to everyone in Prof. Arai, Prof. Ichige and new born Prof. Kuga laboratories. I would like to express my appreciation to Mr. Takehiro Miyamoto of Nihon Dengyo Kousaku for his helpful research co-operation. • Finally, I owe special thanks to Shil my wife and Jaeweon my lovely son for their patience and understanding. And I also would like to thank my family including my parents in Korea for continuous encouragement.
iv
Contents Abstract
i
Acknowledgments
iv
Chapter 1 Introduction 1.1 Background . . . . . . . . . . . . . . . . . . . . . . . . . . . . 1.2 Wireless Communication Systems . . . . . . . . . . . . . . . . 1.3 Smart Antenna Technologies . . . . . . . . . . . . . . . . . . 1.3.1 Overview . . . . . . . . . . . . . . . . . . . . . . . . . 1.3.2 Basic Configuration and Optimization Techniques . . 1.3.3 Benefits . . . . . . . . . . . . . . . . . . . . . . . . . . 1.4 Smart Antenna System using Direction-of-Arrival Estimation 1.5 Scope and Contributions . . . . . . . . . . . . . . . . . . . . . 1.6 Outline . . . . . . . . . . . . . . . . . . . . . . . . . . . . . .
. . . . . . . . .
1 1 2 4 4 7 9 13 14 16
. . . . . . . . . . . . .
18 18 18 18 20 20 26 26 28 32 36 36 40 44
Chapter 3 Fast DOA Estimation Processor 3.1 Introduction . . . . . . . . . . . . . . . . . . . . . . . . . . . . . . . . . . . . . . 3.2 DOA Estimation using MUSIC algorithm . . . . . . . . . . . . . . . . . . . . .
45 45 46
Chapter 2 Smart Antenna Testbed System 2.1 Introduction . . . . . . . . . . . . . . . . . . . . . . . . . . 2.2 Hardware Requirements . . . . . . . . . . . . . . . . . . . 2.2.1 Digital Transceiver Architecture . . . . . . . . . . 2.2.2 Data Conversion Devices . . . . . . . . . . . . . . 2.2.3 Signal Processing Devices . . . . . . . . . . . . . . 2.3 Developed Smart Antenna Testbed System Overview . . . 2.3.1 Radio Frequency (RF) Components . . . . . . . . 2.3.2 Digital Signal Processing Unit . . . . . . . . . . . 2.3.3 Digital Receiver Implementation . . . . . . . . . . 2.4 Undersampling and ADC’s Input Frequency Limitation at 2.4.1 Sampling Jitter Effect in Undersampling Scheme . 2.4.2 Evaluation of Jitter Effect . . . . . . . . . . . . . . 2.5 Summary . . . . . . . . . . . . . . . . . . . . . . . . . . .
v
. . . . . . . . .
. . . . . . . . .
. . . . . . . . .
. . . . . . . . . . . . . . . . . . . . . . . . . . . . . . . . . . . . . . . . . . . . . IF Band . . . . . . . . . . . . . . .
. . . . . . . . .
. . . . . . . . . . . . .
. . . . . . . . .
. . . . . . . . . . . . .
. . . . . . . . .
. . . . . . . . . . . . .
. . . . . . . . .
. . . . . . . . . . . . .
. . . . . . . . .
. . . . . . . . . . . . .
. . . . . . . . .
. . . . . . . . . . . . .
3.3
3.4
3.5 3.6
3.7 3.8
3.2.1 Data Model . . . . . . . . . . . . . . . . . . . . . 3.2.2 MUSIC algorithm . . . . . . . . . . . . . . . . . 3.2.3 Unitary MUSIC DOA Estimation . . . . . . . . . Digital Signal Processor Design . . . . . . . . . . . . . . 3.3.1 Correlation Matrix with Unitary Transformation 3.3.2 MUSIC Spectrum Computation . . . . . . . . . . 3.3.3 Local Minima (LM) Detection . . . . . . . . . . Eigenvalue Decomposition Processor . . . . . . . . . . . 3.4.1 Cyclic Jacobi Method . . . . . . . . . . . . . . . 3.4.2 CORDIC Algorithm . . . . . . . . . . . . . . . . 3.4.3 Fixed-Point Implementation . . . . . . . . . . . . 3.4.4 Processor Structure . . . . . . . . . . . . . . . . 3.4.5 Computational Load and Expected Performance Hardware Implementation . . . . . . . . . . . . . . . . . Performance Assessments . . . . . . . . . . . . . . . . . 3.6.1 Noise Channel under Planar Wave Assumption . 3.6.2 Multipath Channel with Small Angle Spread . . Real Data Examples . . . . . . . . . . . . . . . . . . . . Summary . . . . . . . . . . . . . . . . . . . . . . . . . .
Chapter 4 DOA-based Beamforming Processor 4.1 Introduction . . . . . . . . . . . . . . . . . . . . . . 4.2 DOA-based Beamforming Techniques . . . . . . . . 4.2.1 Optimum Beamformers . . . . . . . . . . . 4.2.2 Low-sidelobe Beamformers . . . . . . . . . 4.2.3 Performance Comparison . . . . . . . . . . 4.3 Null Steering Beamformer with Notch Beams . . . 4.3.1 Basic Principle . . . . . . . . . . . . . . . . 4.3.2 Performance Improvement and Limitation . 4.4 Hardware Implementation . . . . . . . . . . . . . . 4.5 Performance Evaluation by Computer Simulations 4.6 Summary . . . . . . . . . . . . . . . . . . . . . . . Chapter 5 Integrated System Evaluation 5.1 Introduction . . . . . . . . . . . . . . . . . 5.2 System Configuration . . . . . . . . . . . 5.3 Data Model . . . . . . . . . . . . . . . . . 5.4 Integrated System Functions . . . . . . . 5.4.1 Estimation of Number of Sources . 5.4.2 DOA Estimation . . . . . . . . . . 5.4.3 User Identification . . . . . . . . . 5.4.4 DOA Tracking . . . . . . . . . . .
vi
. . . . . . . .
. . . . . . . .
. . . . . . . .
. . . . . . . .
. . . . . . . .
. . . . . . . . . . .
. . . . . . . .
. . . . . . . . . . .
. . . . . . . .
. . . . . . . . . . .
. . . . . . . .
. . . . . . . . . . . . . . . . . . .
. . . . . . . . . . .
. . . . . . . .
. . . . . . . . . . . . . . . . . . .
. . . . . . . . . . .
. . . . . . . .
. . . . . . . . . . . . . . . . . . .
. . . . . . . . . . .
. . . . . . . .
. . . . . . . . . . . . . . . . . . .
. . . . . . . . . . .
. . . . . . . .
. . . . . . . . . . . . . . . . . . .
. . . . . . . . . . .
. . . . . . . .
. . . . . . . . . . . . . . . . . . .
. . . . . . . . . . .
. . . . . . . .
. . . . . . . . . . . . . . . . . . .
. . . . . . . . . . .
. . . . . . . .
. . . . . . . . . . . . . . . . . . .
. . . . . . . . . . .
. . . . . . . .
. . . . . . . . . . . . . . . . . . .
. . . . . . . . . . .
. . . . . . . .
. . . . . . . . . . . . . . . . . . .
. . . . . . . . . . .
. . . . . . . .
. . . . . . . . . . . . . . . . . . .
. . . . . . . . . . .
. . . . . . . .
. . . . . . . . . . . . . . . . . . .
. . . . . . . . . . .
. . . . . . . .
. . . . . . . . . . . . . . . . . . .
46 47 48 50 50 52 55 56 56 57 61 64 65 68 71 71 75 77 79
. . . . . . . . . . .
80 80 81 81 84 85 88 88 92 95 98 103
. . . . . . . .
104 104 104 107 108 108 108 110 110
5.5
5.6
5.4.5 Beamforming . . . . . . . . . . . . . Experimental Evaluations . . . . . . . . . . 5.5.1 Evaluation Model . . . . . . . . . . . 5.5.2 Measurement Setup . . . . . . . . . 5.5.3 Antenna Array Calibration . . . . . 5.5.4 Measurement in Anechoic Chamber Summary . . . . . . . . . . . . . . . . . . .
Chapter 6
. . . . . . .
. . . . . . .
. . . . . . .
. . . . . . .
. . . . . . .
. . . . . . .
. . . . . . .
. . . . . . .
. . . . . . .
. . . . . . .
. . . . . . .
. . . . . . .
. . . . . . .
. . . . . . .
. . . . . . .
. . . . . . .
. . . . . . .
. . . . . . .
. . . . . . .
. . . . . . .
Conclusion
110 114 114 114 117 122 127 128
Appendix A
FB Spatial Smoothing with Unitary Transformation
130
Appendix B
SNR Conversion Relation
131
Appendix C Design Examples of Digital C.1 2-channel AD board . . . . . . . . . . . C.2 16-channel AD board . . . . . . . . . . . C.3 4-channel AD board . . . . . . . . . . . C.4 16-channel AD/DA board . . . . . . . .
Signal Processing . . . . . . . . . . . . . . . . . . . . . . . . . . . . . . . . . . . . . . . . . . . . . . . .
Unit . . . . . . . . . . . . . . . .
. . . .
. . . .
. . . .
. . . .
. . . .
. . . .
132 132 133 134 135
Bibliography
136
Publication list
144
vii
Chapter 1
Introduction 1.1
Background
In recent years, wireless communication systems have progressed greatly and the market, especially for the cellular phone, has witnessed explosive growth. Moreover, as the demand for multimedia services increases, a wider bandwidth of information will be required for nextgeneration wireless systems. These systems will be allocated at a higher frequency band because a number of useful frequency bands have already been allotted to and are occupied by existing systems. In order to accommodate a larger number of subscribers and to provide better quality services, it is necessary to increase the channel capacity. Further, the technologies required for power saving and efficient frequency reusability will be necessary for various multimedia services. In fact, multipath fading, which is typically caused by a reflection from any physical structure, is an unavoidable phenomenon in wireless communication environments, because the signals are usually propagated through a multipath, as shown in Fig.1.1 [3]. When passing through a multipath, the signals are delayed and out of phase from the signals passing through a direct path; this causes the signal strength to be weakened at the receiver, thus reducing the receiving quality. A wider band and higher transmission rate will make this a more critical problem in the improvement of the quality of service in next-generation communication. Many solutions have been proposed to resolve this problem. In fact, the flexible configuration of the receiver and transmitter is important as a response to the signal environment that recognizes spatial channel profiles as well as temporal ones. As an example, spatial diversity techniques using composite information from the array to achieve average signal-to-noise ratio of spatially separated antenna, thus minimizing undesirable fading effects of multipath propagation, have been studied in many applications. There exists another problem that is caused by multipath propagation. Delay spread is the difference in propagation delays among the multiple paths. It leads to inter-symbol-interference (ISI) that limits the maximum data rates. Frequency-selective fading occurs if the delay spread is equal to or larger than the inverse of the signal bandwidth. The third major limitation in wireless communication system is referred to as co-channel interferences (CCIs). In the case of the time division multiple access (TDMA) system, such as 1
CHAPTER 1. INTRODUCTION
2
CCI Sector BS
Multipath Fading
Delay MS
Fig. 1.1: Wireless cellular propagation environment. the Japanese personal digital cellular (PDC) systems, IS-136, and European Global System for Mobile communications (GSM), the CCIs are primarily caused by frequency reuse; this implies that the spectrum allocated for the system is reused multiple times in neighboring cells. The problem is that the signals received by a base station and a mobile handset usually contain a signal component that has originated from more distant cells as well as a signal component of the desired channel data from the current cell. CCIs degrade the carrier-to-interference power ratio (CIR); thus, the system capacity will be limited by more frequent handoffs and reduced connectivity. In order to cope with these inherent problems in wireless communication systems, smart antennas having multiple antennas have been proposed as a very promising technology to mitigate multipath fading and reject CCIs by efficiently exploiting the spatial domain signal processing; spatial domain signal processing is the next frontier of the resources of wireless systems for frequency, time, and code domain. Smart antennas can extend the capabilities of the next-generation systems to provide customers with increased data transmission throughput for high-speed multimedia applications.
1.2
Wireless Communication Systems
Wireless communication technologies have progressed greatly from the 1980s, as shown in Fig.1.2. This section presents a brief history of the wireless communication systems and provides an outlook into the future systems. In the first generation (1G) systems, analog systems such as advanced mobile phone system (AMPS) and total access communications system (TACS) grew rapidly in the 1980s and are still available today. These systems use frequency division multiplexing to divide the bandwidth into specific frequencies that are assigned to individual calls. The second generation (2G) systems introduced in the mid-90s are still used today. The second generation (2G) systems are digital and use either TDMA or code division multiple access (CDMA) methods. The Japanese PDC and European GSM are 2G digital systems with
CHAPTER 1. INTRODUCTION
3
Improvement in Frequency Utilization & Support for Multimedia 3G: Multimedia Communication
4G
Performance
W -CDMA Technology W-CDMA Technology
2G: Digital Improvement in Frequency Utilization
1G: Analog FDMA FDMA Technology Technology AMPS AMPS (N.A.) (N.A.) TACS TACS (Europe) (Europe) NTT NTT TACS TACS (JPN) (JPN)
~1990
CDMA CDMA Technology Technology IS-95 IS-95 (US, (US, Korea, Korea, Hong Hong Kong, Kong, Japan) Japan)
Wide-band Wide-band CDMA CDMA CDMA CDMA 2000 2000 UWC-136 UWC-136 IMT-2000
TDMA TDMA Technology Technology PDC PDC (Japan) (Japan) IS-54/136 IS-54/136 (US) (US) GSM GSM (Europe) (Europe)
Mid-90s
� Up to 2 Mbps Data � Global Roaming � High-Quality Multimedia
2000
Fig. 1.2: Wireless cellular communication system roadmap. their own TDMA access methods. On the other hand, the cellular systems in U.S.A., Korea, and Japan, use CDMA technology. The 2G digital services began appearing in the 1990s, providing expanded capacity and various unique services. “Third generation (3G)” has become an umbrella term to describe cellular data communications with a target data rate of 2 Mbits/sec (actually 64 ∼ 384 Kbps). The International Telecommunication Union (ITU) originally attempted to define 3G in its IMT-2000 (International Mobile Communications-2000) specifications that specified global wireless frequency ranges, data rates, etc. However, a global standard was difficult to implement due to differing frequency allocations around the world and conflicting inputs. Therefore, three operating modes were specified by WCDMA, CDMA2000, and Universal Wireless Communications-136 (UWC-136). The fourth generation (4G) systems may become available even before 3G is fully developed because 3G is a confusing mix of standards. In 4G systems, it is expected that the target data rate will be up to 100-Mbit/sec in pedestrian and 1-Gbit/sec in indoor area possibly higher. 4G will require a channel capacity above 10 times that of 3G systems and must also fully support Internet Protocol (IP) [25]. High data rates are a result of advances in signal processors, new modulation techniques, and smart antennas that can focus signals directly at the users. Orthogonal frequency division multiplexing (OFDM), multiple-input-multipleoutput (MIMO), and a combination of the above are promising schemes that can provide extremely high wireless data rates.
CHAPTER 1. INTRODUCTION
4
Sector 3 BS
Sector 1
Sector 2
Fig. 1.3: Sector antenna configuration (120-degree beams).
1.3 1.3.1
Smart Antenna Technologies Overview
The efficient use of the frequency resources is necessary to achieve higher data transmission throughput. Smart antenna systems are capable of automatically changing the directionality of their radiation patterns in response to their signal environment. This can noticeably improve the performance characteristics, such as channel capacity and quality of a wireless system. Smart antenna systems, by using spatially separated antennas, referred to as antenna array, maximize the signal-to-interference-plus-noise ratio (SINR) of the received signals, and suppress interferences and noise power by digital signal processing after analog to digital conversion. Conventional Antenna Systems Conventional antenna systems, which employ a single antenna, radiate and receive information equally in all directions. This omni-directional radiation leads to the distribution of energy in all directions. This wasted power becomes a potential source of interference for other users or for other base stations in other cells. Interference and noise reduce the signal-to-noise ratio (SNR) used for detection and demodulation, resulting in poor signal quality. Today’s cellular systems usually introduce 120◦ sectorization of the coverage to enhance capacity and reduce CCIs [14]. Figure 1.3 illustrates that three directional antennas can cover each sector area of 120◦ . Smart Antenna Systems On the other hand, smart antennas at the transmitter are capable of steering the maximum radiation pattern toward the desired mobile; at the receiver, they can spatially separate the energy of the interference and mitigate multipath fading using a software algorithm. This ensures that an optimum quality of service is delivered to users, and it provides maximum
CHAPTER 1. INTRODUCTION
5
Beam Selection
BF Network
Fig. 1.4: Switched beam antenna configuration.
A/D
Smart Antenna Processing
RF / IF
Fig. 1.5: Smart antenna receiver configuration with digital beamforming network.
Coding Modulation Mapping Weighting
Channel
Weighting Demapping Demodulation Decoding
Fig. 1.6: Multiple-Input-Multiple-Output (MIMO) configuration.
CHAPTER 1. INTRODUCTION
6
coverage for a base station. Smart antennas can use spatial domain processing by using multiple antennas, thus enabling them to have intelligence to process the data at both receiver and transmitter. The smart antennas are often classified as switched-beam arrays and adaptive array antennas [5, 8]. The switched-beam arrays comprise beamforming networks and a beam selection processor, as shown in Fig.1.4. The processor selects the beam with maximum power response by switching the beams. However, the adaptive array antennas incorporate more intelligence than the switched beam arrays. Adaptive array antennas can estimate their environment in accordance with the propagation channel responses between the receiver and the transmitter. This information is then used to weigh the data received at/transmitted from the antenna array to maximize the response for the desired user. Figure 1.5 illustrates the typical configuration of the adaptive array antennas. The processor determines the optimum weight vector for a given environment and thus, the adaptive antennas can combine the received signal maximizing the SINR and not merely SNR. As shown in Figs.1.4 and 1.5, smart antennas can provide space division multiple access (SDMA). In this case, the users may use the same frequency, time, or code allocations over the air interface and only be separated spatially. SDMA can be applied as a complementary scheme to Frequency Division Multiple Access (FDMA), TDMA, and CDMA, thus providing additional capacity enhancement. MIMO (Multiple-Input Multiple-Output) System In future wireless systems, both the base station and the mobile station will employ a smart antenna technique, referred to as MIMO system, as shown in Fig.1.6. Ironically, MIMO systems incorporate multipath propagation, which traditionally has been an inherent problem faced by wireless transmission. Multiple spatial channels can be used to dramatically increase the data rate [26, 27]. Moreover, space-time block coding (STBC) techniques have been proposed to improve the channel capacity [28, 29].
CHAPTER 1. INTRODUCTION
Software Defined Radio
7
Software Antenna
Smart Antenna (Interference Reduction, Diversity)
Switched Multi-beam Antenna
Adaptive Array Antenna Digital Beamforming Antenna (DBF)
Multiple-Input-Multiple-Output system (MIMO)
Fig. 1.7: Terminology. Terminology In this paper, the term “smart antennas” is used to denote complete antenna systems, including all components from the antenna to baseband digital signal processing. It is often termed “adaptive (array) antenna” [4], “software antenna” [77, 78], or “digital beamforming antenna (DBF antenna)” [9, 10]. Together, these imply an intelligent antenna system different from a conventional omni-directional or fixed-beam antenna system, which merely receive and transmit signals without any adaptive behavior to a change of environment [10, 11, 78]. In [5, 8], the term “smart antennas” is used broadly to imply a multiple antenna system including switched multi-beam antennas and adaptive array antennas. This paper uses the broad term “smart antennas” to imply a similar meaning as “adaptive array antenna”1 . Figure 1.7 shows the relationships between these terms.
1.3.2
Basic Configuration and Optimization Techniques
In general, smart antenna systems consist of the antenna array, frequency converters, data converters, and smart antenna processor, as shown in Fig.1.5. The antenna array is a set of multiple antennas that are designed to receive or transmit the signals with an adaptive beampattern. Arrays have various physical arrangements such as linear, circular, rectangular, etc. The geometry of an array antenna is determined taking into consideration its applications. The primary functions of the Radio Frequency (RF)/Intermediate Frequency (IF) circuitry are frequency conversion, filtering, and amplifying. The critical problem faced in the practical applications of smart antenna systems is the heavy hardware with multiple transceivers and high-performance digital signal processors. However, in order to improve frequency reusability, the smart antenna technology should be integrated in 4G systems. In order to explain the principle of smart antenna signal processing, the simple discrete wavefront model with narrowband signal is illustrated in Fig.1.8. The array geometry is assumed to be a uniformly equispaced linear array of identical and omni-directional M elements. 1
On the other hand, the term “software defined radio (SDR)” appears to be used in a broader sense. SDR means a set of all target processors required for radio communications, including antenna technology [79]. Hence, “smart antenna” technique might be a part of a SDR technology; however, the terms are often used interchangeably [77].
CHAPTER 1. INTRODUCTION
8
( k − 1)d Incident wave
s (t )
ve wa
θ
nt fro
•
( k − 1)d sin θ
x 1 (t )
•
xk ( t )
•
xM (t )
Fig. 1.8: Path difference in planar wave model (linear array of M -element). The electromagnetic wave arriving at the antenna array is also assumed to be planar. Let the angle between array normal and incident wave be θ; the far-field expression of the electrical signal at the k-th element at any time t is given by � � 2π (1.1) xk (t) = s(t) · exp −j d(k − 1) sin θ + nk (t) k = 1, 2, · · · , M λ where s(t), λ, and θ are the envelop, wavelength, and direction-of-arrival (DOA) of an incident wave, respectively. nk (t) is the additive white Gaussian noise (AWGN) at the k-th element, and d is the distance spaced between each antenna. In Eq.(1.1), if s(t) is a narrow band signal, the temporal delay caused by path difference between the elements corresponds to the phase difference. The output of the array antenna is produced by the inner product (multiply-accumulate operation) of input signals and weight coefficients determined by adaptive algorithms as y(t) =
M �
wk∗ xk (t).
(1.2)
k=1
Equation (1.2) can be also rewritten by vector expression as y(t) = wH x(t) where the superscript by
H
(1.3)
denotes Hemitian transpose operator. The data vector x is written
x(t) = a(θ)s(t) + n(t), where a(θ) denotes array mode vector as � � ��T � � 2π 2π , a(θ) = 1, exp −j d sin θ , · · · , exp −j d(M − 1) sin θ λ λ
(1.4)
(1.5)
In the absence of interference, the adaptive beamforming performs by maximizing the output SNR. In the presence of interferences, the SINR will be maximized by reducing the power of the interference. If a single planar wave arrives through a single path as per the above assumption, Eqs.(1.3)-(1.5) show that the optimum weight vector becomes the mode vector of the incident wave.
CHAPTER 1. INTRODUCTION
9
However, in an actual multipath propagation environment, the signals arrive in more complex manner experiencing different paths, for example, as x(t) =
N −1 �
v i (t, τ )si (t) + n(t),
(1.6)
i=0
where �
L(t)−1
v i (t, τ ) =
Al,i (t)ejφl,i (t) a (θl,i (t)) δ (t − τl,i (t)),
(1.7)
l=0
Al,i , φl,i , τl,i , and θl,i denote the amplitude, carrier phase shift, time delay, and DOA of the l-th signal component of the i-th mobile, respectively. In general, each of these signal parameters will be time-varying. L(t) is the number of multipath components. The amplitude Al,i of the multipath components is usually modeled as a Rayleigh distributed random variable, while the phase shift φl,i is uniformly distributed. The time varying components depend on the Doppler shift fd [23]. A number of techniques have been proposed to determine the optimum weight, such as minimizing mean square error (MMSE), whose solutions are based on solving Wiener-Hopf equation, maximizing signal to noise ratio (MSN), which is based on generalized eigenvalue problem, and linearly constrained minimum variance filter (LCMV) or directional constrained minimizing power (DCMP), which requires the information of DOAs of desired signals and interferers as priori. They require some channel information, such as the training sequence in the case of MMSE and the directional information of incident signals in the case of MSN and LCMV. There are also blind methods, such as constant modulus algorithm (CMA), in which the directional information is not necessary. However, the spatial channel signature such as DOAs of incident signals is often required for efficient spatial domain processing. Various techniques of DOA estimation have been studied as another field of adaptive antenna technologies [7,12]. We have cited several excellent review papers which report these techniques [5, 7, 13].
1.3.3
Benefits
Smart antennas can provide solutions for three major wireless problems-multipath fading, delay spread, and CCIs-as given below: Diversity Smart antennas basically improve SNR with a combination of signals at each branch; additionally, they can provide diversity gain. Diversity technique incorporates the fading uncorrelation. The basic methods by which diversity gain is provided are by using the spatial, polarization, and angle diversity [3]. Among the elements, spatial diversity with spatially separated antennas has a low correlation. Theoretically, among the antenna elements, a M -element smart antenna system has an M -fold diversity gain with sufficiently low fading correlation as well as
CHAPTER 1. INTRODUCTION
10
M -fold antenna gain (beamforming gain). When it cancels L interferers (L < M ), (M − L)fold diversity gain can be achieved [8]. In an urban cellular basestation, the signals at the base station are received by a scattering process in the vicinity of the mobile station because the antenna is usually deployed higher than the surrounding scatterers. Thus, if the mobile station is sufficiently far from the base station [23], the angle spread (AS) is typically only a few degrees. The measured AS in an urban cellular base station with an antenna height of 35 meters (rooftop of a building) and 80 meters (pylon) at 2 GHz band was reported to be approximately 2 ∼ 5 degrees [24]. Figure 1.9 shows an example of the diversity and beamforming gains in an 8-element antenna array under none-line-of-sight (NLOS) multipath Rayleigh fading channel with an AS of 10 degrees, where UBF, DCBF, and MRC denote the uniform beamformer, Dolph-Chebyshev beamformer, and maximum ratio combiner, respectively. The smaller the AS, the lesser will be the diversity gain achieved, as shown in Fig.1.10, where there is no apparent diversity gain with an AS of 0 degree. Delay Spread Reduction The spatial dimension can be utilized by using multiple antennas in receivers/transmitters. Array signal processing is capable of producing transmit/receive beams toward the desired mobile. It is simultaneously possible to place spatial nulls in the direction of undesired interferences; this is termed as null-steering. This feature can improve the performance of a mobile communication system. Smart antennas have a higher gain than a conventional omnidirectional antenna. The higher gain can be used to either increase the effective coverage, or to increase the receiver sensitivity. Conversely, it can be used to reduce transmit power and electromagnetic radiation in the communication network. Multi-path propagation in mobile radio environments results in ISI. The adverse effects of multi-path and ISI can be reduced by using transmit and receive beams that are directed toward the desired mobile. Smart antenna transmitters emit less interference by only sending RF power that is concentrated in the desired directions. Interference Suppression Smart antennas can improve SINR (Signal to Interference and Noise Ratio) performance by adaptively controlling the directivity of the antenna radiation pattern. Interference suppression is enabled by exploiting the spatial dimension; this is not possible with processing in the time domain only. The desired signal and CCI arrive at the receiver with well separated spatial signatures thus allowing the smart antenna to extract the desired signal and suppress the CCIs completely. During transmission, the smart antenna can focus the energy to the desired user, thus reducing the interference for other users.
CHAPTER 1. INTRODUCTION
11
0
10
AS = 10 Single Elem. 1
Ave. BER
10
DCBF 2
10
Beamforming
Diversity Gain (7dB)
Gain (9dB)
UBF
3
10
MRC
4
10
0
2
4
6
8
10
12
14
16
18
Ave. SNR per bit [dB]
(a) Diversity gain at BER = 0.01
0
10
AS = 10 DCBF
CDF
Diversity Gain 10
MRC UBF
Beamforming Gain
1
MRC Gain Ave.
Single Elem.
2
10 15
10
5
0
5
10
15
20
25
30
SNR [dB]
(b) Diversity gain at CDF of output SNR = 0.1% when average SNR = 13 dB
Fig. 1.9: Diversity gains with 8-element antenna array (multipath Rayleigh fading channel, angle spread =10◦ ).
CHAPTER 1. INTRODUCTION
12
0
0
10
10
AS = 0
AS = 0 1
Single Elem.
UBF
2
10
DCBF
DCBF
CDF
Ave. BER
10
MRC
1
10
UBF Single Elem.
Ave.
MRC
3
10
4
2
10
0
2
4
6
8
10
12
14
16
10 15
18
10
5
0
Ave. SNR per bit [dB]
5
10
15
20
25
30
25
30
25
30
SNR [dB]
(a) Ave. BER (AS=0◦ )
(b) Output SNR (AS=0◦ )
0
0
10
10
AS = 3
AS = 3 1
10
DCBF
CDF
Ave. BER
Single Elem. 2
10
UBF
1
10
Single Elem.
DCBF
Ave.
UBF MRC
3
10
MRC
4
2
10
0
2
4
6
8
10
12
14
16
10 15
18
10
5
0
Ave. SNR per bit [dB]
5
10
15
20
SNR [dB]
(c) Ave. BER (AS=3◦ )
(d) Output SNR (AS=3◦ )
0
0
10
10
AS = 5
AS = 5 1
10
DCBF
CDF
Ave. BER
Single Elem. 2
10
DCBF
10
1
MRC
UBF
Single Elem.
Ave.
3
10
UBF
MRC
4
10
2
0
2
4
6
8
10
12
14
Ave. SNR per bit [dB]
(d) Ave. BER (AS=5◦ )
16
18
10 15
10
5
0
5
10
15
20
SNR [dB]
(e) Output SNR (AS=5◦ )
Fig. 1.10: Diversity combining with 8-element antenna array (multipath Rayleigh fading channel with small angle spread).
CHAPTER 1. INTRODUCTION
1.4
13
Smart Antenna System using Direction-of-Arrival Estimation
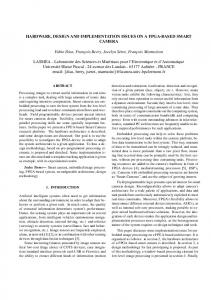
Smart antennas basically attempt to enhance the desired signal power and suppress the interferers by beamforming toward the DOA of the desired signal and nullsteering in the case of the interferences’ DOAs in line-of-sight (LOS) situation. Theoretically, the maximum (M − 1) interferers can be canceled with the M -element array. If LOS exists between the transmitter and the receiver, maximum incident energy is concentrated on the look direction as a single plane wave. The high-resolution estimation techniques for DOAs of incident signals, including MUltiple SIgnal Classification (MUSIC) [30] and Estimation of Signal Parameters Rotational Invariance Technique (ESPRIT) [31], are useful for efficient beamforming. These types of beamforming techniques are based on the angle domain approach that exploits the fading correlation among antenna elements. Hence, diversity gain cannot be achieved. However, in multipath propagation environments, there may be several situations that are NLOS. In such cases, there are usually a large number of multipath signals, more than the number of antennas. The beamforming in angle domain with DOA information of the propagation channel is not valid here because the DOA of the signal cannot be considered as the single wavefront of a plane wave. However, smart antenna systems can combine the multipath signals and cancel interferences that are less than the number of antenna elements independent of the number of paths in a multipath. On the basis of the signal domain approach, additional diversity gain can be achieved by exploiting the fading uncorrelation among antenna elements. When the delay spread is not sufficiently small, the correlation between the original signal and the delayed versions decreases; thus, the smart antenna system cancels the delayed versions as separate signals. In this case, the supposition that the maximum (M − 1) delayed signals can be canceled with M -element array is also valid [8]. This paper considers a smart antenna system for cellular base station application. As mentioned above, the signals at the base station are received through the scattering process from the local scatterers around the mobile station because the antenna is usually deployed higher than surrounding scatterers, as shown in Fig.1.11. In this case, although the fading across the antenna elements spaced by λ/2 is highly correlated, the AS is typically only a few degrees. Hence, the angle domain approach exploiting the DOA information can be useful. Moreover, only the DOAs are commonly useful channel information in both uplink and downlink channels of Frequency Division Duplex (FDD) systems where each link uses different frequency. This is because the average angular power spectrums in both links are almost identical. Thus, in an uplink, we can estimate the channel parameters with the received data that have passed the channel and apply the estimated DOA information to downlink beamforming. In a downlink channel, smart antenna transmitters can focus the energy to the desired user using the DOA information, and thus reduce the interference for other users. This is the most significant feature of the angle domain approach with DOA estimation. In fact, the DOA estimation techniques basically assume that the incident waves are planar and incoherent; hence, they are often expressed by discrete wavefronts from point sources. In an urban cellular base station environment, a large number of coherent signals experiencing
CHAPTER 1. INTRODUCTION
14
Angle Spread BS
Fig. 1.11: Cellular base station environment for uplink. multipath of far field local scatterers arrive from spread DOAs. This reduces the fading correlation among the antenna elements. Hence, the SNR at every element becomes a random variable with any distribution and the estimation performance in this case will be degraded [39]. However, various joint estimation techniques of DOAs and AS have been proposed [40–42]. Further, tracking techniques can provide a statistical average performance of DOA estimation in a fading environment with small AS [65]. The main features of the angle domain approach using DOA estimations are as follows: • Application for urban cellular base station with small angle spread [8, 16]. • Estimated DOAs can be the only common useful information in FDD system [19–21,65]. • No straight diversity gain; however, angular diversity can be available by combining multipaths [65]. • Large computational load is required for DOA estimation [16].
1.5
Scope and Contributions
This paper aims at the practical and general applications of signal processing implementation of a smart antenna system for wireless cellular basestation systems. While theoretical studies are useful for analyses and simulation purposes, their implementation in real hardware and their validation with actual measurement data will be a meaningful challenge. This paper proposes the smart antenna system based on the DOA estimation of incident signals, which includes fast DOA estimation and beamforming processors. The prototype system integrating signal processors on field programmable gate arrays (FPGAs) was manufactured and the evaluation testbed was configured. The prototype system employs an 8-element antenna array for 5 GHz band and an RF transceiver for each branch. The functionality of the baseband smart antenna processor was verified through hardware simulations and laboratory experiments. The entire hardware system, including RF, antenna arrays, and air interface, at both the transmitter and receiver configurations were also tested in a radio anechoic chamber.
CHAPTER 1. INTRODUCTION
15
Smart antenna systems, especially those based on DOA estimations, usually require high computational performance for array signal processing. Apart from the hardware complexity of multiple transceivers and an impractically high cost, the limited performance of the signal processing devices has been a big obstacle to its realization. With the general Von Neumann architectured processors such as the general micro processing unit (MPU) or the digital signal processor (DSP) with a single or few Multiplier-ACcumulators (MACs), it may be difficult to process a large amount of data from multiple antenna elements in real-time. They also inefficiently consume large power because they are not optimized for the specific purpose. In this paper, FPGAs are basically used as digital signal processors. Due to to the recent progress of Very Large Scale Integration (VLSI) technology, FPGAs have evolved from flexible logic design platforms to signal processing engines. FPGAs are now expected to be essential components of a software radio, which includes smart antenna technology, due to their high order of flexibility by SRAM-based structure and real-time processing capabilities. They are inherently suitable for high-speed parallel MAC functions. However, it is incorrect to assume that all DSP functions can always be implemented in FPGAs. Floating point operation is difficult to implement in FPGAs because a large amount of gate resources are wasted and the performance cannot be optimized. Further, processing involving matrix inversion (or scalar division) is also more suitable to a DSP or MPU platform. Therefore, FPGAs and DSP have coexisted for a long time, and a flexible platform usually includes their combination [81]. This paper presents the fixed-point processors of a fast DOA estimator and beamformer implemented with FPGAs. A DOA estimator incorporates unitary MUSIC algorithm, termed “Unitary MUSIC Processor (UMP).” Unitary MUSIC algorithm has a super resolution capability and is suitable for integration on logic circuit devices such as FPGAs. The techniques suitable for FPGAs, such as the eigenvalue decomposition by a cyclic Jacobi processor based on COordinate Rotation DIgital Computer (CORDIC) and spectrum computation by the spatial Discrete Fourier Transformation (DFT), can be exploited to optimize the fixed point arithmetic. This paper also proposes a novel beamforming technique with extremely low complexity that can use the estimated DOA information in the UMP. This beamformer computes the optimum weight vector with a simple convolution operation of precomputed beam and notch patterns; thus, it is able to provide a fast beamforming performance without any matrix inversion in conventional techniques. The major original contributions of this dissertation can be listed at a glance as follows: • Hardware implementation of smart antenna transceivers testbed. • Designing a fast eigenvalue decomposition processor based on cyclic Jacobi method with hardware-friendly CORDIC technique [100]. • Fixed-point processor design and simulation of Unitary MUSIC (MUltiple SIgnal Classification) algorithm [73]. • Hardware implementation on FPGAs of fast DOA estimation processor using Unitary MUSIC algorithm [73].
CHAPTER 1. INTRODUCTION
16
• Proposal and evaluation of a novel beamforming technique of NDC-BF (Null steering Dolph-Chebyshev beamformer) [48]. • Evaluation of the integrated real-hardware system to verify the functionality. • Examination of sampling jitter effect on digital downconversion receiver architecture [93].
1.6
Outline
The remainder of this dissertation is organized as shown in Fig.1.12. Chapter 2 introduces the developed hardware platforms of the smart antenna transceiver system and includes its implementation details. The hardware requirements in smart antenna technologies are also discussed. The benefits of FPGAs as array signal processors will be described in comparison with general-purpose DSP processors. The prototype transceivers were designed taking into consideration of the reconfigurable IF processing based on software-defined radio concept as well as the adaptive control of antenna beampattern [77]. In order to implement this, the prototype transceivers are achitectured by low-IF super heterodyne with undersampling at receivers/harmonic band generation scheme in transmitters. In this chapter, the sampling jitter effect, which determines the maximum IF input frequency, is quantified based on measurements. The implementation of the smart antenna signal processing is described in Chapters 3 and 4. Chapter 3 presents the fast DOA estimation processor using unitary MUSIC algorithm. First, the design of a fast eigenvalue decomposition processor based on a cyclic Jacobi method with the CORDIC technique is described. Second, the implementation of a fast DOA estimation processor termed UMP by FPGAs on a developed transceiver platform is described. The performance will be also quantified by fixed-point hardware level simulation. Chapter 4 proposes a novel beamforming technique with extremely low complexity and presents its performance and hardware implementation. Chapter 5 describes the experimental evaluation of the integrated system performance. The effects caused by real hardware imperfections, such as mutual coupling among antenna branches, are discussed and array calibration issues will be dealt with in this chapter. Finally, Chapter 6 summarizes the dissertation describing the contributions and remaining problems and outlines the future works to be examined.
CHAPTER 1. INTRODUCTION
17
Chap. 1
Introduction Introduction Chap. 2
Smart Smart Antenna Antenna Testbed Testbed System System
Transceiver Implementation
DSP Implementation Chap. 3
Chap. 4
Fast Fast DOA DOA Estimation Estimation Processor Processor
DOA-based DOA-based Beamforming Beamforming Processor Processor
UMP
NDC-BF
Chap. 5 Total Evaluation
Integrated Integrated System System Evaluation Evaluation Chap. 6
Summary Summary & & Conclusion Conclusion
Fig. 1.12: Structure of dissertation.
Chapter 2
Smart Antenna Testbed System 2.1
Introduction
This chapter introduces the developed hardware platforms of the smart antenna transceiver system and its implementation details. First, the hardware requirements to realize smart antenna technologies are discussed from the viewpoint of the SDR concept [79]. The benefits of the FPGAs as array signal processors will be described in comparison with general-purpose DSP processors. This system was designed taking into consideration of the reconfigurable IF processing in accordance with the concept of SDR as well as adaptive control of antenna beampattern [77]. In order to achieve this, a low-IF super heterodyne architecture with undersampling at the receivers [93] and harmonic band generation scheme at the transmitters [94] is a promising scheme that is currently available. In this chapter, the sampling jitter effect in receivers, which usually determines the maximum IF input frequency of ADCs, is discussed and quantified by measurement. This chapter also introduces the testbed systems involved in RF components and baseband signal processors.
2.2 2.2.1
Hardware Requirements Digital Transceiver Architecture
Traditional radio transceiver systems perform frequency up/downconversion, mixing, bandpass or lowpass filtering, gain control, and quadrature modulation/demodulation after DACs/before ADCs by analog devices. This section describes smart antenna architecture focusing on the receiver; however, the transmitter is usually completely reciprocal to the receiver. Figure 2.1 shows the traditional super-heterodyne receiver architecture. And, there can be several other receiver architectures as well. On the basis of the number of downconversion stages it has, these architectures are generally classified into direct conversion with only single downconversion stage at RF into baseband and super-heterodyne with more than one downconversion stage at RF into baseband via IF. However, in a digital radio system, the placement of the ADCs is an extremely critical factor in the entire system architecture. In order to make the systems commercially available and
18
CHAPTER 2. SMART ANTENNA TESTBED SYSTEM LPF
Analog AMP
A/D A/D
AMP
A/D A/D
Digital
I Demodulation Demodulation
Mixer
19
BPF
LNA
AMP
LPF
Q LO1 LO2
0o 90o
Fig. 2.1: Baseband sampling receiver architecture. Analog
Digital Down Converter
Digital
cos( ωc ⋅ n) LPF
AMP
A/D A/D
NCO
LPF
Q
LO
Demodulation Demodulation
Mixer LNA
I
BPF
− j sin(ω c ⋅ n) NCO : Numerical Control Oscillator
Fig. 2.2: IF sampling receiver architecture. practically realizable in newer technologies, low IF oversampling architecture is an extremely attractive option. An example of low IF oversampling architecture is illustrated in Fig.2.2. Such a system directly digitizes the downconverted IF signals and subsequently, generates complex baseband signals by the digital downconversion (DDC) function. The DDC consists of a Numerical Controlled Oscillator (NCO), a pair of multipliers (mixers in analog sense), lowpass filters, and decimators for the I and Q component. In this architecture, the analog mixer and lowpass filters are replaced by digital signal processing. The linearity of digital signal processing of mixers and filters ensures the perfect orthogonality of the I/Q signals. In general, once a signal is sampled by an ADC at a high frequency band, fewer analog components are used for downconversion and filtering and the system flexibility will be increased [72]. However, recent technology has provided no easy solution for oversampling the signals directly at the RF or IF band, ranging from tens of MHz to several GHz. For example, the typical sample-hold performance of ADCs are degraded with an increase in the input frequency, thus limiting the input frequency bandwidth of ADCs [88]. In addition, more stringent requirements have to be met for extremely high Q analog bandpass filters in order to prevent distortion of the desired signal by strong adjacent channel signals. Currently, there are very few devices that are capable of directly sampling the RF signal; therefore, from the practical and commercial points of view, undersampling is an alternative technique [84].
CHAPTER 2. SMART ANTENNA TESTBED SYSTEM
2.2.2
20
Data Conversion Devices
The performance of an ADC can be characterized by several parameters. These are resolution, conversion speed, linearity, dynamic range, and power consumption. Usually, the requirement of an ADC depends on its specific application. In SDR technologies including smart antennas, most analog components will be replaced by digital signal processing in order to maximize system flexibility [77, 79]. The digital signal processor can perform various operations including downconversion, demodulation, and filtering. The analog-to-digital converters (ADCs) in such systems will be located as close to the antennas as possible in order to achieve almost complete digital processing. In order to realize this, ADCs capable of digitizing a high-frequency wideband signal at very high sampling rates will be required along with wideband or multi-band antennas and RF analog devices. However, direct analog-to-digital conversion at oversampling rates of very high RF or IF signals, typically ranging between hundreds of MHz to several GHz, may not yet be practical because the reasonably price ADCs and sufficiently high-speed digital devices, such as current signal processors and buffer memories, cannot be used. The undersampling technique is always useful by performing frequency downconversions and quantization at the same time.
2.2.3
Signal Processing Devices
Software radios with smart antenna system implementation lead to a considerable increase in processing requirements. Previously, a single stream of data emanated from a single antenna; now, multiple data streams have to be processed. The data flow in smart antenna processing is not a single-input data stream. We have K data streams that must be processed from the K antenna elements. The basic fundamental operation carried out in a smart antenna system is passing the data stream from each antenna through an adaptive finite impulse response (FIR) filter. It must be noted that in narrowband applications, the adaptive FIR filters simplify to a single weight vector. If we consider a simple example where we have K (= 8 herein) antenna elements and a narrowband system, the computational requirements are • Weight computation: In case of Minimum Mean Square Error (MMSE) smart antenna processing by recursive least square (RLS) method, 4K 2 + 4N + 2 complex multipliers, or 16K 2 + 16K + 8 real multipliers per update are required [9, 49]. If 16 iterations are required for the weight convergence per update and the processor serves 8 users every 0.5 ms (2,000 KHz), the total number of real multiply operations required in processing RLS can be obtained by � � [ops/sec] NRLS = ru 16K 2 + 16K + 8 � � = (8 × 2000 × 16) × 16 × 82 + 16 × 8 + 8
(2.1)
= 297 MOPS where ru denotes the update rate (per second) and MOPS stands for mega operation per second. If a real multiplication is approximately equivalent to a floating point operation
CHAPTER 2. SMART ANTENNA TESTBED SYSTEM
21
in general-purpose processors, 297 MFLOPS (Mega FLoating point OPerationS) should be required. • Beamforming: Beamforming is performed by the multiplication of the data vectors (multiple data symbols) and the weight vector. For the above condition, the required number of real multiplications is given by NBF = 4 × rb × Lframe × K
[ops/sec]
(2.2)
= 4 × (8 × 2000) × 136 × 8 = 70 MOPS where rb denotes the beamforming rate that was assumed to be the update rate per 1 ms for 8 users. • FIR filtering: If the receiver employs IF processing such as digital downconversion, which mainly involves FIR filtering, the number of real multiplications required for I and Q components is given by NFIR = rs × ntap × (2 × K)
[ops/sec]
(2.3)
= 40 × 106 × 8 × (2 × 8) = 5, 120 MOPS where rs denotes the sampling rate, which was assumed as 40 MHz and 8-tap FIR filter was assumed. The resulting amount of processing given above appears to be reasonable for performance by a general-purpose DSP processor that, today, offers approximately 1 GFLOPS. However, if the system needs to support more users and to employ more antennas within a shorter computation time, the processing capability of a general-purpose processor will attain its performance limit. Powerful DSP devices can be developed for handling high-performance requirements by using an application-specific processors, such as Application Specific Integrated Circuits (ASICs) and FPGAs. Furthermore, we can take advantage of the FPGA flexibility for directly handling data acquisition control and other DSP functions such as digital downconversion, demodulation, and smart antenna processing. FPGAs (Field Programmable Gate Arrays) Since the VLSI technologies have made significant progress in recent times, the processing speed is increasing and the scale of integration is becoming larger. SRAM-based FPGA technology has led to another alternative solution for digital signal processing. As mentioned above, we can easily have an extremely high-performance DSP processor with multiple MACs using FPGAs. For example, the performance of 1 GOPS (Giga Operation Per Second) can be achieved when 10 MACs operating at 100 MHz are integrated1 . The solution for power consumption is a 1
In a general-purpose DSP, 1 GOPS is equivalent to 1 GFLOPS
CHAPTER 2. SMART ANTENNA TESTBED SYSTEM
22
IO Blocks
Programmable Interconnection
(Memory Blocks)
Fig. 2.3: Structure of an SRAM-based FPGA (by Altera Corp.). significant factor when considering applications for a mobile terminal. FPGA can also provide optimization of power consumption. A programmable logic device (PLD) is loosely defined as a device with configurable logic and flip-flops (FFs) linked together with a programmable interconnect. An FPGA is a type of programmable logic device that is combined with an array of gates having programmable interconnections with SRAM, logic blocks, and memory blocks, as shown in Fig.2.3. In addition, recent FPGAs often provide dedicated MAC blocks operating at frequencies greater than 200 MHz to meet increasing DSP demands [102]. FPGAs can be reconfigured infinite times after manufacture; however, they are generally distinct from PLDs because they have a higher order of logic capacity. FPGAs consist of logic blocks and an interconnection to connect them. The logic block usually contains lookup tables (LUTs) and FFs store data, as shown in Fig.2.4. Input ports are connected to LUT input ports or FF input ports and outputs from LUTs are either connected to output ports of the logic block or connected to FF input ports. Various combinations of inputs can be chosen by multiplexing, and sequential logic with memory element consisting of FFs as well as combinational logic with LUTs are also available [80].
Digital Signal Processing on FPGAs There are several methods of implementing digital signal processing. One is to use a generalpurpose processor (DSP or MPU), and the other is to use an application-specific device, such as an ASIC. While general-purpose processor solutions are very flexible because their architectures are optimized to process a fixed set of instructions, they may not be ideally suitable for
CHAPTER 2. SMART ANTENNA TESTBED SYSTEM
Carry In
Cascade In
DATA1 DATA2 DATA3
Look-up Table (LUT)
Cascade Cascade & Chain Carry Chain
Load PreComputed Logic
PRN D Q
LE Out
CLK CLRN
DATA4 1010 0011 1100 1110
23
Carry Cascade Out Out
Fig. 2.4: Simple diagram of FPGA logic element (LE) (by Altera Corp.). the specific application; ASIC solutions enable the designing of a custom architecture that is optimized for a particular application. For example, a general-purpose processor has single or multiple MAC stages so that the computations can be sequentially executed, namely serially. However, an ASIC implementation can have multiple parallel MAC stages. Regarding a specific application, when comparing the performance of the ASIC vis-a-vis the general-purpose processor, it becomes apparent that the latter offers relatively low speed but maximum flexibility (programmability) while the former provides a high speed with minimal flexibility. On the other hand, an FPGA combines the versatility of a programmable solution with the performance of a dedicated processor, as shown in Fig.2.5. An FPGA can achieve the true aim of parallel processing executing algorithms with the inherent parallelism due to distributed arithmetic structure while avoiding the instruction fetch and data load/store bottlenecks of traditional Von Neumann architectures [61, 62, 80]. Figure 2.6 shows the comparison of MAC operations for an FIR filter in a general-purpose processor with that of a single MAC stage and an FPGA with multiple MAC stages. For example, it can be seen that a 256-tap FIR filter requires 256 iterations of MAC operations in a general-purpose processor while in an FPGA, 256 MACs can operate simultaneously at only one clock cycle. Implementing signal processing function in FPGA devices has the following advantages, as listed in Tab.2.1 [80]. FPGAs are expected to be a key device in the implementation of software defined radios including smart antennas due to their high performance, flexibility, reconfigurablity, etc. FPGAs have evolved from being flexible logic design platforms to signal processing engines. Due to their flexibility and real-time processing capabilities, they are now an essential component of software defined radios, including smart antenna technology. System designers are increasingly porting more and more signal processing functionalities in FPGAs. The flexibility of having the ability to integrate logic design with signal processing is pushing designers to replace traditional DSPs with FPGAs. FPGAs are inherently suited for high-speed parallel multiply and accumulate functions. For example, current generation FPGAs can perform 36×36 MAC operations at speeds greater than 200 MHz. This makes FPGAs an ideal platform for operations such as FFT, FIR filters, digital downconverters (DDC), digital upconverters
CHAPTER 2. SMART ANTENNA TESTBED SYSTEM Flexibility of DSP, with Performance of ASIC
Flexible, But Lacks Real-Time Performance
Flexibility
24
DSP DSP Processor Processor
DSP DSP On On FPGA FPGA
High Performance, but Inflexible
ASSPs ASSPs
ASICs ASICs
Performance
Fig. 2.5: Flexibility vs. Performance (by Altera Corp.). (DUC), correlators, and pulse compression (for radar processing). However, this does not imply that all digital signal processing functionalities may be implemented in FPGAs. It is difficult to implement floating point operations in FPGAs due to the large amount of area needed in the device. Further, processing involving matrix inversion (or division) is also more suited to a DSP/MPU platform. It can be expected that FPGAs and DSP have thus coexisted for a long time, and a flexible platform will include their combination [81].
CHAPTER 2. SMART ANTENNA TESTBED SYSTEM
D Q
25
D Q
D Q
clk
Iteration
D Q Single MAC
clk
Multiple MACs
256 iterations are required for 256-tap FIR filter
256 MACs operations in 1 clock cycle for 256-tap FIR filter
(a) Single MAC in general DSP processor
(b) Multiple MACs in FPGA
Fig. 2.6: Comparison of MAC operations for FIR filter.
Table 2.1: Comparison of FPGA and DSP processor (simple version of [80]). FPGA
DSP
Programmable Languages
VHDL and Verilog
C language and Assembly
Ease of S/W programming
Fairly easy but needs understanding the hardware architecture
Easy
Performance
Very fast if optimized
Speed depends on operating clock speed
Reconfigurablity/ Programmability
SRAM-type FPGAs can be reconfigured infinite times
Re-programmable by changing program
Outperforming Area
Digital Filters, FFT, etc
Sequential processing
Power Consumption
Can be minimized if circuit is optimized
Cannot optimize
Implementation Method of MAC
Parallel and distributive arithmetic
Repeat operation of one or a few MACs
Speed of MAC
Can be fast if a parallel algorithm
Depends on operation clock speed
Parallelism
Can be parallelized for high performance
Usually sequential and cannot be parallelized
CHAPTER 2. SMART ANTENNA TESTBED SYSTEM
26
Table 2.2: Specifications of RF parts. Antennas
8-element sleeve antennas
Array geometry
Linear array equi-spaced by λ/2
RF frequency
2 ∼ 5 GHz tunable
Gain
30 ∼ 35 dB
Bandwidth
20 MHz
Tx
Rx Control
2.3
Channels IF freq.
4 1st : 10.7 MHz , 2nd : 160 MHz
Channels IF freq. Output volt.
up to 16 1st : 160 MHz , 2nd : 40 MHz 4 Vpp
Gain Phase
0 ∼ −20 dB ±90◦
Developed Smart Antenna Testbed System Overview
While theoretical studies are useful for analysis and simulation purposes, their implementing on real hardware and validation with actual measurement data will be the meaningful challenge. Certain architectures available for smart antennas were discussed in the previous section from the view point of SDR. We developed a smart antenna testbed system selecting the IF sampling super heterodyne scheme. In this section, the details of the smart antenna testbed systems are described.
2.3.1
Radio Frequency (RF) Components
The eight sleeve antennas, linearly spaced by a half wavelength, were used. The RF transceiver configuration is shown in Fig.2.7. It employs Yttrium-Iron-Garnet (YIG) bandpass filters; hence, the RF frequency is tunable from 2 to 5 GHz. In order to achieve an easy phase adjustment at the IF stage, bandpass filters are replaced with a combination of lowpass and highpass filters. The phase and amplitude of the IF output signal can be adjusted by ±90◦ and in the range 0 ∼ −20 dB. The IF output frequency at the receiver is 40 MHz and the IF input frequency is 10.7 MHz. The detailed specifications are listed in Tab.2.2.
CHAPTER 2. SMART ANTENNA TESTBED SYSTEM
YTF (MLFM-42008)
ZMX-8GLH
TUF-1
RF Amp
27
PLP-50
TFAS-2
PLP-25
Gain MAR-6
MAV-3
Rx IF OUT
+12dBm
ZJL-7G
2way 0o
Gain
2way 0o -4 JSPHS-150
Lo
Phase Shifter 2way 0o
-4
PLP-150
0dBm
MAV-11
Shift
+20dBm
SSG ZRON-8G
(a) Receiver Diagram (only 4 CHs depicted.)
0dBm
ZRON-8G
2way 0o
Shift
PLP-150
+20dBm
SSG
MAV-11
2way 0o
Lo
Phase Shifter
-4
JSPHS-150
Gain
2way 0o -4 +12dBm
RF Amp YTF (MLFM-42008)
Tx IF IN
Gain TFAS-2
PLP-50
PLP-25
MAV-11
(b) Transmitter Diagram (only 4 CHs depicted.)
(c) Photograph Fig. 2.7: Radio Frequency (RF) transceiver.
CHAPTER 2. SMART ANTENNA TESTBED SYSTEM
2.3.2
28
Digital Signal Processing Unit
The digital signal processing unit was developed to integrate and evaluate smart antenna signal processors. It consists of the signal processing board and controller board. The signal processing board incorporates 16 channels of ADCs and DACs, and high density FPGAs (approximately 1 mega equiv. gates) for signal processing2 . A general-purpose CPU (SH4, 200 MHz, HITACH) is used as a system control unit and numerical computation coprocessor with floating-point arithmetic (32 bits). The length of the data bus between the CPU and FPGA is 32 bits. The operating system (OS), NetBSD, is embedded in this system [66]. It also offers a data communication interface via Ethernet. The block diagram of the digital signal processing unit is shown in Fig.2.8 and the photographs are illustrated in Fig.2.9. The data are captured and stored in embedded memory blocks in FPGA where approximately 4 kilowords can be collected for every complex baseband channel with I and Q. The external memory subboard with a SDRAM DIMM module is also available for a large number of continuous samples up to approximately 16 megawords per complex baseband channel of I and Q when using 512 MB SDRAM module. ADCs and DACs have 14-bit resolution and up to 80 MHz and 165 MHz conversion rates, respectively. Our research group has developed several prototype processing units including the abovementioned one for a smart antenna testbed system (also see Appendix C) as • 2-channel receiver processor [67]. • 16-channel receiver and transmitter processors with distributed processing architecture of 4 (data acquisition and IF processing) + 1 (adaptive array processing) FPGAs [68–71]. • 4-channel receiver processor with high performance FPGA (Altera STRATIX) featured by embedded DSP blocks [73]. • 16-channel transceiver processor on single board (current system) [74]. The received RF signals at each antenna element are downconverted into IF. This system performs frequency downconversion again with quasi-coherent detection by digital signal processing. Digital downconversion is a distinguishing feature of the SDR receiver that places ADCs as close to the antenna as possible, digitizes broad band signals and subsequently, performs all functions completely with the software. By replacing the analog IF downconversion stages with digital signal processing, downsizing of system scale, reduction of power consumption, etc. can be achieved. FPGAs are able to perform smart antenna processing with downconverted complex baseband I/Q signals after digital downconversion with quasi-coherent detection.
2
In this work, only eight ADC channels were used by the IF sampling scheme. Alternatively, 16 ADC channels can cover an 8-element array with baseband sampling scheme at each channel of I and Q
CHAPTER 2. SMART ANTENNA TESTBED SYSTEM
29
Analog Unit
I
I’s
Uplink
Q’s
Processing
DDC DDC
A/D A/D A/D A/D
IF
MEMORY MEMORY
N-CHs
RF
Digital Processing Unit
FPGA
N-branches
Q FPGA N-CHs
N-branches
Q’s
Processing
I’s
Downlink
DDC DUC
IF=10.7
D/A D/A D/A D/A
Ethernet MEMORY MEMORY
N-CHs
IF
CPU (SH4 200MHz)
IF= 40 MHz
RF
Rx
I Tx
Q
Fig. 2.8: Block diagram of digital processing unit.
CHAPTER 2. SMART ANTENNA TESTBED SYSTEM
30
External I/O 16CH DACs
FPGAs
16CH ADCs Memory Sub-board
BNC Connectors
(a) Signal processing board including ADCs, DACs and FPGAs.
(b) Controller board (CPU, LAN). Fig. 2.9: Photographs of digital signal processing parts.
CHAPTER 2. SMART ANTENNA TESTBED SYSTEM
Table 2.3: Specifications of signal processing board.
ADC (Rx)
Part Resolution Max. sampling rates Analog Input BW Aperture jitter Channels
AD9245 (Analog Device) 14 bits 80 MHz 500 MHz 0.3 ps (RMS) up to 16
DAC (Tx)
Part Resolution Max. data rates Channels
DAC904 (Burrbrown) 14 bits up to 165 MHz up to 16
Part
Altera STRATIX EP1S40 × 2 41,250 (1 Mega Gates) 3,423,744 bits 112 (9 × 9) 12
FPGA
LEs Embedded Memory Embedded DSP multipliers PLLs
Table 2.4: Specifications of CPU board.
CPU
Part Operation freq. Performance
SH4 (HITACHI) 200 MHz 360 MIPS
OS
NetBSD 1.5
User I/F
Ethernet 100base-T
31
CHAPTER 2. SMART ANTENNA TESTBED SYSTEM Analog
Digital Down Converter
Digital
cos( ω c ⋅ n)
5 GHz
I
I
Mixer
LNA
AMP
40 MHz
A/D A/D
NCO LPF
LO
LO
Q
Q
Demodulation
32 Msps
BPF
Adaptive
Mixer
LPF
Processing
BPF
32
− j sin(ω c ⋅ n) f IF
fc
fs
f IF
fc 2fc
Fig. 2.10: Digital downconverter with quasi coherent detection.
2.3.3
Digital Receiver Implementation
Digital downconversion with quasi-coherent detection can be easily implemented by using NCO, mixer, and lowpass filters, as shown in Fig.2.10. It consists of NCO digital local oscillator and a couple of Finite Impulse Response (FIR) lowpass filters. When digitizing the received analog signals at the IF band, only one ADC is required for each antenna element so that it can reduce the system scale by half when compared with the baseband sampling systems. Bandpass signals can be expressed as a sum of two quadrature components that are π/2 out of phase. In general, a bandpass signal is represented by x(n) = xI (n) cos ωc n + xQ (n) sin ωc n,
(2.4)
where xI (n) is the in phase component, xQ (n) is the quadrature component of the signal x(n), and ωc is the center frequency of the bandpass signal (carrier frequency). The downconversion process shifts the carrier frequency ωc to the baseband. It performs a multiplication of the incoming bandpass signal x(n) with the complex phasor e−jωc n = [cos ωc n − sin ωc n]. Subsequently, it lowpass filters the signal of x ˜(n) = x(n) [cos ωc n − sin ωc n] 1 [xI (n) + xI (n) cos 2ωc n − jxI (n) sin 2ωc n = 2 −jxQ (n) + xQ (n) sin 2ωc n + jxQ (n) cos 2ωc n] .
(2.5)
The desired frequency shift is accomplished with this operation. After lowpass filtering, the second harmonic components are filtered out and the result remains as the desired complex baseband signal representation of x(n) as LPF (˜ x(n)) =
1 [xI (n) − jxQ (n)] 2
(2.6)
[1]. If the sampling frequency is four times the IF center frequency, a combination of the NCO and mixer can be easily implemented. In this system, the combination of NCO and
CHAPTER 2. SMART ANTENNA TESTBED SYSTEM X(n-7)
x(n+1)
Q D
D Q
X(n-6)
X(n)
h1
Q D
D Q
X(n-5)
X(n-1)
h2
D Q
X(n-4)
X(n-2)
X(n-7)
Q D
D Q
X(n-3)
x(n+1)
Q D
D Q
X(n-6)
X(n)
Q D
D Q
X(n-5)
X(n-1)
Q D
D Q
X(n-4)
X(n-2)
Q D
D Q
X(n-3)
h4
h3 s2
s1
Q D
33
s3
LOOK UP TABLE (LUT)
s4
m+w
m+w+1 m+w+2
Yt
Yt
Fig. 2.11: (a) Conventional FIR filter using Symmetry, and (b) FIR Filter using LUT (Look Up Table) mixer was implemented with a switching circuit in sequential manner of {0, x(t), 0, −x(t)}. The FIR lowpass filters of 8 taps were used for simplicity. NCO and Mixer The downconversion process requires an numerical controlled oscillator (NCO), a mixer multiplying bandpass signal, and a digital local sine/cosine signal generated by NCO as shown in Fig.2.10. There exist various methods by which these can be implemented. Generally, the method of generation of sinusoidal signals by LUT is generally used; however, this system performs downconversion function at a rate of 4 times that of the carrier frequency of bandpass signal. Thus, multiplication-free simple implementation is available. Lowpass Filter Digital filter implementation on FPGAs has many advantages over general-purpose DSPs. It is said that a DSP and microprocessor can implement an 8-tap FIR filter at 5 Msps and an offthe-shelf FIR filter at 30 Msps; however, an FPGA can implement an identical filter at over 100 Msps because, as described in the preceding sections, an FPGA is suitable for parallel processing and distributed arithmetic [63]. Digital downconversion requires two of lowpass filters per channel. The inputs are mixed signals of NCO and bandpass signal and the outputs are complex baseband signals of in phase and quadrature. Lowpass filters suppress a second harmonic component and allow only frequency-shifted signals into baseband. In this system, the FIR filter has 8-tap 12-bit registers that are arranged in a shift register configuration. The output of each register, also called a tap, is represented by x(n), where n is the tap number. Each tap is multiplied by filter coefficients h(n), and subsequently, all the products are summed. The equation for this filter is y(n) =
L � k=1
h(n − k) · x(k),
(2.7)
CHAPTER 2. SMART ANTENNA TESTBED SYSTEM Oversampling 40 Msps 10 MHz
34
10 MHz
IF Bandpass Signal
IF Bandpass Signal
DDC 40 MHz
Undersampling
Baseband I / Q Signal
Low-IF Bandpass Signal
32 Msps 8 MHz
Fig. 2.12: Sampling schemes. where L is the filter length. In the case of a linear phase response FIR filter, the coefficients are symmetric around the center values. The FIR filter can be reconstructed, as shown in Fig.2.11(a), by taking advantage of the symmetry; this reduces the circuit resource. In addition, Fig.2.11(b) can be optimized by an FPGA using LUTs in a memory block. The multiplication and addition can be performed in parallel using LUTs [63]. As mentioned in the previous section, the recent FPGA technologies can provide high-performance FIR filters using dedicated MAC blocks operating at greater than 200 MHz [102]. Relation of Undersampling and Digital Downconversion This system was designed by taking into consideration both the sampling schemes of oversampling relatively low frequency signal and the undersampling high frequency signal. Figure 2.12 displays these examples. An IF bandpass signal centered at 10 MHz can be oversampled by an ADC at 40 Msps maintaining the 4 times oversampling rule. As shown in the case of undersampling, the sampling rate of an ADC should be chosen appropriately. In Fig.2.12, 32 Msps is suitable for the IF frequency of 40 MHz. In the case of undersampling, the sampling rate fs must satisfy the condition as 2fu 2fl ≤ fs ≤ k (k − 1)
(2.8)
where fu and fl is the upper and lower frequency bound, respectively, of an IF signal, and k(≥ 2) is an integer number [82]. Figure 2.13(a) presents the relationships between undersampling range versus k at the bandwidth of 2, 3, and 4 MHz. Further, the 4 times oversampling condition is given by fs = 4fb
(2.9)
where fb is the in-band signal frequency (downconverted version of input IF signal frequency by undersampling). The above two conditions are plotted in Fig.2.13(b), and the intersections imply that both conditions are satisfied. Tab.2.5 shows the values of the intersections that are shown in Fig.2.13(b). Hence, in this system 32 Msps is typically chosen for undersampling the IF signal at the center frequency of 40 MHz.
CHAPTER 2. SMART ANTENNA TESTBED SYSTEM
35
Undersampling Range ��
80 Upper Bound @ BW=4MHz Lower Bound @ BW=4MHz Upper Bound @ BW=3MHz Lower Bound @ BW=3MHz Upper Bound @ BW=2MHz Lower Bound @ BW=2MHz
70
8 times ��
4 times ��
fs (MHz)
Freq. (MHz)
60
��
50
40
��
K=3
��
K=4 K=5
30 �� 20
K=6
��
�
10 2
3
4
5
6
K=2
�
�
��
��
fb (MHz)
k
(a) Undersampling range.
(b) Undersampling and DDC conditions.
Fig. 2.13: Determination of sampling frequency (IF center freq.=40MHz).
Table 2.5: Candidate sampling frequencies for undersampling of IF signal at 40 MHz. k
fs (MHz)
2
53.333
3
32.000
4
22.857
5
17.778
6
14.546
��
CHAPTER 2. SMART ANTENNA TESTBED SYSTEM
2.4
36
Undersampling and ADC’s Input Frequency Limitation at IF Band
The undersampling (bandpass sampling or subsampling) technique is a useful alternative solution for converting high frequency bandpass signals to lower frequency digital signals exploiting intentional aliasing because of hardware limitations such as data conversion devices and RF analog devices. Traditionally, the sampling rates in an analog-to-digital conversion are determined by Nyquist sampling criterion that specifies the minimum sampling rate required for signal reconstruction. However, in fact, for bandpass signals, the undersampling technique at rates that are more than twice the signal bandwidth can also provide a perfect reconstruction of the original information using in-band aliasing [82, 83]. However, the problem is that the dynamic range of ADCs is limited by Signal to Noise Ratio (SNR) degradation that is caused by the sampling jitter effect, which results in amplitude errors. This, eventually, leads to phase errors in the constellation pattern of the phase modulated signals such as Phase Shift Keying (PSK). We have some research papers including theoretical reviews and mathematical analyses of the jitter effect in analog-to-digital conversion [82–84], as well as certain reports on measurement [85–87]. However, in the communication systems incorporating practical digital downconversion receivers with the undersampling scheme, jitter effects such as Bit Error Rate (BER) and Error Vector Magnitude (EVM) degradation has rarely been reported. This section examines the relationship between the input signal frequency of the ADC and the sampling jitter effect on phase-modulated signals in a digital IF downconversion receiver with undersampling scheme. In order to quantitatively evaluate the jitter effect, we introduced EVM in various clock jitter configurations in the custom testbed system with commonly used and reasonably priced ADCs, the Root Mean Square (RMS) aperture jitter value and sampling rate of which were 0.25 ps and 40 MHz, respectively. The ADC’s aperture jitter value is sufficiently small and can be ignored; however, the sampling clock instability is the critical factor in dominating the total jitter condition of the system.
2.4.1
Sampling Jitter Effect in Undersampling Scheme
As mentioned above, the undersampling technique is an extremely useful technique but careful consideration should be taken of the sampling jitter effect caused by the sampling clock instability. This subsection presents the preliminaries of the sampling jitter effect. Further, the problems in a digital downconversion receiver with undersampling scheme are theoretically formulated and some computer simulation results with PSK and Quadrature Amplitude Modulation (QAM) signals are presented. Sampling jitter is associated with the ADC’s aperture jitter due to the uncertainty of the aperture time in the sample-hold amplifiers and the sampling clock instability of the system. It results in additional noise power. In reality, it is the sampling clock instability that dominates the sampling jitter condition and not the aperture jitter of ADC itself. As the frequency of the input signal increases, the jitter effect becomes more prominent. Theoretically, the input
CHAPTER 2. SMART ANTENNA TESTBED SYSTEM
37
frequency of an ADC is limited by the following relation [89] as LSB/2 dx(t) = 2πfin A cos(2πfin t) < , dt σj
(2.10)
where the input signal x(t) is assumed to be full-scale sinusoidal, given by A sin(2πfin t). fin and σj are the input IF frequency and RMS aperture jitter, respectively. Since the Least Significant Bit (LSB) � 2A/2M , the input frequency is limited as fin
0. If an eigen vector ei is orthogonal to V H of rank L, i.e., ei is orthogonal to the range of V , shown by the following relation as N [V H ] =⊥ R[V ],
(3.5)
then ei is an eigenvector of Rxx with the eigenvalue of σ 2 as � � Rxx ei = V Rss V H + σ 2 I ei = σ 2 ei ,
(3.6)
The eigenvectors of Rxx with eigenvalue of σ 2 lie in the nullspace of V H . On the other hand, some eigenvectors lie in the range of V , and the eigenvalues are ordered as λ1 ≥ λ2 ≥ · · · ≥ λL ≥ λL+1 = · · · = λK = σ 2 .
(3.7)
They can be partitioned into signal and noise components. In a similar manner, the correlation matrix can be also partitioned as H Rxx = U s Λs U H s + U n Λn U n ,
(3.8)
where U s and U n are the unitary matrices of signal subspace and noise subspace, respectively, and Λs and Λn are the diagonal matrices of the eigenvalues.
CHAPTER 3. FAST DOA ESTIMATION PROCESSOR
48
0
Magnitude (dB)
−10
−20
−30
−40
−50
−60 −90
−60
−30
0
30
60
90
Angle (Degree)
Fig. 3.1: Typical MUSIC spectrum (8-element array, two waves from 0◦ and 30◦ with SNR=20dB). The noise subspace eigenvectors of corresponding eigenvalues of σ 2 are orthogonal to the signal subspace and eventually, orthogonal to the array response vectors. Based on this, the MUSIC spectrum is typically expressed by PM U (θ) =
aH (θ)a(θ) , aH (θ)E n E H n a(θ)
(3.9)
where E n is the matrix whose columns consist of noise subspace eigenvectors. In the result spectrum of Eq.(3.9), the peaks appear at the DOAs of incident signals. For example, if two incoherent waves are impinging at an 8-element antenna array from 0, 30◦ with SNR = 20 dB and the typical MUSIC spectrum can be calculated, as shown in Fig. 3.1.
3.2.3
Unitary MUSIC DOA Estimation
In reality, the correlation matrix in Eq.(3.3) is complex-valued. It has been clarified that the EVD with a complex-valued correlation matrix would be a high computational burden1 . Reducing the computational complexity by unitary transformation enables real-valued eigenvalue decomposition with the transformed real number correlation matrix [32–35]. Since the EVD procedure bears a large portion of the entire computational load of MUSIC-like subspace based algorithms, real-valued eigenvalue decomposition is a very attractive option to reduce the computation complexity. If the steering vector of Eq.(3.2) is rearranged in the conjugate 1
Generally, complex number multiplication requires four real number multiplications and two real number additions
CHAPTER 3. FAST DOA ESTIMATION PROCESSOR
49
centro-symmetric manner, the correlation matrix Rxx becomes centro-Hermitian. The realˆ xx can be obtained by an appropriate unitary transformation Q valued correlation matrix R as � � ˆ xx = Re QH Rxx Q . R
(3.10)
where the unitary transformation matrix Q for the M -by-M matrix can be chosen as � � I jI 1 (3.11) Q = √ II −jII 2 or ⎛
Q =
⎞ I 0 jI √ 1 ⎜ ⎟ √ ⎝ 0T 2 −j0T ⎠ , 2 II 0 −jII
(3.12)
on the basis of whether the number of antenna elements is even or odd respectively, where the vector 0 = [0, 0, · · · , 0]T , and I and II are the identity matrix and column flipped identity matrix in the left-right direction, respectively [32, 34, 35].
CHAPTER 3. FAST DOA ESTIMATION PROCESSOR
3.3
50
Digital Signal Processor Design
The computation flow of the unitary MUSIC DOA estimation involves 4 main steps [33, 100]: (1) estimation of the correlation matrix including unitary transformation and spatial smoothing, if necessary, (2) EVD of the correlation matrix, (3) computation of MUSIC spectrum, and (4) 1-dimensional peak search. This section describes the digital signal processor design for the dominant procedures in a unitary MUSIC DOA estimation algorithm, where we assume that the antenna array has a 4-element linear geometry for simplicity. It is possible to extend the processor using more antenna elements in a different geometry. The computation flow of DOA estimation by the spectral MUSIC algorithm is illustrated in Fig. 3.2. First, the correlation matrix Rxx (t) is computed by E[x(t) · xH (t)], where x(t) is the data vector received at the array antenna, E[·] is the expectation operator, and the superscript H denotes the Hermitian conjugate operator. In reality, the average of the correlation matrix with a finite number of snapshots is usually used to approximate the stochastic process. In such a case, the spatial smoothing process decreases the correlation between the incident signals to separate them, although the signals are fully correlated (coherent) with one another. The correlation matrix is decomposed into signal and noise subspace eigenvectors by EVD, and the DOAs can be determined by computing the angular spectrum with an inner product of the noise subspace and the array mode vectors [30]. It appears to be relatively simple to implement the correlation matrix computation, the spatial smoothing filter, and the spectrum synthesis with a dedicated circuit of FPGAs by applying any fast algorithm to them. However, EVD computation, in particular, is rather complex and not suitable for FPGA implementation. In general, the EVD process is believed to have 30 ∼ 50% of the entire computational load of the DOA estimation. In fact, there are many algorithms for EVD problems; however, these are merely numerical solutions for serial processing on general-purpose computers with floating-point arithmetic. Therefore, it is necessary to study a hardware-friendly algorithm that is suitable for the parallelism of dedicated circuit, such as FPGAs.
3.3.1
Correlation Matrix with Unitary Transformation
UMP can extract a signal from the correlated mixed signals using the spatial smoothing technique [43]. With the unitary transformation, EVD, which has the largest computational cost among all procedures, can be solved using only real number arithmetic. In addition, the backward averaging effect is obtained by selecting only the real part in Eq.(3.10). Thus, Forward-and-Backward (FB) spatial smoothing can be simultaneously achieved (see Appendix A) [33]. The first step in the unitary MUSIC algorithm is to transform the input data vector x into y with a unitary matrix Q as y i = QH xi ,
(3.13)
where xi and y i (i = 1, · · · , M ) are the divided M sub-vectors of the snapshot vector and the corresponding transformed sub-vectors for spatial smoothing, respectively, as
CHAPTER 3. FAST DOA ESTIMATION PROCESSOR
51
Obtain the Correlation Matrix R xx
Spatial Smoothing
Obtain Eigenvectors corresponding to Noise Eigenvalues
Generate MUSIC Spectrum With the Eigenvectors
Fig. 3.2: Computational Flow of MUSIC Method
xi = [xi , · · · , xi+K−M ]T ,
(3.14)
y i = [yi , · · · , yi+K−M ]T .
(3.15)
ˆ yy is computed by Eqs.(3.3) By unitary transformation, the real-valued correlation matrix R and (3.10). In reality, however, it is approximated by uniform averaging with certain numbers of snapshots sampled at time nT , where T is a sampling period, as ˆ yy (n) = 1 R N
M n � �
¯ yy,i (m)}, Re{R
(3.16)
m= i=1 n−N +1
where ¯ yy,i (m) = y i (m)y H (m), R i
(3.17)
and N is the number of snapshots. This type of averaging can be implemented by a sliding boxcar FIR filter with unit gain. In the case of hardware implementation, this filter requires such a long shift register that the memory resources are exhausted. Therefore, the first order IIR (Infinite Impulse Response) exponential averaging filter, as shown in Fig.3.3, is a reasonable choice. It requires only a single register. In this figure, the correlation matrix can be written by ˆ yy (n − 1) + ˆ yy (n) = β R R (1 − β)
M �
Re{y i (n)y H i (n)},
(3.18)
i=1
where β(< 1) is the forgetting factor of a real positive number. This type of filter can quickly respond to the non-stationary channel if the smoothing factor β is determined appropriately2 . 2
In this study, β was typically selected as 0.75(1 − 14 ) or 0.875(1 − 18 ) for easy fixed-point arithmetic with shift and add operation
CHAPTER 3. FAST DOA ESTIMATION PROCESSOR
52
Z-1 (REG)
α α = 1 −β
β
Fig. 3.3: Diagram of exponential averaging filter.
3.3.2
MUSIC Spectrum Computation
After the EVD procedure, the MUSIC spectrum of Eq.(3.9) is computed. In order to reduce the system complexity in the fixed-point system, only the denominator in Eq.(3.9) is considered. This reciprocal spectrum can be generated from the sum of spatial DFT spectra of (K − L) noise eigenvectors, which have been transformed to complex values by the inverse unitary transformation, as PMU,reciprocal =
K �
|DFT{Q · ei }|2 ,
(3.19)
i=L+1
where ei is the i-th eigenvector belonging to the noise subspace. The angular spectrum in the spectral MUSIC algorithm should be computed in order to determine the DOAs of incoming signals. There exists an alternative solution in MUSIC algorithms; root-MUSIC is based on solving the roots of the MUSIC polynomial, [33,34]. However, the root-determination problem of the polynomial with complex number coefficients is less suitable for the dedicated circuit computer with fixed-point arithmetic, such as FPGAs. A simple iterative algorithm would be best suited for the fast digital signal processor implementation on FPGAs. The spatial DFT technique can be applied to compute the angular MUSIC spectrum. This has a well-known performance guarantee as well as the simplicity of an FFT algorithm. The DFT can be applied to the computation of the MUSIC angular spectrum as follows. The simple continuous spatial signal model for a 1-dimensional distance is typically given by xd = u(t) · e−j2π·fspa ·d ,
(3.20)
where u(t) includes all the complex-valued time-varying components, and d and fspa are the distance from the first reference antenna element and the spatial frequency, respectively. In the case of array antenna signal processing, we can consider the elements of a snapshot vector as the sampled data at a distance of m · Dspacing in each element of antenna sensors. The distance between each antenna is a discrete value as d → m · Dspacing ,
(3.21)
where m and Dspacing are the indices of the discrete distance and antenna spacing (or spatial period), respectively. However, the spatial frequency depending on the incident DOA still
CHAPTER 3. FAST DOA ESTIMATION PROCESSOR
53
5
16
x 10
14
Magnitude
12 10 8 6 4 2 䎓䎔
䎘䎓
䎔䎓䎓
䎔䎘䎓
䎕䎓䎓
Discrete Spatial Freq. (Index)
0
P/2
䎕䎘䎓
P
䎔
䎘䎓
䎔䎓䎓
䎔䎘䎓
䎕䎓䎓
Discrete Spatial Freq. (Index)
P/2
0
Linear Scale (k) (a)
䎕䎘䎓 䎐䎜䎓
P -90
Linear Scale (l) (b)
䎐䎙䎓
䎐䎖䎓
䎓
䎖䎓
Angle (Degree)
0
䎙䎓
䎜䎓
90
Sinusoidal (θ) (c)
Fig. 3.4: Relationship between DFT indices (k and l) and non-uniform discrete wavefront (θ) in reciprocal MUSIC spectrum (P = 256). remains continuous. Under the plane wave assumption, the continuous spatial frequency can be thought to be P discrete spatial frequencies as 2π · fspa →
2π k, P · Dspacing
(3.22)
where k is the index of the discrete spatial frequency. Based on this, the discrete spatial frequency domain components can be obtained by applying the spatial P -point DFT as Xd [k] =
P −1 2π 1 � xd [m] · e−j P m·k , P
(3.23)
m=0
when Dspacing = λ/2. Eventually, the discrete wavefront θ can be computed from the following relationships of Eqs.(3.24)-(3.25). fspa,discrete =
k sin θ = λ P · Dspacing −1
θ = sin
�
k P/2
(3.24)
� (3.25)
From the above facts, it can be observed that in the MUSIC algorithm, the spatial DFTs of the noise subspace eigenvectors in Eq.(3.19) provide the distribution of the spatial frequency. However, the spatial spectrum obtained by DFT with only a few spatial samples as the antenna array length usually has coarse resolution; an accurate estimation is not possible in this case. That is, high-resolution estimation will not be available from the coarse spectrum because the antenna array length is usually limited for practical reasons. Therefore, the interpolation
CHAPTER 3. FAST DOA ESTIMATION PROCESSOR
⎛l − P/2⎞ θ = sin −1 ⎜ ⎟ ⎝ P/2 ⎠
䎛䎓 䎙䎓
Corresponding DOA
54
䎗䎓 䎕䎓
Linear Region
䎓 䎐䎕䎓 䎐䎗䎓 䎐䎙䎓
θ=
䎐䎛䎓 䎘䎓
dθ dl
(l − P / 2) l=P / 2 䎔䎓䎓
䎔䎘䎓
䎕䎓䎓
䎕䎘䎓
Rearranged DFT Index
Fig. 3.5: Non-uniform discrete wavefront (DOA) corresponding to DFT index (P = 256). of the spectrum should be considered. According to the digital signal processing theory, the DFT spectrum can be finely and smoothly generated by adding zeroes to the spatial samples of the noise eigenvector elements. The spectrum generated by the spatial DFT is completely equivalent to the denominator of Eq.(3.9)3 . Figure 3.4 shows an example of the relationship among the DFT index k, rearranged index l, and corresponding discrete wavefront θ in the reciprocal MUSIC spectrum (denominator of Eq.(3.9)) generated by spatial DFT (DFT bin P = 256). In other words, Fig.3.4(b) is the rearranged version of Fig.3.4(a) (actual order stored in memories) by the relation � k + P/2 (k < P/2) l= (3.26) k − P/2 (k ≥ P/2) From Eqs.(3.25) and (3.26), the concrete discrete wavefronts (DOAs) in Fig.3.4(c) are obtained as � � −1 l − P/2 . (3.27) θ = sin P/2 As shown in Fig.3.4(c), the discrete wavefronts generated by the spatial DFT spectrum are not uniformly spaced. Thus, the estimation resolution in the angular region close to endfire direction becomes lower as the angular spacing gets wider. However, this can be possibly be neglected in the practical sectorized basestation configuration. According to Eq.(3.27), the DOA θ is an inverse sinusoidal function of l. Figure 3.5 shows the effect of non-uniform 3
This implies the angular power spectrum is obtained by scanning main beam toward all directions (P discrete wavefronts).
CHAPTER 3. FAST DOA ESTIMATION PROCESSOR
55
2-Word Shift REG MUSIC Spectrum COMP AND REG XOR Memory Scanning
RAM (LM Search Results)
Index of Local Minimum points in MUSIC Spectrum
Fig. 3.6: Block diagram of local minima detection. discrete wavefronts. In the region between approximately −30 and 30 degrees, the estimation resolution can be approximated by a linear function, the gradient of which is given by the derivative of Eq.(3.27) at l = P/2 (broadside) as � 1 dθ �� [rad]. (3.28) = � dl l=P/2 P/2 In this linear region, the estimation resolution (angular spacing) can be regarded to be almost uniform. Furthermore, the estimation resolution becomes higher with larger P of DFT bin length as that is inversely proportional to P . When P is 256, the estimation resolution is approximately 0.4476◦ in the linear region from Eq.(3.28).
3.3.3
Local Minima (LM) Detection
Instead of determining peaks in the MUSIC spectrum written in Eq.(3.9), the local minima (LM) detection of the reciprocal MUSIC spectrum generated by DFT in Eq.(3.19) is also available; this enables simple division-free implementation. The LM detection can be implemented by a memory scanning circuit comprising a two-word shift register, comparator, and logic gates of XOR and AND, as shown in the LM detection section of the entire DSP block diagram in Fig.3.6. The comparator compares two words loaded in the shift register to output one-bit decision result c(n) that implies the sign of derivative between the indices (n − 1) and n. The AND(⊕) output of, the c(n) and the XOR(⊗) output d(n), notifies the memory writing controller of the transition of c(n) (0 → 1) as � 0 if s(n − 1) > s(n) c(n) = 1 otherwise d(n) = c(n − 1) ⊗ c(n)
(3.29)
e(n) = c(n) ⊕ d(n). This procedure can be implemented by a simple logic circuit with high-speed operation.
CHAPTER 3. FAST DOA ESTIMATION PROCESSOR
3.4
56
Eigenvalue Decomposition Processor
In the next step, the correlation matrix is eigen-decomposed by the EVD processor. Generally, the subspace-based methods, such as the MUSIC algorithm, are based on the EVD of the covariance (or correlation) matrix. In the EVD-based system, the complex logic and heavy computational load are usually disadvantages in the real-time processing. This paper proposes a circuit design of a fast EVD processor that is suitable for real-time processing and can be practically used for adaptive antenna processing. It uses the Cyclic Jacobi method that is well known for simple algorithm and easy implementation; however, its convergence time is slower than that of other factorization algorithms such as QR-method [96]. However, if the fast parallel computation of the EVD with a dedicated circuit like FPGAs and ASICs is concerned, the Cyclic Jacobi method can be a suitable choice since it offers a very high degree of parallelism and easier implementation than QR-method [97]. This study uses the hardwarefriendly CORDIC algorithm for fixed-point vector rotators and arctangent computers that are the basic processors of this design.
3.4.1
Cyclic Jacobi Method
This section describes the basic principle of the Cyclic Jacobi method, an EVD computation technique. It can be implemented with a simple iterative process of plane rotations. This method solves symmetric eigenvalue problems by applying a sequence of orthonormal rotations to the left and right sides of the target matrix R (∈ RN ×N ) as �
E T · R · E = D, ∵ E = J1 · J2 · J3 · · · , J = W 12 · W 13 · W N −1,N
�
(3.30)
where W pq is an orthonormal plane rotation over an angle θ in the (p, q) plane, whose elements are wpp = cos θ, wpq = sin θ, wqp = − sin θ, and wqq = cos θ (p > q), and is defined as Eq.(3.2). J is the multiple rotation of W pq ’s in the cyclic-by-row manner of (p, q), which is termed a Jacobi sweep; the superscript T and N denote the transposition operator and array length, respectively. ⎛ ⎞ 1 ⎜ ⎟ .. ⎜ ⎟ . ⎜ ⎟ ⎜ ⎟ ⎜ ⎟ cos θ · · · sin θ ⎜ ⎟ ⎜ ⎟ .. .. (3.31) W pq = ⎜ ⎟ . 1 . ⎜ ⎟ ⎜ ⎟ − sin θ · · · cos θ ⎜ ⎟ ⎜ ⎟ . ⎜ ⎟ .. ⎝ ⎠ 1 Theoretically, it is certain from the infinite number of transformation of the matrix R that E and D converge into the matrix, whose column vectors are composed of eigenvectors and
CHAPTER 3. FAST DOA ESTIMATION PROCESSOR
57
the matrix, whose diagonal elements are eigenvalues. A symmetric matrix R is transformed to R� by plane rotation as R� = W Tpq · R · W pq ⎛ � · · · r1p ⎜ . .. ⎜ .. . ⎜ ⎜ � � ⎜ rp1 · · · rpp ⎜ ⎜ . .. = ⎜ .. . ⎜ ⎜ r� · · · r� ⎜ q1 qp ⎜ . .. ⎜ .. . ⎝ � · · · rN p
� r1q .. .
···
� rpq .. .
···
···
� rqq .. .
···
···
� rN q
···
··· ···
⎞ .. . � rpN .. . � rqN .. .
⎟ ⎟ ⎟ ⎟ ⎟ ⎟ ⎟ ⎟. ⎟ ⎟ ⎟ ⎟ ⎟ ⎠
(3.32)
By the above transformation, only the p-th and q-th rows and columns of R� are changed as Eq.(3.32). The optimal rotation angle in a (p, q) plane is determined by Eq.(3.33). The basic strategy of the Cyclic Jacobi method is that the iterative process of the plane rotation converges the (p, q) and (q, p) elements of the target matrix into zero. � � = rqp =0 rpq
(3.33)
In a similar manner as described above, matrix R converges into a diagonal eigenvalue matrix. In the Cyclic Jacobi method, the off-diagonal quantity S (h) is defined by � ! � N �1 � 2 (h) {rii }2 , (3.34) S (h) = � �R(h) �F − 2 i=1
where � · �F denotes the Frobenius norm. Therefore, if S (h) converges into zero, the target matrix R becomes the eigenvalue diagonal matrix as lim S (h) → 0 ⇔ lim R(h) → diag [λ1 , · · · , λN ] .
h→∞
(3.35)
h→∞
On the other hand, the execution of a similarity transformation yields �2 � �2 � � � (h) 2 (h+1) 2 } − {rpq } . S (h+1) = S (h) − {rpq
(3.36) (h+1)
From Eq.(3.36), the maximal reduction of S (h) is obviously obtained if rpq condition for an optimal angle and maximal reduction of S (h) , is achieved as � � 2rpq 1 1 −1 = tan−1 τ, θopt = tan 2 rpp − rqq 2 where τ =
3.4.2
2rpq rpp −rqq
= 0. The
(3.37)
[96, 97].
CORDIC Algorithm
The CORDIC algorithm is operated in one of two modes?rotation mode and vectoring mode [98]. In this study, the rotation mode is used for fixed-point vector rotations and the vectoring
CHAPTER 3. FAST DOA ESTIMATION PROCESSOR
58
mode is used for computing the optimal rotation angle by arctangent of τ . In the case of the rotation mode, the CORDIC equations are ⎧ −i ⎪ ⎨ xi+1 = xi − yi · di · 2 , (3.38) yi+1 = yi + xi · di · 2−i ⎪ � −i � ⎩ −1 zi+1 = zi − di · tan 2 di = −1 if zi < 0, +1 otherwise where di = ±1 (direction of rotation) and z is the angle accumulator. The CORDIC algorithm provides the following results after a finite number of iterations that is as many as the word length. xn yn zn An
= = = =
where An is a computational gain. On the other hand, the CORDIC ⎧ ⎪ ⎨ xi+1 yi+1 ⎪ ⎩ zi+1
An (x0 cos z0 − y0 sin z0 ) An (y0 cos z0 + x0 sin z0 ) , 0 &n √ −2i i=0 1 + 2
(3.39)
equations for the vectoring mode are = xi − yi · di · 2−i , = yi + xi · di · 2−i � −i � −1 = zi − di · tan 2
(3.40)
di = +1 if yi < 0, −1 otherwise which also provides the following result after a finite number of iterations, as ' xn = An x20 + y02 yn = 0 . zn = z0 + tan−1 (y0 /x0 ) &n √ −2i An = i=0 1 + 2
(3.41)
After the final step, scaling operation must be performed elsewhere in the system. From Eqs.(3.39) and (3.41), the scaling factor Kn is obtained by ( 1 1 √ = ; Scaling factor. An 1 + 2−2i n
Kn =
(3.42)
i=0
Due to the use of 20 for the tangent in the first iteration, the rotation and vectoring modes of CORDIC algorithm are usually restricted to rotation angles between −π/2 and π/2. Circuit Architecture The CORDIC algorithm performs only shift and add operations; hence, it is easy to implement and suitable for dedicated circuit in a fixed-point system. In the implementation of the CORDIC algorithm, we can choose various designs depending on what is given greater importance?circuit resource or performance. CORDIC algorithm can be implemented by bit-serial
CHAPTER 3. FAST DOA ESTIMATION PROCESSOR
59
or bit-parallel, and unrolled or rolled (iterative) architectures [60]. This study uses the bitparallel unrolled CORDIC architecture for high performance. It is a cascade structure of the consecutive CORDIC stages, as shown in Fig.3.7, where arctangent values are precomputed and stored in any memory block. Arctangent Computer If the angle accumulator z is initialized with zero (z0 = 0), the arctangent, θ = tan−1 (y/x), is directly computed using the vectoring mode. The result is taken from the angle accumulator as zn = z0 + tan−1 (y0 /x0 ),
(3.43)
[60]. Scaling in Double Rotation Architecture In CORDIC processing, scaling must be performed to avoid overflow caused by the finite word-length of the fixed-point processor. However, as is seen from Eq.(3.42), the scaling and normalizing operations using pre-computed scaling values cannot be performed only with shift and add operations. It may not be easy to implement the division and square root operation in a fixed-point system. Double rotation by z0 /2 can solve this problem [97]. Let an elementary rotation by angle z0 be composed of double rotation by z0 /2. Hence, Eq.(3.38) is rewritten as ⎧ −2i −i+1 ⎪ ⎨ xi+1 = (1 − 2 )xi − yi · di · 2 (3.44) yi+1 = (1 − 2−2i )yi + xi · di · 2−i+1 . ⎪ � −i � ⎩ −1 zi+1 = zi − di · tan 2 di = −1 if zi < 0, +1 otherwise It requires 4-shift and 5-add operations per iteration stage, as shown in Fig.3.8. The results after a finite number of iterations is (ii)
xn
= An (x0 cos z0 − y0 sin z0 )
yn zn
= An (y0 cos z0 + x0 sin z0 ) . = 0 & = {An }2 = ni=0 (1 + 2−2i )
(ii)
(ii)
An
(3.45)
(ii)
In Eq.(3.45), the computational gain An becomes square root operation free. In addition, double rotation makes the division operation free in the scaling factor as Eq.(3.46). This is because for a given precision b of the shift and add operations, all factors (1 − 2−n ) with n > b (ii) do not contribute to Kn . Thus, the scaling factor can be approximated to a simplified form as n n ( 1 ( 1 − 2−2i 1 = Kn(ii) = {Kn }2 = 1 + 2−2i 2 1 − 2−4i i=0
≈
n/4 )
i=1
*
1( 1 − 2−(4i−2) , 2 i=1
(3.46)
CHAPTER 3. FAST DOA ESTIMATION PROCESSOR
y0
x0 »0
z0
60
const
»0
ADD
ADD
ADD
sign z 0 const »1
»1
ADD
ADD
ADD
sign
z1
const »N
»N
ADD
ADD
ADD
sign z N −1
yN
xN
zN
Fig. 3.7: Unrolled CORDIC Architectures (Rotation Mode)
yk
xk
ADD
»2k
»2k
»k-1
»k-1
zk const
ADD
ADD
sign z k
x k +1
y k +1
z k +1
Fig. 3.8: k-th stage of double rotation (Rotation Mode)
CHAPTER 3. FAST DOA ESTIMATION PROCESSOR 10 10
Off-diagonal Norm
10 10 10 10 10 10 10 10 10
61
4 3 2 1
12 Bits Fixed
0
16 Bits Fixed
-1
20 Bits Fixed
-2
24 Bits Fixed
-3
28 Bits Fixed
-4
32 Bits Fixed
-5
36 Bits Fixed -6
0
2
4
6
8 10 12 Number of Sweeps
14
16
18
20
Fig. 3.9: Reduction of off-diagonal norm with various word-length (6 × 6 random real symetric matrix). which can also be computed only with shift and add operations [97]. Fig3.8 shows the k-th stage of the double rotation. In this work, double rotation unrolled architecture is used for efficient fixed-point implementation.
3.4.3
Fixed-Point Implementation
This section describes the fixed-point implementation of Jacobi EVD processor based on CORDIC. The required number of Jacobi sweeps, the appropriate precision (word-length) for the desired accuracy, and the applicability to the MUSIC DOA estimator are examined. First, it is necessary to determine the number of Jacobi sweeps required to provide the desired convergence level. Figure 3.9 illustrates the reduction of off-diagonal norm to the number of Jacobi sweeps with a 6 × 6 random real symmetric matrix of, for example, 12-bit precision. The off-diagonal reduction is defined as Eq.(3.34) and the lower value implies that it is closer to the diagonal matrix. On general-purpose computers, the 32-bit floating-point operation by the C language converges to the machine zero within a given precision after several Jacobi sweeps; however, Fig.3.9 shows that fixed-point arithmetic does not converge but keeps vibrating from 12 to 36 bits after approximately four Jacobi sweeps regardless of the precision. This is caused by the limited precision of the fixed-point operation. At the cost of computation accuracy, the fixed-point operation achieves simpler circuit implementation, high performance, and low power consumption. Without using an additional convergence decision circuit, fixing the
CHAPTER 3. FAST DOA ESTIMATION PROCESSOR
62
v fixed v float
Fig. 3.10: Errors between vectors. number of sweeps at four may be an appropriate choice. Further, greater accuracy cannot be achieved even with the execution of more Jacobi sweeps. Since a finite number of operations are determined in advance, it can always be computed in the same computation time. Next, the precision of fixed-point arithmetic should be examined. Accuracy within an allowable error range should be guaranteed in order to verify a fixed-point system operation. Eq.(3.47) yields the error ratio where v’s are the vectors whose elements consist of eigenvalues computed in the subscripted ways. Further, � · � denotes the vector norm, and the error between vectors is defined by Error =
�v float − v fixed � �v float �
(3.47)
as shown in Fig.3.10. Fig.3.11 shows the error ratio of the fixed-point arithmetic with various bit-lengths on the CORDIC-Jacobi EVD processor with respect to the 32-bit floating-point operation on generalpurpose computers4 . Fig.3.11 uses a 6 × 6 random real symmetric matrix of 12-bit precision as an input matrix. The longer the word-length in the fixed-point arithmetic, the greater is the accuracy that can be achieved. When it was implemented with more than 16-bit precision, it had less than 0.5% error in the floating-point operation. Approximately 16-bit precision is desirable for practical use. In this paper, the computational load of the processor and the word-length are four Jacobi sweeps and 16-bit, respectively. Regarding the application of the fixed-point arithmetic, the computation accuracy in a practical application should be carefully examined. The fixed-point effect on the computation accuracy was quantitatively calculated. For example, Fig.3.12 shows the result of the DOA estimation performed by the spectral MUSIC method assuming that two waves arrive at the 4-element linear array antenna. The simulation results are sufficiently good for the peaks to appear at precisely the same angles as the floating-point spectrum, where the EVD was 4
It implies that The 32-bit floating-point operation with float type (single precision) in a C compiler with an Intel Pentium machine.
CHAPTER 3. FAST DOA ESTIMATION PROCESSOR
63
4.5 4
Average Error (%)
3.5 3 2.5 2 1.5 1 0.5 0 12
15
20
25 Word-length
30
35
Fig. 3.11: Average error ratio of fixed-point operations to 32-bit floating poing operation (6×6 random symetric matrix).
0
Magnitude (dB)
-10 -20 -30 -40 䎋䏅䎌䎃 䎋䏅䎌䎃
-50
䎋䏄䎌䎃
-60 -70
-90
-60
-30
0 30 Angle (degree)
60
90
Fig. 3.12: MUSIC Spectrum in case of 4-element array antenna and two incident waves (DOAs are −5◦ and 20◦ with SNR = 20dB); (a) 32-bit floating-point operation with a general computer and (b) 16-bit fixed-point operation by the CORDIC-Jacobi EVD processor
CHAPTER 3. FAST DOA ESTIMATION PROCESSOR
64
Obtain Optimal Rotation Angle Rotate Some Vectors of R, E
Sweeps NO
No. of Sweeps = 4 4~5 YES
Fig. 3.13: Computation Flow of Cyclic Jacobi EVD Processor computed by 32-bit floating-point arithmetic on a general-purpose computer and 16-bit fixedpoint arithmetic on a proposed Jacobi EVD processor based on CORDIC. In this simulation, except for EVD computation all the other processes of the MUSIC method, such as correlation matrix, spatial smoothing, and MUSIC spectrum were computed on the general-purpose computer with a floating-point operation.
3.4.4
Processor Structure
As mentioned above, approximately four Jacobi sweeps are sufficient for convergence, and the fixed-point operation with a 16-bit word-length gives a good spectral estimation result. Based on these facts, this section proposes FPGA implementation of the EVD processor. Fig.3.13 shows the computational flow of Cyclic Jacobi EVD processor. As described earlier, the Jacobi type EVD is a very simple algorithm and is merely an iterative process of vector rotations until the desirable convergence level is achieved. The optimal rotation angle is determined from Eq.(3.37) and subsequently, the processor performs a similar transformation of correlation matrix R and unitary matrix E (initial value is identity matrix I) of eigenvectors. After four Jacobi sweeps, the computation is complete, the resulting matrix R converges to the diagonal matrix of eigenvalues, and E becomes the unitary matrix of the eigenvectors with the given precision. The EVD processor consists of CORDIC vector rotators and CORDIC arctangent computers. With an optimum angle obtained by Eq.(3.37), the rotation W pq is determined as Eq.(3.31). The transformation W pq in Eq.(3.32) changes only the p-th and q-th rows and columns of the matrix R. Therefore, the transformation can be simplified as � � � � � � rp cos θ − sin θ r �p T = wpq · = (3.48) r �q rq sin θ cos θ � � rp1 · · · rpp · · · rpq · · · rpN , · rq1 · · · rqp · · · rqq · · · rqN where r k and wpq denote the k-th row vector of the matrix R and the (p, q) plane rotation that
CHAPTER 3. FAST DOA ESTIMATION PROCESSOR
65
ESB(Embedded System Block)
E (Eigen) ( p, k )
R (Correlation)
( q, k ) ( p, k )
rqq − rpp r pq
( q, k )
CORDIC Rotation
( p, k ) ( q, k )
θ opt
CORDIC Arctangent
( p, k ) ( q, k )
Fig. 3.14: Architecture of EVD processor core. is a sub-matrix of W pq in Eq.(3.31), respectively. The right side transformation in Eq.(3.32) yields the same result due to the symmetric property of the matrix R; hence, it does not need to be considered if the second rotations of only two vectors [rpp rqp ]T and [rpq rqq ]T are performed again. The most interesting feature between the QR and Jacobi methods to the symmetric eigenvalue problem is the rith inherent parallelism of the latter one. By grouping non-conflicting rotation, parallel rotation can be performed [95]. That is, N (N − 1)/2 rotations for a Jacobi sweep are grouped by (N − 1) sets consisting of N/2 non-conflicting rotations; hence, the complexity can be decreased by O(N 2 ) from O(N 3 ). In the CORDIC matrix rotator, the CORDIC vector rotators are simultaneously performed with multiple processors using the inherent parallelism of dedicated circuit. It takes N (N − 1)/2 matrix rotations per sweep to compute R and E. Fig.3.14 illustrates the architecture of the EVD processor core, where the ESB (Embedded System Block) is a memory block of an FPGA and stores the correlation matrix and eigenvector matrices.
3.4.5
Computational Load and Expected Performance
The basic arithmetic operation of the EVD processor consists of only shifts and adds. In the double rotation CORDIC stages, the computational load yields � � � � 1 1 (3.49) 4B + B Shifts and 5B + B Adds, 4 4 where B is the word-length and 1/4B is approximately taken for scaling operation from Fig.3.8 and Eq.(3.46). The number of vector rotations required for computing both eigenvalues and
CHAPTER 3. FAST DOA ESTIMATION PROCESSOR
66
eigenvectors is 4N (N − 1)(N + 2). This is because E performs 4 J ’s, J consists of N (N − 1)/2 W ’s, and W requires (N + 2) vector rotations from Eq.(3.30), where N is the matrix dimension5 . Therefore, by addition of the arctangent, the total computational load of the CORDIC-Jacobi EVD processor is � � 21 17 B Shifts + B Adds . (3.50) [4N (N − 1)(N + 2) + 1] × 4 4 On the other hand, a rough estimate of the circuit scale obtained by configuring this computational load with the parallel architecture is approximately (N + 1) × 15K equivalent gates (single 16 bit-CORDIC processor could be synthesized using approximately 15K equivalent gates). For example, if N = 8 (4-element array antenna with real matrix extension and no spatial smoothing) the total circuit scale is approximately 75K equivalent gates. The estimated result is obtained by synthesizing the circuit described by VHDL (Very high speed integrated circuit Hardware Description Language) with the Leonardo Spectrum, Exemplar Logic Inc., where the target device was Altera’s FPGA, APEX20KC [101]. If this computation load is configured by the parallel circuit architecture and one clock cycle is required for the shift or add operation (worst case scenario), the first EVD result appears after [4 × N (N − 1) × 2 + 1] × (B + 1)
(3.51)
clock cycles. For example, if N = 6, B = 16 (in the case of 4-element array antenna and spatial smoothing with 2 sub-arrays of 3 sub-elements), and the operation is performed at the speed of 100 MHz, this system can compute EVD computations at approximately 13, 200 times/sec (75.8 µs/EVD). It is noteworthy that the pipeline processing performed by appropriately placing the register can achieve higher performance than that shown by the above example. Taking into consideration the high-speed mobility under higher frequencies in next-generation communication, it is very difficult to realize the required performance for the robust system to fast fading with general-purpose processor. This proposed EVD processor is basically made of a combinatorial logic circuit. At present, advances in circuit technology are thought to offer high-speed operation of a general combinatorial logic circuit. Such a fast EVD processor can be of practical use in various applications.
5
In array antenna processing where the array length is N , N -by-N correlation matrix with complex numbers can be computed by conversion into an extended form of 2N -by-2N matrix of only real numbers [96]. It is possible to apply the unitary transformation for the real number correlation matrix without extension of the matrix dimension.
CHAPTER 3. FAST DOA ESTIMATION PROCESSOR
12
x
Divider
y
12
Correlation Matrix Section
[
Q x1
RE Re X y 1 ⋅ yX 1H
QH x 2
RE Re X y 2 ⋅ yX 2H
�
�
H
QH x M Unitary TR
[
[
67
Re RE X y M ⋅ yX MH
]
16
CORDIC ATAN θ opt
]
16
( q, k )
R pq
( p, k )
R yy
( q, k )
( p, k )
( q, k )
Real Part Only
( p, k ) ( p, k )
IIR FILTER
]
LM Detection Section
Rq q − R p p
CORDIC ROT.
( q, k )
REG
REG
R yy
E
256-Point Complex FFT EVD Section 256W RAM (FFT Results)
2-Word ShiftREG s(n-1) s(n)
16
ABS
•
16
�
COMP
c(n) AND REG c(n-1)
�
16
Sorted index REG
e(n) FFT Section
# of Waves
Q ⋅ Ei Inverse Unitary TR
Adding (256-N) zeroes, N : # of Sub-elements
d(n)
XOR Memory Scanning
RAM (LM Search Results)
Index of Local Minimum points in MUSIC Spectrum
Fig. 3.15: Block diagram of UMP digital signal processor.
CHAPTER 3. FAST DOA ESTIMATION PROCESSOR
68
Table 3.1: Core performances of dominant procedures (4-element with SS).
3.5
Required Clocks (Mclk )
LEs (Logic Elements)
fmax (MHz)
tmin (µs)
ˆ yy R
N
8,301
27.4
0.04 ×N
EVD
1,836
4,045
110
16.69
FFT & LM Detection
1,356
2,303
114
11.89
Hardware Implementation
The actual implementation was also attempted on single FPGA6 . The entire block diagram of the digital signal processing procedures is shown in Fig.3.15. This is involved in 4 major procedure sections-Correlation Matrix Section, EVD Section, FFT Section, and LM Detection Section. The word-length of every section is shown in this figure. It is assumed that the exact number of waves were predetermined and already known from any other pre-processing method. The procedures with VHDL (Very high speed integrated circuits Hardware Description Language) have also been described7 . Table 3.1 illustrates the roughly estimated performance of the dominant processing cores, where LEs (Logic Elements, see Fig.2.4) represents the number of occupied logic blocks in FPGAs and fmax is the maximum clock frequency at which normal operation can be guaranteed. The minimum computation time tmin is calculated by Mclk /fmax , and N is the number of snapshots. In this chapter, in order to reduce system complexity, we assumed a 4-element uniform linear array (ULA) antenna and that the number of coherent/incoherent waves arriving at the antenna is two. A 256-point radix-4 complex FFT was employed to generate spatial frequency spectrum [103], the FFT with 256 spatial samples composed of 3 elements of the noise eigenvector (1 dimension of array freedom is used for spatial smoothing), and (256 − 3) zeroes are interpolated to ensure that the spectrum is fine and smooth. All the computations were performed by fixed-point arithmetic with 12-bit input data from ADCs. As shown in Tab.3.1, if FFT was performed only once in a 4-element UMP with spatial smoothing (in the presence of two incident waves), EVD had the largest computational load. The pipeline scheduling enables us to divide the entire processing into sub-blocks. That is, if the three subblocks illustrated in Tab3.1 are considered, this system can perform single realization of DOA estimation within approximately 17 µs. The inherent parallelism and optimizability of FPGAs resulted in the fast computation performance. In addition, the recent FPGA manufacturing technology allowed for low electric power consumption at less than approximately 2 watts. Figures 3.16 and 3.17 show the entire evaluation system configuration and its appearance, 6
The implementation was attempted using three different FPGAs-APEX20KC, STRATIX EP1S25, and STRATIX EP1S40 by Altera. For example, STRATIX EP1S25 has approximately 0.6 million equivalent gates, 200 Kb internal memory blocks, and optimized digital signal processing (DSP) blocks [102]. 7 The VHDL sources were synthesized and place-and-routed by Leonardo spectrum (Exemplar Logic Inc.) and Quartus II (Altera).
CHAPTER 3. FAST DOA ESTIMATION PROCESSOR RF = 5 GHz
IF = 40 MHz
#1
32 MSPS
A/D
Receiver
#2
69
A/D
12
12
FPGA DDC / Down Sampling
DDC / Down Sampling
#4 A/D
12
DDC / Down Sampling
12
Estimate of Correlation
Eigenvalue 16 Decomposition (EVD)
16
Ryy Local Minimum Detection
256-Point Complex FFT
16
8
4 ULA Antennas
Ethernet
SH4 (CPU)
CPU Board
Fig. 3.16: Hardware configuration of DOA estimator. respectively. The system architecture is a super-heterodyne IF sampling receiver with quasicoherent detection as mentioned in Chapter 2. RF signals received at an antenna array are downconverted to IF band in analog downconversion receiver, where the RF and IF frequencies are 5 GHz and 40 MHz, respectively. The IF signals are then digitized by ADCs at the rate of 32 MSPS. The undersampled IF signals are again digitally downconverted to complex baseband and subsequently downsampled L-times, where L is an appropriate integer number. As shown in Fig.3.16, single FPGA on AD board performs the digital signal processing of UMP. The user terminal PC communicates with the CPU SH4 via Ethernet, and the CPU controls the UMP via direct 32-bit data bus connection.
CHAPTER 3. FAST DOA ESTIMATION PROCESSOR
70
FPGA
AD
Ext. I/O
For 2CH DACs
AD
AD
AD
For 4CH ADCs
Fig. 3.17: Appearance of UMP digital processing unit integrated on 4-channel prototype board.
CHAPTER 3. FAST DOA ESTIMATION PROCESSOR AWGN
Tx
Rayleigh Fading
Rx AGC
71 12 bits UMP
A/D
Level Adjustment
Max 24-bit Fixed-Point EVD
Fig. 3.18: Equivalent baseband simulation model.
3.6
Performance Assessments
The performance of MUSIC DOA estimation technique has been studied theoretically [33, 36– 38]. However, in this section, the performance in the designed fixed point system is examined. We discusses the estimation performance of the UMP by hardware simulations with Matlab (Math works) on an offline PC. Hardware simulations imply that the fixed-point operation behavior of UMP in VHDL was perfectly described in Matlab m-file. It was assumed that the antennas and analog components prior to UMP had ideal characteristics or those that were well calibrated. In other words, these simulations considered the digital signal processing part only and neglected all system-specific effects of analog parts. It would be more efficient to assess the system without operating the entire system components for various cases. An input level adjustment circuit, such as AGC (Automatic Gain Control), was considered in order to utilize the full scale range of ADCs (typically 12 bits); the performance of UMP would otherwise be degraded because of the low dynamic range of the fixed-point operation with bit truncation. The equivalent baseband simulation model is illustrated in Fig. 3.18. In this section, all the simulations included 200 burst frame data where a single burst consisted of 136 snapshots (symbols). The source waves were π/4-shift QPSK modulated signals.
3.6.1
Noise Channel under Planar Wave Assumption
In the AWGN channel, the standard deviation of the estimated DOA is a good overall performance assessment of an estimation variation to input SNR when the single wave is impinging from broadside. A similar approach has been used in [65]. Figure 3.19 shows the simulation results computed by the 4-element UMP using 16-bit fixed-point operation with spatial smoothing (SS) and by the offline PC with 64-bit floating-point (double precision) operation8 , where the diamond, right-triangled, and left-triangled lines denote the incident DOAs of 0, 30, and 50 degrees, respectively. In addition, the results of 4- and 8-element UMP without SS at 0 degrees are also illustrated by the squared and circled lines, respectively. Based on these results, it is clear that the estimation variation is below 2 degrees if the input SNR is greater than 5 dB within the linear region between -30 and +30 degrees. Further, it can be quantitatively confirmed that the estimation variation could be improved by the use of more antennas. The UMP performs well for an offline PC, although the estimation variation 8
In Matlab, all numbers are stored internally using the long format (64-bit double precision) specified by the IEEE floating-point standard.
CHAPTER 3. FAST DOA ESTIMATION PROCESSOR
Standard Deviation (Degree)
10
10
10
10
10
72
DOA Estimation STD (AWGN, Single Wave)
2
4 Elem. w/SS, DOA=50 deg. 4 Elem. w/SS, DOA=30 deg. 4 Elem. w/SS, DOA=0 deg. 4 Elem., DOA=0 deg. 8 Elem., DOA=0 deg.
1
0
-1
-2
-5
0
5
10
15
20
SNR (dB)
Fig. 3.19: Standard deviation of estimated DOA when single wave impinging at 0, 30 and 50 degrees from broadside. is larger by some degrees because of its finite word-length (16-bit) fixed-point operation. In fact, it can be observed that the floating-point operation has SNR gain that is approximately 10 dB more than the fixed-point operation; this, however, is an unavoidable trade-off between the two. In Fig.3.19, the estimation variation increases as the DOA moves away from the broadside. If an ideal omni-directional antenna pattern is considered, this will be caused only by the non-uniform discrete wavefronts generated by the spatial DFT. The non-uniform discrete wavefront effect is illustrated in Fig.3.20, which shows the DOA dependency of the mean DOA deviation ϑ, where ϑ = E{|θestimated − θtrue |}.
(3.52)
In the case of multiple incident waves, the separability performance representing the manner in which two waves, which are spatially close, can be distinguished from each other can be applied when there exist multiple incident waves. The problems are simplified by considering only two incident waves. The criteria of the successful estimation was ϕ r ϕ = arg max{Rϕ std