Hardware Support for Software Debugging; An Overview. Amin M. Alipour. Benjamin Depew. Department of Computer Science,. Michigan Technological ...
Hardware Support for Software Debugging; An Overview Amin M. Alipour Benjamin Depew Department of Computer Science, Michigan Technological University {malipour, bgdepew}@mtu.edu
Abstract Designing a dependable software is a hard, if not an impossible task. Debugging is necessary for a dependable software product, which occupies a large amount of resources (time and money) in software development. Concurrency defects even have made debugging even harder. Thus, these days, software products are usually shipped with known and unknown bugs. Run-time verification is a technique that monitors the behavior of a program as it runs and verify the conformance of this behavior with the specification of the program. The monitoring take place at software level by instrumenting the program with verification statements, or at a lower level, it can be done by the underlying hardware which is faster but more complex. In last two decades much effort has been spent to design hardware architecture serving to this end. In this paper, we give a brief overview of the recent developments in this field, which seemingly is striving to “Hardware Support for Software Debugging”. Based on an architecture contribution to debugging, we classify it to “Architectures for postmortem analysis” and “Software Monitors”.
1
Introduction
Debugging plays an important role in software development. As computers go everywhere and find new applications; the demand for reliable software increases. It is approximated that software bugs damage the US economy about 59.5 billion dollars annually [13]. Development of quality software demands techniques which manifest software flaws (i.e. error) efficiently and accurately. There are much effort in test and analysis of software in each phase of development. The success of test techniques is highly dependent on the quality of test suits that are provided to the program [25, 2]. The program analysis techniques also have limited power first because of inherent undecidable problems [16], and secondly because of as correctness of a program is tied to the used libraries and transformations done by compiler to produce the executable code [1]. Therefore, a complement approach is run-time monitoring which can be done at either software level or at hardware level[8]. In this approach, real data and control state of a program is accessed, thus, it can capture abnormality in the program execution more precisely. The run-time monitoring of programs can contribute to the software debugging in two ways: (1) collecting data from execution such that when system fails, it gives enough information for reconstruction of failure scenario and analysis of it which this analysis is called “postmortem 1
2 analysis” in jargon of debugging. (2) the behavior of program and state of variables and controls are monitored such that any violation of specification to be detected.Automatic instrumentation tools such as PIN [19] or other tools [9] make deployment of such techniques easier at software level. However, the caveat with the software approach is high performance degradation of programs, which slows down the test process substantially- by 10 to 100 times [5]. An alternative approach, suggests to exploit the performance of the hardware in run-time monitoring of programs [31, 5]. Since hardware can access to detail information about the program execution efficiently,this approach tends to design computing architectures which facilitate the effective extraction of program state in monitoring. In this paper, we review recent developments in this field. To this end, in Section 2, we describe three major replay processor architectures, and subsequently in Section 3, we give some example of architectures which serve as monitors. Finally, in Section 4, we discuss the application of hardware in debugging and conclude the paper.
2
Replay Architectures
Debugging of a program requires understanding of cause of the failure, thus, reproduction of failure scenario has been using by developers for years. In sequential programs the reproduction of failures can be done by check-pointing the statements and using debuggers, but in concurrent program, it is harder, because non-deterministic nature of execution causes bugs to manifest in special threads interleaving[24]. So, recording the execution steps of concurrent programs gained more attention. Software only techniques which serve to this end, suffer from performance overhead [28, 10, 6, 23]. In this section, we introduce replay architectures which continuously record the execution steps on a log file in anticipation of a “trigger”. Trigger usually represents an error or crash [30]. Such log file can be used for reproduction of error or other postmortem analysis[20]. Concurrency and non-repeatable input introduce non-determinism to the program. Thus, a replay architecture must guarantee that replay of logs leads to correct manifestation of the error. In other word, the replay must be faithful[30]. For this reason, the architecture has to capture synchronization races (the order of execution of instructions of threads) and memory race (the order of access to shared data). Observe that, the number events in production runs is usually huge. Thus, the major challenge in these architectures is, to minimize the set of stored events while guaranteeing the faithful replay of log. We look at three replay architectures. Section 2.1 looks at Flight Data Recorder architecture [30], which it is one of the first replay architectures with sub-optimal logging in multiprocessors. Section 2.2 we study Rerun[14] architecture as an improvement of Flight Data Recorder architecture.
2.1
Flight Data Recorder
Xu et al. [30] propose “Flight Data Recorder(FDR)” a hardware-based replay architecture, in cache-coherent multiprocessors. Since, the number of events, in a parallel execution of program is high, recording all production runs (i.e. execution steps) is practically impossible. Thereby, FDR virtually partitions the execution time of program into intervals and continuously records the last interval. FDR a log for reconstruct the initial replay state, which is the system state at the beginning of the interval. This log includes the architectural state of all processors, the
3
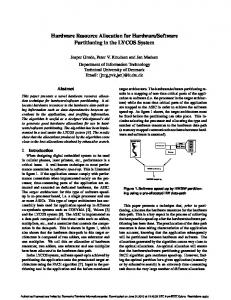
Figure 1: Flight Data Recorder in [30]. physical memory image and I/O state. Furthermore, since FDR cannot predict the occurrence of trigger, it utilizes checkpointing [27] to periodically store a complete system state. By saving the old value of memory location before updates, it incrementally creates logical checkpoints. Moreover, it only records the first update for each memory location in logical checkpoints. Starting from initial replay state, FDR must ensure that each replayed instruction produces the same value as in the program execution. In case of single thread execution, it is achieved by storing the input data. In a multithreading setting, it must record the interleaving too. FDR assumes sequentially consistent (SC) memory model for the base hardware. Then, for tracking programs interleaving, it needs to record a total instruction ordering of the execution. The ordering is captured as pairwise ordering of all instructions. To minimize the number of stored ordering, FDR utilizes the following facts: • There is no need to log the order among the instruction within the same thread, because the ordering among them is fixed. • If two instructions from two threads work on distinct data, the order of their instructions in the replay, would not change the result of replay. Therefore, FDR only records the execution order of instructions which are working on the same set of shared data; which in turn, it reduces the number of recorded interleaving. Figure 1 depicts the FDR architecture. In this architecture values in all buffers and checkpoint buffers are compressed by a hardware compressor based on Lempel-Ziv algorithm [35]. To record I/O events, it treats device interface as a pseudo-processor. Thus, it adds “DMA Race Log Buffer” module to log the interleaving of DMAs as well. This architecture records the system events by “Interrupt Log Module”.
4 The length of interval, in this architecture is one second. To build log of this interval, at any time it stores four checkpoints of the system. At each 1/3 of a second, it creates a new checkpoint and discard the oldest one. This approach helps FDR to keep execution logs of the last one second, which is an acceptable time. For example in 1GHz processors , FDR is able to replay the last one billion cycles of processors. In this architecture when a trigger occurs, processor flushes out all log buffers and copies contents of physical memory to the disc. This configuration for four-processor setting has been evaluated and induced only 7% overhead to performance of the system under commercial workload and stores 4 bytes per 1K instructions [30].
2.2
Rerun
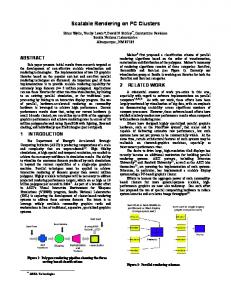
Hower and Hill [14] propose Rerun as a replay architecture to enhance FDR (described in Section 2.1) by proposing new memory race recorder which reduces the log size substantially. A key driving idea is to record how long threads executes without interacting with other threads, instead of recording interleaving of threads. To apply this idea, Rerun introduces the “Episodic Memory Race Recording” technique. In Episodic memory race recording, computations of threads are divided into episodes; which an episode is a sequence of instruction that can run independent of other threads. The question becomes when an episode ends? To answer to this question, recall that Rerun inherits all components of FDR, except its memory recorder. Thus, it relies on SC memory model. Rerun defines conflicting episodes as those pairs of episodes when there is a data dependence across them. SC implies that conflicting episodes cannot be executing simultaneously. Therefore, an episode should end when another thread issues a conflicting memory reference to its data. In this case, the episode of current thread and episode of the other thread starts. Rerun assigns a read set and a write set to each episode, which represent the blocks fo memory that they have accessed. These sets are used to identify conflicting episodes to establish an order among episodes for replay. It utilizes Lamport [15] clock scheme to assign a unique timestamp to episodes. It uses the following policy to assign timestampE , an scalar clock, to the current episode in T hreadE : • When E starts, the timestamp of E is one value greater than the timestamp of last episode in T hreadE . • When E adds a block to its read set, which it was most recently in the write set of a completed episode D, timestampE = M ax{T imestampe , T imesatampD + 1} • When E adds a block to its write set, which most recently was in the write set of a completed episode D and in read sets of completed episodes D10 , .., Dn0 ; timestampE = M ax{T imestampe , T imesatampD + 1, T imesatampD10 + 1, ..., T imesatampDn0 + 1} The Rerun implementation depicted in Figure 2, adds the following hardware state to store the local state of a thread: 1. Read and Write vectors to track read/write sets of the current episode, 2. Timestamp register, to hold the timestamp of the current episode, and 3. Memory reference counters for number of the current episode’s references.
5 Moreover, this implementation adds a memory timestamp register for each L2 cache bank. This register holds the maximum timestamp of all blocks that map to this bank. The amount of hardware added to the base system is substantially lower than FDR, such that it requires 166 bytes per core while FDR requires at least 4KBytes. Experiments show that, despite of less hardware modifications, Rerun works as well as FDR [14].
Figure 2: Rerun Architecture (a) Base system configuration (b) L2 cache bank (c) Core internals. Dark components represent new hardware elements to the base system. (Courtesy of [14])
3
Hardware Monitors
Efficient run-time monitoring of programs can be exploited to improves debugging or reliability of programs. Many security flaws and safety violations can be reported and in some cases prevented by keeping track of the execution of the program [26]. For example, malicious input data from a network can change the execution of program to security attacks like code injection[11], which monitoring of flow of data in program execution can prevent it [12]. There are many software based runtime monitoring [22, 21, 7]. They have two major deficiencies,(1) severe performance degradation and (2) since, they mostly rely on compiler techniques, in some situations, such as aliasing, they are not accurate [32]. In this section, we present architectures which serve two general run-time monitoring of a program, in Section 3.1 and 3.2.
3.1
iWatcher
Zhou et al. [32, 31, 34] devise “iWatcher”, a hardware architecture which supports memory monitoring. iWatcher allows programmers to associate a monitoring function to a portion of memory. Any access to the “watched” memory, triggers the corresponding monitoring function. Since iWatcher can monitor all accesses to the watched memory, it can be used to detect and prevent memory related faults such as buffer overflow, memory leaks and stack smashing. Its flexibility in number of memories to monitor and functions to define, distinguishes it from hardware-based watchpoints [29] that is implemented in the Intel x86- which supports only four watchpoints. This architecture provides two system calls iWatcherOn() and iWatcherOff as the interface for programmer. Programmers can insert these functions into the source code wherever monitoring is needed. iWatcherOn() method specifies the memory addresses to be monitored, types of accesses (read/write or both), monitoring function to trigger in the occurrence of such event.
6 After execution of iWatcherOn(), iWatcher will invoke the specified monitoring function upon a triggering access to the watched memory. Programmer can use iWatcherOff() to disable monitoring of specific memory addresses. Figure 3 depicts the iWatcher architecture. The shaded components represent extra hardware to implement iWatcher. For fast detection of monitoring of memory access, it adds two bits per word in the L1 and L2 caches called “WatchFlag”. One bit of WatchFlag represents read access and the other one is for write access. Range Watch Table (RWT) is used to store WatchFlags for large regions of memory, while the Victim WatchFlag Table (VWT) stores the flag of displaced lines in the L2 cache. Main check function is a register for entry which maintains the starting of Main check function() library call. Main check functoin() stores the monitoring functions regarding to accesses to specific memories in a Check table.
Figure 3: iWatcher architecture.(Courtesy of [32]) When a memory access triggers the iWatcher, first processor saves its program counter (PC) and the architectural state, then, processor changes the PC to Main check function. Main check function() looks for the proper monitoring function and invokes it. On completion of iWatcher, the execution is transferred back to the program and the processor resumes the program execution by restoring the most recent state which was saved. A comparison between performance of iWatcher and a comparable software-only Valgrind [21] has shown 17 to 167 times improvement on different programs [33].
3.2
Log Based Architecture
When a program and its monitor run on the same shared resources like register files and processors, they compete for resources which slows down the program execution. To address this issue, Chen et al. [4] proposes Log-Based Architectures (LBA), based on decoupling program and its monitor. In LBA program and monitor runs on the separate CPU cores(Figure 4). When an instruction in the program is retired, an event record is generated which comprises of program counter, type, input and output operand identifiers and load/store memory addresses. This record is compressed by VPC3 statistical compression hardware[3]. Afterwards, the compressed records is sent to the lifeguard core. Evaluations has shown the size of compressed record on average is
7 less than one byte [4].
Figure 4: Log Based Architecture. The monitoring function, which is called “lifeguard” in this architecture, is organized as a set of event handlers in Event Type Configuration Table (ETCT). It allows user to define a new event handlers and to insert it into ETCT. When an event record arrives, it is decompressed by the designated hardware. Lifeguard looks up the ETCT for the proper handler and fetches it. Each handler terminates by issuing an nlba (Next LBA record) instruction, which notifies the hardware to start processing the next event record from the input buffer at the decompressor hardware. The communication between the program’s core and the lifeguard’s core is asynchronous and based on the log buffer. However, a full log buffer stalls the program. Thus, LBA uses a large buffer(64KB to 1MB) to ameliorate this issue. Moreover,LBA relies on the operating system to postpone the program’s system calls until the lifeguard completes processing of the its log buffer. Using this, LBA tries to prevent propagation of possible error to the system. The experiments show 4 to 19 times speedup comparing to a comparable software-only technique Valgrind [21].
4
Discussion
In this paper we briefly mentioned some proposals to use hardware in software debugging. In this section we discuss the limitations and opportunities of this approach. The motivation behind utilizing hardware in monitoring is performance and accuracy comparing to software-only techniques. Designs of these architectures require performance and accuracy. Two properties that are often hard to attain simultaneously. Moreover, to reduce the cost of implementation such architectures, it is necessary to minimized the modification to the current processor architectures. In addition, understanding of nature of bugs and their manifestation in the execution can help for efficient implementation of run-time monitors. Chen et al.’s [5] suggests that designer’s overspecification of bugs affects performance of run-time monitoring. For example, they discovered, that for identifying code injection faults in run-time, monitoring of only unary instruction can capture majority of such errors. The use of hardware for postmortem analysis and run-time monitoring is increasing. However, we should not overlook other opportunities that hardware architectures may improve the software quality. PathExpander [18] is a good example, such that,it addresses test coverage
8 problem [17], by speculative execution of non-taken branches. In our view, we need to rethink the software development process with new player, computer architecture.
References [1] Balakrishnan, G., Reps, T., Melski, D., and Teitelbaum, T. Wysinwyx: What you see is not what you execute. Verified Software: Theories, Tools, Experiments 1 (2007), 202–213. [2] Bertolino, A. Software testing research: Achievements, challenges, dreams. In FOSE (2007), L. C. Briand and A. L. Wolf, Eds., pp. 85–103. [3] Burtscher, M. VPC3: A fast and effective trace-compression algorithm, June 17 2004. [4] Chen, S., Falsafi, B., Gibbons, P. B., Kozuch, M., Mowry, T. C., Teodorescu, R., Ailamaki, A., Fix, L., Ganger, G. R., Lin, B., and Schlosser, S. W. Log-based architectures for general-purpose monitoring of deployed code. In ASID ’06: Proceedings of the 1st workshop on Architectural and system support for improving software dependability (New York, NY, USA, 2006), ACM, pp. 63–65. [5] Chen, S., Kozuch, M., Gibbons, P., Ryan, M., Strigkos, T., Mowry, T., Ruwase, O., Vlachos, E., Falsafi, B., and Ramachandran, V. Flexible Hardware Acceleration for Instruction-Grain Lifeguards. IEEE Micro 29, 1 (2009), 62–72. [6] Choi, J., and Srinivasan, H. Deterministic replay of Java multithreaded applications. In Proceedings of the SIGMETRICS symposium on Parallel and distributed tools (1998), ACM, pp. 48–59. [7] Condit, J., Harren, M., McPeak, S., Necula, G., and Weimer, W. CCured in the real world. In Proceedings of the ACM SIGPLAN 2003 conference on Programming language design and implementation (2003), ACM, p. 244. [8] Delgado, N., Gates, A., and Roach, S. A taxonomy and catalog of runtime softwarefault monitoring tools. IEEE Transactions on software Engineering 30 (2004), 859–872. [9] Delgado, N., Gates, A. Q., and Roach, S. A taxonomy and catalog of runtime software-fault monitoring tools. IEEE Trans. Software Eng 30, 12 (2004), 859–872. [10] Elnozahy, E. N. An efficient technique for tracking nondeterministic execution and its applications. Tech. rep., Carnegie Mellon University, Pittsburgh, PA, USA, 1995. [11] Francillon, A., and Castelluccia, C. Code injection attacks on harvard-architecture devices. In Proceedings of the 15th ACM conference on Computer and communications security (2008), ACM New York, NY, USA, pp. 15–26. [12] Greathouse, J. L., Wagner, I., Ramos, D. A., Bhatnagar, G., Austin, T., Bertacco, V., and Pettie, S. Testudo: Heavyweight security analysis via statistical sampling. In MICRO ’08: Proceedings of the 2008 41st IEEE/ACM International Symposium on Microarchitecture (Washington, DC, USA, 2008), IEEE Computer Society, pp. 117–128.
9 [13] Hinde, S. The blue screen of death and other deadly bugs. Computers & Security 21, 6 (2002), 491 – 496. [14] Hower, D., and Hill, M. Rerun: Exploiting episodes for lightweight memory race recording. In ISCA08: Proceedings of the 35th International Symposium on Computer Architecture (2008), pp. 265–276. [15] Lamport, L. Time, clocks and the ordering of events in a distributed system. Comm. of the ACM 21 (July 1978), 558–565. [16] Landi, W. Undecidability of static analysis. ACM Lett. Program. Lang. Syst. 1, 4 (1992), 323–337. [17] Larson, E., and Austin, T. High coverage detection of input-related security facults. In Proceedings of the 12th conference on USENIX Security Symposium-Volume 12 (2003), USENIX Association, p. 9. [18] Lu, S., Zhou, P., Liu, W., Zhou, Y., and Torrellas, J. Pathexpander: Architectural support for increasing the path coverage of dynamic bug detection. In Proceedings of the 39th Annual IEEE/ACM International Symposium on Microarchitecture (2006), IEEE Computer Society, pp. 38–52. [19] Luk, C.-K., Cohn, R., Muth, R., Patil, H., Klauser, A., Lowney, G., Wallace, S., Reddi, V. J., and Hazelwood, K. Pin: building customized program analysis tools with dynamic instrumentation. In PLDI ’05: Proceedings of the 2005 ACM SIGPLAN conference on Programming language design and implementation (New York, NY, USA, 2005), ACM, pp. 190–200. [20] Manevich, R., Sridharan, M., Adams, S., Das, M., and Yang, Z. PSE: explaining program failures via postmortem static analysis. ACM SIGSOFT Software Engineering Notes 29, 6 (2004), 63–72. [21] Nethercote, N., and Seward, J. Valgrind:: A Program Supervision Framework. Electronic Notes in Theoretical Computer Science 89, 2 (2003), 44–66. [22] Oplinger, J., and Lam, M. Enhancing software reliability with speculative threads. ACM SIGPLAN Notices 37, 10 (2002), 184–196. [23] Orso, A., and Kennedy, B. Selective capture and replay of program executions. In WODA ’05: Proceedings of the third international workshop on Dynamic analysis (New York, NY, USA, 2005), ACM, pp. 1–7. [24] Park, S., Lu, S., and Zhou, Y. CTrigger: exposing atomicity violation bugs from their hiding places. ACM SIGPLAN Notices 44, 3 (2009), 25–36. `, M., and Young, M. Software Testing and Analysis: Process, Principles, and [25] Pezze Techniques. Wiley, 2008. [26] Ratanaworabhan, P., Burtscher, M., Kirovski, D., Zorn, B., Nagpal, R., and Pattabiraman, K. Detecting and tolerating asymmetric races. ACM Sigplan Notices 44, 4 (2009), 173–184.
10 [27] Sorin, D., Martin, M., Hill, M., and Wood, D. SafetyNet: improving the availability of shared memory multiprocessors with global checkpoint/recovery. In Proceedings of the 29th annual international symposium on Computer architecture (2002), IEEE Computer Society, pp. 123–134. [28] Steven, J., Chandra, P., Fleck, B., and Podgurski, A. jRapture: A capture/replay tool for observation-based testing. ACM SIGSOFT Software Engineering Notes 25, 5 (2000), 167. [29] Thelen, G. Debugging using watchpoints, June 28 2005. US Patent App. 11/169,236. [30] Xu, M., Bodik, R., and Hill, M. A” flight data recorder” for enabling full-system multiprocessor deterministic replay. ACM SIGARCH Computer Architecture News 31, 2 (2003), 122–135. [31] Zhou, P. Architectural support for software debugging. PhD thesis, University of Illinois at Urbana-Champaign Champaign, IL, USA, 2006. [32] Zhou, P., Qin, F., Liu, W., Zhou, Y., and Torrellas, J. iWatcher: Efficient architectural support for software debugging. ACM SIGARCH Computer Architecture News 32, 2 (2004), 224 – 235. [33] Zhou, P., Qin, F., Liu, W., Zhou, Y., and Torrellas, J. iWatcher: Efficient architectural support for software debugging. In Proceedings of the 31st annual international symposium on Computer architecture (2004), IEEE Computer Society, p. 224. [34] Zhou, Y., Zhou, P., Qin, F., Liu, W., and Torrellas, J. Efficient and flexible architectural support for dynamic monitoring. ACM Transactions on Architecture and Code Optimization (TACO) 2, 1 (2005), 3–33. [35] Ziv, J., and Lempel, A. A universal algorithm for sequential data compression. IEEE transactions on Information Theory 23, 3 (1977), 337–343.