Harmonic Source Separation Using Prestored Spectra Mert Bay and James W. Beauchamp School of Music and Dept. of Electrical and Computer Engineering, University of Illinois at Urbana-Champaign, Urbana, IL 61801
[email protected],
[email protected]
Abstract. Detecting multiple pitches (F0s) and segregating musical instrument lines from monaural recordings of contrapuntal polyphonic music into separate tracks is a difficult problem in music signal processing. Applications include audio-to-MIDI conversion, automatic music transcription, and audio enhancement and transformation. Past attempts at separation have been limited to separating two harmonic signals in a contrapuntal duet (Maher, 1990) or several harmonic signals in a single chord (Virtanen and Klapuri, 2001, 2002). Several researchers have attempted polyphonic pitch detection (Klapuri, 2001; Eggink and Brown, 2004a), predominant melody extraction (Goto, 2001; Marolt, 2004; Eggink and Brown, 2004b), and instrument recognition (Eggink and Brown, 2003). Our solution assumes that each instrument is represented as a timevarying harmonic series and that errors can be corrected using prior knowledge of instrument spectra. Fundamental frequencies (F0s) for each time frame are estimated from input spectral data using an Expectation-Maximization (EM) based algorithm with Gaussian distributions used to represent the harmonic series. Collisions (i.e., overlaps) between instrument harmonics, which frequently occur, are predicted from the estimated F0s. The uncollided harmonics are matched to ones contained in a pre-stored spectrum library in order that each F0`s harmonic series is assigned to the appropriate instrument. Corrupted harmonics are restored using data taken from the library. Finally, each voice is additively resynthesized to a separate track. This algorithm is demonstrated for a monaural signal containing three contrapuntal musical instrument voices with distinct timbres.
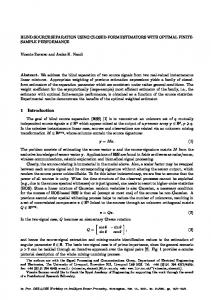
1 Introduction Ordinarily, before separating individual instrument voices into separate tracks, polyphonic pitch detection must be performed on a monaural file instrument mixture. However, we considered two cases: 1) Obtaining F0 data and spectrum analysis from solo recordings before mixing them to monaural. 2) Obtaining F0 data directly from the monaural polyphonic mixture. While our ultimate objective is to solve the more general second case, because of the difficulty of polyphonic pitch detection, we have decided, for now, to focus on the first method. Moreover, starting with solo signals is necessary for evaluating the performance of our separation algorithm by comparing the original solo and separated signals, via listening and computing rms spectral errors. See Fig. 1 for an overview of the pitch detection/separation method. J. Rosca et al. (Eds.): ICA 2006, LNCS 3889, pp. 561 – 568, 2006. © Springer-Verlag Berlin Heidelberg 2006
562
M. Bay and J.W. Beauchamp
individual instrument signals
mixed signal Mix Mix
Harmonic Separation
Short-Time Spectral peaks Spectral Analysis
Polyphonic F0 vs time data Pitch Detection
uncorrupted harmonics Instrument Spetrum Matching
F0 vs time data Collision Detection
Prestored Spectra
Additive Resynthesis F0-vs-time tracks and Reconstructed separated spectra
separated signals
Fig. 1. Flow diagram of the pitch detection/separation algorithm
2 Method 2.1 Spectral Analysis
AMPLITUDE (dB)
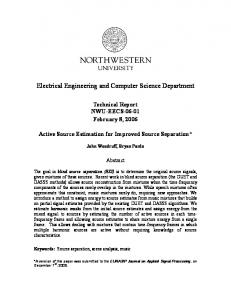
The first stage of the method performs short-time peak-tracking spectral analysis of the test signal to find a set of spectral peaks for each frame (McAulay and Quatieri, 1986; Smith and Serra, 1987; Beauchamp, 1993). Fig. 2 shows the spectral peaks for a single frame corresponding to 1.4 s from the start of a three instrumental voice mixture (Bb clarinet, trombone, and alto saxophone). The 5 s clarinet and saxophone solo passages were clipped from a jazz CD (Art Pepper, 1996) and from a Mozart's Requiem trombone solo recorded by Jay Bulen at the University of Iowa. Obviously, the solos were not intended to harmonize or synchronize in any way. 100
50
0
0
1000
2000
3000 4000 FREQUENCY (Hz)
5000
6000
Fig. 2. Spectrum of three instrument mixture at t=1.4 s
2.2 Polyphonic Pitch Detection For each frame, each fundamental frequency (F0) candidate is represented as mixture of 10 Gaussian PDFs whose means are located at integer multiples of F0 and whose STD bandwidths are 30 Hz. Then the expectation of this candidate F0 is calculated by integrating the product of the mixture of Gaussian distruburions with the input spectrum (see Fig. 3). This is in essence is the correlation of the input with the GMM in the frequency domain.
PDF(f)
Harmonic Source Separation Using Prestored Spectra
563
0.2 0.15 0.1 0.05 500
1000
1500 2000 FREQUENCY (Hz)
2500
3000
Fig. 3. Using a mixture of Gaussian distributions to calculate the expectation of an F0 candidate
Assuming that the input signal contains N simultaneous instrumental voices, the expectations of all possible combinations of N F0s are calculated in a specified F0 search range. The optimum combination which yields the highest expectation is chosen. However, as mentioned above, this method has so far only proved robust for N=1, so at this point we are using F0s based on the original individual tracks. 2.3 Harmonic Collision Detection and Initial Separation
AMPLITUDE dB
For each frame, the frequencies of collided harmonics are calculated theoretically according to the location of the harmonics of the estimated F0s, within the resolution of the spectral analysis. These harmonics are ignored in the spectrum matching step. (see Fig. 4). So at this point, three spectra with missing harmonics for the current frame have been resolved, but they haven't been identified as paricular instruments yet. 100
50
0
0
2000
4000
6000 FREQUENCY
8000
10000
12000
Fig. 4. Initially separated uncorrupted harmonics (denoted by .) for one of the estimated F0s from the spectrum of Fig. 2. * denotes the positions of estimated collisions where harmonic amplitudes are set to zero.
2.4 Instrument Spectrum Library An instrument spectrum library (the training set) was created using University of Iowa musical instrument samples (Fritts, 1997-). This database includes individual tones performed at three different dynamics (pp, mf, and ff) in semitone F0 increments for clarinet, saxophone, and trombone. For each F0, the tones were analyzed (Beauchamp, 1993) and a spectrum space created consisting of the harmonic spectra of all of the frames for the three tones performed at that F0. The number of harmonics
564
M. Bay and J.W. Beauchamp
RELATIVE AMPLITUDE (dB)
for each F0 is given by floor(.5fs /F0), where fs is the sampling frequency. Then a Kmeans clustering algorithm (Rabiner and Juang, 1993) partitioned the space into 10 different clusters, and each cluster's centroid was calculated. (Fig. 5 shows an example K-means “cluster spectrum”.) 10 spectra, which form a "sublibrary", were chosen as a compromise between providing adequate spectral diversity while having a sufficient number of candidates to average within each cluster. We have also experimented with clustering according to spectral centroid ranges of the training data and calculating the average spectrum for each spectral centroid cluster (Beauchamp and Horner, 1995). Both methods yield similar results, but K-means avoids the problem of sparsity of data for some clusters. 100
50
0
0
5
10
15 20 25 30 HARMONIC NUMBER
35
40
45
Fig. 5. One of the K-means cluster spectra from the clarinet library for F0=261.6Hz
2.5 Instrument Spectrum Matching To replace the corrupted harmonics in an initially separated harmonic spectrum, the corresponding F0 sublibraries of the entire spectrum library are searched to find the best match to the uncorrupted input harmonics (see Fig. 4). A least squares (LMS) algorithm is used to obtain the optimum scaling factor between the input and prestored spectra. Basically, the instrument matching part is a nearest-neighbor classifier where the distance measure is a (possibly frequency-weighted) Euclidian distance between the corresponding harmonics of the initially separated and the sublibrary spectra. However, we have found that even 10 cluster spectra are insufficient to avoid artifacts that occur when switching between spectra. Therefore, after choosing the instrument library for the initially separated spectra, LMS is applied again to find an optimum interpolation between the best two spectra out of the 10. This improves matching for individual frames while smoothing transitions as the spectrum changes from one frame to the next. For synthesis we can either replace only the corrupted harmonics (see Fig. 6) or replace all of the spectrum components from the interpolated library spectra. While the former method may yield better fidelity to the test spectra, the latter method can yield a result with fewer audible artifacts. Finally the reconstituted spectra are resynthesized to the individual instrument tracks using sinusoidal additive synthesis (Beauchamp, 1993). Frequencies and amplitudes of the corresponding harmonics are linearly interpolated and phases accumulated between frames, with initial phases set to random values.
Harmonic Source Separation Using Prestored Spectra
565
Fig. 6. The uncorrupted harmonics of an initially separated spectrum (denoted by .) are classified as clarinet and the collisions (denoted by *) are replaced from the best-match prestored spectrum. Note that zero values in the initially separated spectrum are due to the test clarinet's spectrum above 2500 Hz being weaker than the training clarinet's spectrum in the same frequency range.
3 Results Since at the current stage of our research our pitch detection algorithm does not perform well enough for subsequent instrument separation, we used F0s obtained from the solo tracks (see Fig. 7). Nevertheless, instrument matching was blind with respect to the source of each F0. For each frame and each F0, instrument classification resulted from matching the three corrupted harmonic spectra across all three instrument libraries. As it turned out, with the correct F0 contours, the correct instruments were chosen with 100% accuracy. 1000 500 0
0
1
2
0
1
2
3
4
5 Clarinet Trombone Sax
3
4
5
F0(Hz)
1000 500 0
t(sec)
Fig. 7. Pitch contours estimated from the mixture signal (upper) and individual solos (lower)
Original and the separated tracks were compared by listening and by measuring spectral rms error. Most audible artifacts in the separated tracks seemed to be due to unison and octave collisions. Nearly all harmonics of two instruments played in unison are corrupted, while in the octave case every second harmonic of the lower voice and nearly all harmonics of the higher voice are corrupted. However, in practice, two voices are usually not pitched exactly an octave apart, so we could retrieve some upper harmonics of the higher tone in order to estimate its lower harmonics. Figs. 8, 9, and 10 each show spectrograms of the original instrument solo tracks and the corresponding tracks separated from the mixture with collided harmonics replaced.
566
M. Bay and J.W. Beauchamp
Fig. 8. Original (upper one) and separated (lower one) clarinet spectra
Fig. 9. Original (upper one) and separated (lower one) trombone spectra
Fig. 10. Original (upper one) and separated (lower one) saxophone spectra
Audible differences between the original and synthetic tracks include a) inherent differences between original and best-match library spectra, b) loss of reverberation and other noise, c) occasional sound "bobbling" due to high occurrence of harmonic collisions, resulting in insufficient data to estimate the corrupted harmonics correctly, thus resulting in sharp discontinuities, and d) upper harmonic "chattering" due to switching between different library spectra. The latter effect is alleviated by LMS interpolation between the two best library spectra matches. Since the resynthesized tracks are not phase-locked with the originals, we cannot compute an accurate time-domain difference residual. However, we can compute the rms difference between the time-varying harmonic amplitudes of the separated tracks and the originals. Fig. 11 shows graphs of relative-amplitude spectral rms error vs. time for the three instruments. The rms error was calculated using the equation K
errorrms ( j ) = 20 log10(
∑ (x k =1
jk
1 J ∑ J j =1
− αxˆ jk ) 2 K
∑ x 2jk k
)
Harmonic Source Separation Using Prestored Spectra
567
dB
0 −20 −40 0
100
200
300
400
500
600
700
800
0
100
200
300
400
500
600
700
800
0
100
200
300
400
500
600
700
800
0 −50 900
0 −20 −40
Fig. 11. Spectral rms error for clarinet, trombone, and saxophone
where j = frame number, J = number of frames, k = harmonic number, K = number of harmonics, xjk = original track harmonic amplitude, xˆ jk = separated track harmonic
amplitude, and α is a constant scale factor which minimizes the error for the entire signal. The rms error is normalized by the average rms amplitude of the original signal instead of rms value for that frame because in the latter case when the amplitude is very small the error gets extremely high although it is not really audible. Averaging the rms errors over time yielded 21.57% for the clarinet, 14.65% for the trombone, and 27.27% for the alto saxophone. Evaluating the performance by the spectral rms difference might be misleading because although the separated trombone has the lowest rms error, in the authors' opinion the clarinet sounds better. The original, mixture, and separated samples can be found at http://ems.music.uiuc.edu/ beaucham/sounds/separation/.
4 Summary Using pitch-vs.-time tracks derived from three non-harmonizing instrument solos with distinctive timbres and prestored independent instrument spectra to correct collided harmonics, we were able to separate the solos from their monaural mixture with reasonable preservation of quality. rms spectral accuracy varied from about 14% to 27%. An objective evaluation of separation quality would be highly desireable but is nontrivial because of the necessity of comparing to a standard level of degradation (Thiede et al., 2000). We attempted to derive the pitch-vs.-time tracks directly from the monaural mixture, but the results were not accurate enough for reasonable quality separation. However, our method has demonstrated that it is not necessary to have prior knowledge of each initially separated spectrum's instrument identity, because this is sorted out in the spectral matching process.
5 Future Work First, we plan to try out different polyphonic pitch detection algorithms in an effort to improve this important, and ultimately necessary, analysis step. Transition probabilities between notes may be utilized. Second, we plan to increase the size of the spectral data base to handle a wider variety of instruments. Third, we will attempt to use
568
M. Bay and J.W. Beauchamp
estimates of corrupting spectra in order to estimate the true amplitudes of corrupted harmonics so as to obviate their replacement. Fourth, we will attempt to find note boundaries and optimize spectral choices over notes. Fifth, we will attempt to utilize time behavior over notes (vibrato, beating) to more intelligently separate partials.
References 1. J. Beauchamp. (1993) "Unix Workstation Software for Analysis, Graphics, Modification, and Synthesis of Musical Sounds", Audio Eng. Soc. Preprint No. 3479, pp. 1-17. 2. J.W. Beauchamp and A. Horner (1995). "Wavetable Interpolation Synthesis Based on Time-Variant Spectral Analysis of Musical Sounds", Audio Eng. Soc. Preprint No. 3960, pp. 1-17. 3. J. Eggink and G. J. Brown (2003). "A missing feature approach to instrument identification in polyphonic music", Proc. Int. Conf. on Acoustics, Speech, and Signal Processing (ICASSP-03), pp. 553-556. 4. J. Eggink and G. J. Brown (2004a). "Instrument recognition in accompanied sonatas and concertos", Proc. Int. Conf. on Acoustics, Speech, and Signal Processing (ICASSP-04), pp. IV217-220. 5. J. Eggink and G. J. Brown (2004b). "Extracting melody lines from complex audio", Proc. 5th Int. Conf. on Music Information Retrieval (ISMIR-04), pp. 84-91. 6. L. Fritts (1997-). "University of Iowa Musical Instrument Samples", on-line at http://theremin.music.uiowa.edu/MIS.html. 7. M. Goto (2001). "A predominant-F0 estimation method for CD recordings: MAP estimation using EM algorithm for adaptive tone models". Proc. Int. Conf. on Acoustics, Speech, and Signal Processing (ICASSP-01), pp. 3365-3368. 8. A. Klapuri (2001). "Multipitch estimation and sound separation by the spectral smoothness principle", Proc. ICASSP'01, pp. 3381-3384. 9. R. Maher (1990). "Evaluation of a method for separating digitized duet signals", J. Audio Eng. Soc. 38(12), pp. 957-979. 10. M. Marolt (2004). "Gaussian mixture models for extraction of melodic lines from audio recordings", Proc. 5th Int. Conf. on Music Information Retrieval (ISMIR'04), pp. 80-83. 11. R. J. McAulay and T. F. Quatieri (1986). "Speech analysis/synthesis based on a sinusoidal representation", IEEE Trans. Acoust. Speech, Signal Processing, ASSP-34, pp. 744-754. 12. A. Pepper (1996). The Intimate Art Pepper (music CD), tracks 5 & 7. 13. L. Rabiner and B.-H. Juang (1993). Fundamentals of Speech Recognition, Prentice Hall, pp. 125-128. 14. J. O. Smith and X. Serra (1987). "PARSHL: An analysis/synthesis program for nonharmonic sounds based on a sinusoidal representation", Proc. 1987 Int. Computer Music Conf., pp. 290-297. 15. T. Thiede, W. C. Treurniet, R. Bitto, C. Schmidmer, T. Sporer, J. G. Beerends, Ca. Colomes, M.l Keyhl, G. Stoll, K. Brandenburg, and B. Feiten (2000). "PEAQ-The ITU Standard for Objective Measurement of Perceived Audio Quality", J. Audio Eng. Soc. 48(1/2), pp. 3-29. 16. T. Virtanen and A. Klapuri (2001). "Separation of harmonic sounds using multipitch analysis and iterative parameter estimation", IEEE Workshop on Applicatioins of Signal Processing to Audio and Acoustics (WASPAA-01), pp. 83-86. 17. T. Virtanen, A. Klapuri (2002), “Separation of Harmonic Sounds Using Linear Models for the Overtone Series”, IEEE Int. Conf. on Acoustics, Speech and Signal Processing, (ICASSP-02).