HashGraph : an expressive and scalable Twitter users profile for recommendation Julien Subercaze, Christophe Gravier, Fr´ed´erique Laforest
To cite this version: Julien Subercaze, Christophe Gravier, Fr´ed´erique Laforest. HashGraph : an expressive and scalable Twitter users profile for recommendation. 2013 IEEE/WIC/ACM International Conference on Web Intelligence (WI’13), Nov 2013, Atlanta, United States. pp.101-108, 2013.
HAL Id: hal-00973728 https://hal.archives-ouvertes.fr/hal-00973728 Submitted on 4 Apr 2014
HAL is a multi-disciplinary open access archive for the deposit and dissemination of scientific research documents, whether they are published or not. The documents may come from teaching and research institutions in France or abroad, or from public or private research centers.
L’archive ouverte pluridisciplinaire HAL, est destin´ee au d´epˆot et `a la diffusion de documents scientifiques de niveau recherche, publi´es ou non, ´emanant des ´etablissements d’enseignement et de recherche fran¸cais ou ´etrangers, des laboratoires publics ou priv´es.
Towards an expressive and scalable Twitter profile hash for users recommendation Julien Subercaze, Christophe Gravier, Frédérique Laforest LT2C, Télécom Saint-Etienne, Université Jean Monnet 20 rue du docteur Rémy Annino, F-42000 Saint Etienne, France email:
[email protected] Abstract—Microblogging websites such as Twitter produce tremendous amounts of data each second. Identifying people to follow is a heavy task that cannot be completely done by users. Consequently, real time recommendation systems require very efficient algorithm to quickly process this massive amount of data, so as to recommend users having similar interests. In this paper we present a tractable algorithm to build user profiles out of their tweets. We propose a scalable and extensible way of building content-based users profiles in real time. Scalability refers to the relative complexity of algorithms involved in building the users profiles with respect to state of the art solutions. Extensibility considers avoiding to recompute the model for newcomers. Our model is a graph of terms co-occurency, driven by the fact that users sharing similar interests will share similar terms. We show how this model can be encoded as a binary footprint, hence boosting comparison of profiles. We provide an empirical study to measure how the distance between users in the hash space differs from distance between users using standard Information Retrieval techniques. This experiment is based on a Twitter dataset we crawled, and represents 25K users and 1 million tweets. Our approach is driven by real time analysis requirements and is thus oriented on a trade-off between expressivity and efficiency. Experimental results shows that our approach outperforms vector space model by three orders of magnitude, with a precision of 58%.
I.
Introduction
Microblogging websites such as Twitter produce tremendous amount of data each second. For instance, Twitter was known to publish an average of 140 millions tweets per day as of march 20111 . In a single year, this number has increased up to 340 millions tweets2 . In this context, we address the problem of building a “good” user profile model, in order to later exploit it in application such as recommending users to users. We expect a “good” user profile model that maximizes the following characteristics : •
Distance-preserving : The distance between users in the user profile space should preserve the proximity perceived by users with their peers as much as possible.
•
Extensibility : The set of users and their interests evolves with time. However, it should be possible
1 http://blog.twitter.com/2011/03/numbers.html 2 http://blog.twitter.com/2012/03/twitter-turns-six.html
to update the model without having to rebuild it. •
Scalability : Algorithms to compute and compare user profiles should present a complexity as low as possible.
•
Parallellization : These algorithms should also be easily parallelized, to take advantage of the advent of Map/Reduce [1] and related paradigms.
•
Explainability : Recommender systems should be able to produce human-understandable justifications of a recommendation.
In this paper we present a new approach to create and compare profiles of social network users. The solution exploits user-generated contents. In this model, we generate a binary footprint of the user profile that preserves the distance between users profiles in the binary space. Using a binary footprint provides both scalability and parallellization for computing and comparing hashed user profiles. Computing Hamming distance between two hashes is a very fast operation that is computed at the processor level 3 on commodity machines. Moreover, computing newcomers profiles does not require to recompute others’ profiles. The paper is organized as follows. Section II presents related works on building user profiles. Section III describes the core of our proposition, which is a complete processing of user-generated contents resulting in building and comparing user profiles. Details on how we deal with finding representative data structures in the user profile is provided in section III-A. We apply this approach on a Twitter dataset that we crawled, and compete with other content-based techniques, taken from the field of Information Retrieval. Experimental results validate the quality and the real-time property of our approach in section IV. Section V concludes and provides hints for further investigations. II.
On building social user profiles
Twitter analysis has been applied for folksonomies homogenisation [2], tag recommendation [3], [4] or as a corpus for opinion mining and sentiment analysis [5], [6]. It is often used as a datasource for recommender systems. Among these systems a distinction is done between user recommendations and user-generated content recommendations. User-generated content recommendations concern 3 Recent processors with the SSE4 instruction set allow the computation of hamming distance in two operations, XOR and POPCNT
tweets or external content sources suggestions to users whereas users recommender systems suggest users to follow as an output. Both rely on a digital representation of each user’s features, which is usually called the user’s profile. The field of recommender systems blossomed with the advent of Web-scale data analysis, especially with applications in Web search and social networks. While it has grown so as to be now considered as a new data science by itself, we tried to cover how building user’s profile is performed in the myriad of existing works. Exhaustive literature reviews with better coverage can be found in [7], [8], and [9]. To our knowledge, user recommender systems fall in the following schools of thought: Social Network Analysis, Collaborative Filtering, Semantic-based models, and Content-based models. They can also combine these approach for building hybrid recommender systems. Our proposal (see Section III) falls into the content-based model category. A. Social Graphs A possible approach to build user profiles is to consider information from the social network of the user. The assumption is that the proximity of users in a social graph conveys the distance between users’ interests, hence the user recommendation scheme. The proximity between users mainly relies on concepts such as graph density and centrality in order to identify key users in the social graph. In these works, the problem is not taken as ranking all possible friends to a given user. Instead, it most frequently aims at finding clusters of users (sometimes referred as communities) in the social graph. Recommended users are then picked within the user’s cluster. For instance, in [?], the authors introduced a users segmentations method using the Gaussian Mixture Model (GMM). In [10], the authors look for hubs and authorities in the network and then identify possible overlapping and dense communities in the network. The major issues with Social Network were stressed by Social Network Analysis studies [11]. They demonstrate that content and user interactivity prevail over the social graph of the user. Moreover, note that most of the algorithms applied to social graph are NP-hard problems, and even applying heuristics or approximations are at best in polynomial time. B. Collaborative Filtering Collaborative Filtering is a very popular research area for recommender systems. It builds recommendations based on past item-user interactions, previous ratings of items by users. It is primarily used in item recommender systems [12], as competitions are organized around large publicly available datasets, like the Netflix dataset [13]. They can also be used for user to user and item to item recommender systems. State of the art implementations rely on Matrix Factorization methods [14]. Collaborative filtering methods are known to provide good results given enough data. They suffer from the infamous sparse data and cold start problems. Computation is also at stake when the matrix is in a order of magnitude
of billions of lines and columns. However, given both users and items are projected in a feature space, they can provide some justifications for the recommendation they made, for instance by illustrating the recommendation with close users-items interactions in the feature space [14]. C. Semantic-based models Semantic-based models exploit external databases in order to enrich user profiles, especially linked data. In [15], the authors presents Flink, a system that builds user profiles out of users web pages, emails, and even FOAF profiles. FOAF profiles is a cornerstone for these approaches, since it is the de facto standard for modeling user profile in the Semantic Web. This category of user profiles usually complement Collaborative Filtering, as they address the cold start. Nonetheless, they do not scale well, because reasoning over logic fragments involved in the Semantic Web is, even for minimalist fragments like [16] in polynomial time, and at worst NEXPTIME [17]. Regarding the user recommendation process that follows user profile construction, [18] proposed the use of semantic technologies for better people recommendation in a system called Social Adviser. The authors introduced linked data (DBPedia, a semantized version of Wikipedia) in the content extraction process. They have also defined specific scores to measure expertise). Even if no performance analysis is provided, [19] showed that executing SPARQL queries over the Web of data takes at least 20 seconds even with all data locally retrieved in advance, which discards de facto such an approach for real-time purpose. D. Content-based models Content-based models aim at modeling users with predefined features. For instance, users can present geolocation, gender, age. . . while items could have features such as metadata, topics, hashtags, etc. There are many possible features and ways to combine them, thus leading to as many different models. For instance, [20] builds user profiles out of folksonomies. From the user personomy, a bipartite graph is built and greedy algorithm looks for clusters of tags, and most frequent tags in the cluster serve as a signature of this cluster. A large spectrum of works tries to leverage the textual information that were produced or rated by the user. Our proposal that follows in Section III falls in this category. Early popular approaches rely on Vector Space Models (VSM) [21]. VSM uses frequency measures in text corpus in order to leverage semantic information.
Frequencies encompass [22] : •
frequencies of terms in documents, for modeling user interests based on their choice of words.
•
frequencies of terms in the context of a given term for word sense disambiguation.
•
frequencies of word pairs with other word pairs, in order to model latent word pairs semantic relatedness.
Social Graphs Collaborative Filtering Semantic-based Content-based Hybrid
Distance-Preserving
Extensibility
Scalability
Parallelizable
Explanations
− + + + ++
+ − − − −−
−− + −− −− −−
− ++ − ++ +
+ + + − −−
TABLE I: Pro/cons of differents schools of trends for building user profiles as an input to recommender systems.
Most of these techniques use bags of words to characterize users or documents [23], [24]. As the bag of words approach has shown its limitations, machine learning techniques have been developed to go beyond this representation. The most popular are continuous Conditional Random Fields (CRF) [25] and Latent Dirichlet Allocation algorithm [26] (LDA). Both techniques have been used to represent documents [27], [28] and LDA has also been used for topic modeling in social network [29]. The main drawback of these machine learning techniques is the learning part, which is prohibitively extensive for real-time processing. Wallach[27] provides mean execution time for LDA. Results show that each iteration (around 200 are required) takes between 2 and 15 seconds. Although presenting computational issue, these approaches extract knowledge automatically, thus avoiding the hurdle to create ad hoc ontologies like in semantic-based approaches.
approaches but provide them extensibility and scalability using heuristics and hash functions. This approach is described in the next section.
E. Hybrid methods
We adapt the approach of Matsuo & Ishizuka for user profile extraction on twitter. Documents are built from users’ tweets contents. The χ2 -measure is later used in their algorithm to extract relevant keywords or keyphrases, the other words of interest being discarded. In our approach we aim at keeping all relevant words in the users’ profiles, with corresponding weights.
Several works tried to combine usually the aforementioned approaches. For instance, [?] combines Social graph with Collaborative Filtering. They propose Referral Web, a Web-scale system for searching social networks for users and items at both coarse and fine grain. In [30], the authors propose a combination of collaborative filtering and content-based methods for item recommendation. Another combinaison is Content-based mixed with Collaborative Filtering as proposed by [31] for improved recommendations. In [32], twitter users are recommended some followers using content and Collaborative Filtering approaches. Hybrid systems are gaining momentum since they have proven to beat single approach baseline in large and popular dataset. In lessons learnt from the Netflix prize in [33], the authors stress the importance of using a variety of models that complement the shortcomings of each others. This is however beyond the scope of this paper. We focus on a proposal falling into the Contentbased category, and expect that improving one of these categories would improve the overall performance of hybrid recommender systems. We provide a synoptic view of the different schools of trends on building user profile in Tab I, in the light of the criteria presented in Section I that we want to maximise when building a user profile. As a conclusion, the real time processing of textual data cannot be handled efficiently with the use of external data sources or with machine learning techniques. In this paper we developed a document centric approach, with the use of statistics and graph techniques. Given shortcoming stressed in this section and gathered in Table I, the aim is to keep the advantages of Content-based
III.
Binary user profiles
Our approach is inspired by the paper of Matsuo & Ishizuka [34] on keyword extraction. In this article the authors present a method to extract keywords from a single document using statistical information. In a first step their algorithm computes the co-occurency matrix of the terms in each sentence of the document. Then they apply the following procedure "Co-occurrences of a term and frequent terms are counted. If a term appears selectively with a particular subset of frequent terms, the term is likely to have an important meaning. The degree of bias of the co-occurrence distribution is given by the χ2 -measure."
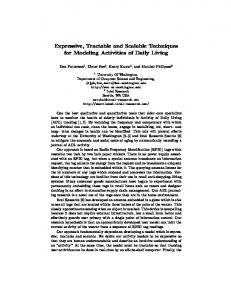
The main steps for user recommendation using our HashGraph approach are the following: 1) 2) 3) 4) 5)
Grab text from user tweets so as to build a document representing the user Preprocess the document Build the graph of terms Compute the hash of the profile Identify the top-k closest users and recommend them
Figure 1 (inspired by [35] to compare keyword extraction processes) summarizes this process. This process must be computable in a real time fashion, so as to react "instantaneously" to the evolution of users tweets topics. Some of these steps do not deserve much attention. In the following we focus on two main actions in these steps. The first action is to transform a document containing a sequence of short text messages into a graph of terms. We present the method for this transformation in section III-A. Since we focus on a real time algorithm, we discuss the complexity of the algorithms used. The second action concerns hashing user profiles and computing a distance between hashed profiles. It is the object of section III-B. We define an undirected weighted graph of terms G =< V, E > where V is the set of vertices (i.e. the terms) and
E is the set of edges. E is an application from V to V . To each e ∈ E, a weight w is associated :w ∈ ℜ, where w is the proximity between the two terms.
Sparsity Average Sparsity standard derivation
0.075 0.15
TABLE IV: Sparsity of the co-occurrence matrix - Based on the tweets dataset
A. User profile as graphs of terms We process the tweets using standard text analysis steps. Instead of sentences split, our algorithm consider a tweet as a sentence, i.e. all the words in a tweet are cooccurring, even if they belong to two different sentences in the same tweet. The idea being to consider a tweet as a unity in terms of performative speech act. The terms are then stemmed using a standard Porter-stemming algorithm. From the set of terms, we restrict the set of candidate terms for building the graphs to the lemmatized tokens and extracted n-grams minus the stopwords. Part of speech tagging is used to extract only nouns, verbs and adjectives from the tweets. Afterwards we build the cooccurrence matrix of the terms based on a tweet (and not a sentence) split. Table II presents an example of a cooccurrence matrix. Once the co-occurrence matrix is built, we transform it into a graph representation. Several approaches are possible. The naive approach would consider the co-occurrence matrix as an adjacency matrix of the graph. We have decided to consider rows of the matrix as an occurence probability distribution and to compare distributions of terms using statistical divergence measure. a a b c d e
3 4 2 1
b
c
d
e
Total
3
4 0
2 0 4
1 2 0 6
10 5 8 12 9
0 0 2
4 0
6
TABLE II: Co-Occurrence matrix example If we normalize the values of each row in the matrix so that the sum is equal to one and assuming that terms are independently occurring, we can consider the rows of the co-occurrence matrix to be a distribution probability. This means that for row of term a, each cell represents the probability that terms a co-occur with an other one. Table III presents the normalized values for the first row. a frequency probability
b
c
d
e
Total
3 0.3
4 0.4
2 0.2
1 0.1
10 1
TABLE III: Co-occurence frequency and probability for the term a For instance probability of co-occurrence of a and c is 0.4. To determine wether two terms belong to a same topic, it is possible to evaluate the distance of their co-occurrence probability distribution. Several statistical measures provide either divergence or metrics, we used the square root of the Jensen-Shannon divergence. Very different terms have a low Jensen-Shannon divergence. They are not of interest in our approach, thus we set a threshold to select the interesting value. A commonly
adopted threshold is 0.95 × log(2) [34]. We ran several tests on our dataset and agreed with this value. We then build the graph of the terms using the selected values. The results for the co-occurrence matrix of our example are depicted in figure 2. 0.81
a 0.69 c
b
0.45 0.44 0.26 0.40 0.72 0.77 d 0.21 0.86 e
Fig. 2: Graph of terms example using table II co-occurrence matrix Computing the divergence between two discrete prob−1) ability distributions of N events requires N ×(N opera2 tions for comparison between rows times N −1 comparisons between each pi and qi . This complexity seems prohibitive but in fact co-occurrence matrices are very sparse; consequently the number of operations is drastically reduced. Analysis from the dataset are presented in Table IV. In the average only 7.5% of the values are defined in the matrix. This seems logical since few terms co-occur with other terms. We observe that users with few tweets (≤ 25) have more dense matrix than users that have much more tweeted. This means that when the matrices are dense, their size is very small, thus the total computation time remains low. We also noticed that users that tweet very much (≥ 400) and that have abnormal small and dense matrices are users that generate automatically their content such as services providing regularly news from their website using a few templates to generate their tweets. For example a web dictionary that would tweet "‘The word FOO has been defined, check out http://mydict/FOO"’ each time a new word is defined, it would be affected a small and dense matrix. Consequently one could use the deviation to the average of the co-occurrence matrix in order to detect spam and automatic generated content. Optimization: To speed-up the graph computation, it is possible to take advantage of the fact that the square root of the JS divergence is a metric. Considering geometrically the relations between three points a, b, c where the distance between a and b and between b and c are known, it is possible to obtain an upper bound for the distance between a and c. Since the square root of JensenShannon is a metric, it verifies the triangle inequality i.e. |a, c| ≤ |a, b| + |b, c|. Considering the fact that we discard distances inferior to a given threshold, we can use the upper bound from the triangle inequality to know without
Step 1 Twitter API @user
{tweets}
Twitter username :
@user
How many friends :
k
@user
a,b,c,d : terms from cleaned tweets
a
Tweet querier
a b c d
Text preprocessing {tweets}
b 3
c 6 7
d 2 5 9
Graph Builder co-occurence matrix
(Stopwords, POS)
(Jensen-Shannon divergence threshold s = 0.3)
Co-occurencer
Search friends
a
in-memory graph model
WI attendee
0.3
b 0.7
0.6 c
0.9 d
You may want to follow : @user1
Tweets
@user2
Tweets
@userk
Tweets
Hash of the graph
Follow ! Follow !
....
Graph Signature
ArgMax k R = {user} / |R| ≤ k (top-k users closest to @user)
1110101.... 0101011 SimHash())
Follow !
node a b c
Querying using in-house API
N bits hash depending on method 1100101010001...................... 01101111 0100100010111...................... 11000000 0000011110100...................... 00101011
1110101.... 0101011 (result of Simhash() applied to values of a,b,c)
25.000 users 1 million of tweets user profiles : precomputed hashes possible friends dataset
Step 2
Fig. 1: Successive steps of the algorithm. We propose with the paper an online demonstration to WI 2013 attendees.
calculating if the distance will be sufficient. If the upper bound is smaller than the threshold, then calculating the distance would be superfluous. In the worst case, if all the distances are over the threshold then the gain is null. In the best case, the two third of the distances helped to avoid the computation of the last third. Thus the maximum reduction is of N/3 operations. In practice, we observed a gain around 8%, which is not to be neglected when dealing with large amount of data. B. Hashing user profiles and distance between profiles Using the technique presented before, each user can have his/her profile modeled as an undirected weighted graph, whose vertices are terms extracted from the user’s tweets. We then require to compute a compact footprint of this graph, that can be used for both storage and comparison. We have investigated different options to encode a graph as a bit array, so that the Hamming distance could be used as a similarity metric between user profiles, and can also be highly prone to be inserted in a Map/Reduce implementation [1]. We found a representative hash function of our user profile modeled as a graph of terms. An important review and some approaches on hashing graphs can be found in [36]. [37] proposed SimHash, a hash function for generating a footprint out of a graph. SimHash can be applied to any kind of resource (document, images . . . ), and in our case a graph. In SimHash, the resource, usually a document, is splitted into token, possibly weighted. Each token is then represented as its hash value, as the result of a traditional cryptographic function applied to the token, which is originally a string. Then, a vector V, of length of the desired hash size, is initialized to 0. For each hash value for
the set of tokens, the ith element of V is decreased by the corresponding token’s weight if the ith bit of the hash value is 0. Otherwise, the ith element of V is increased by the corresponding token’s weight. SimHash works well even for small fingerprints [37], and was historically applied to the detection of near-duplicates of web crawl graphs. We use SimHash to compute binary user profiles by hashing graph of terms with the following settings: •
As SimHash features : the set of edges and vertices of the graph of terms.
•
As Simhash edges weights : the normalized JensenShannon divergence values, which is the edge’s weight.
Nodes and edges must be manipulated as a bit array in SimHash. The hash values, depending on the hash function used are very compact. For example, with the MD5 algorithm, user profiles are 128 bits long, thus allowing to store 64 millions profiles in 1GB. Using MD5, it allows us to manage 820 billions profiles with a collision probability around 10−15 . We tested several hash functions, as presented in our evaluation in the next section. Finding users to recommend is thus solved as getting the top-k closest hashed profiles using a Hamming distance, which has the property to be rapidly computed and easily parallelizable. IV.
Experimental results
A. Building dataset Twitter users share messages called tweets that are limited to 140 characters. Using the public API of Twitter it is possible to retrieve tweets of any user that has not
set its profile private (which is in practice very rare). A users’s sequence of tweets is commonly called the user’s timeline. To create a user’s profile, one could choose either to retrieve all the tweets from the timeline or to select a subset from this timeline. A common intuition is that all the tweets, especially the very old ones may not be of great interest, then selecting a subset would be appropriate. To ensure our choice, and in order to determine the most interesting subset, we conducted some tests on our dataset. In case of analyzing a subset, we then have to determine how to limit this subset : should it be time limited or bounded by a number of tweets.
Cassandra-cluster4 . Due to the current Twitter’s terms of services we are unfortunately not able to publicly provide this dataset.
We first crawled up to 1K tweets for 5K users. We then analyzed how many tweets users actually wrote, and their distribution among time. Table V presents some basic analysis of the collected dataset.
Although containing only 25K Twitter users, our dataset contain more than one million terms in the Lucene index, therefore the curse of dimension would have disastrous consequence on cosine similarity computation with such high dimensional vectors. Therefore, we precomputed TF/IDF vectors for various number of frequent terms, we also precomputed hashes using our approach with three cryptographic hash methods : MD5, SHA-256 and SHA512. Precomputation time are depicted in figure 4. The difference of precomputation time for 25K users between TF/IDF and our approach HashGraph (20 seconds vs 110 seconds) could be overcome by implementation optimisation. One should not forget that we compare an optimized, in-production solution (Lucene) with a research prototype. This difference should not obscure that the average time required to precompute a binary user profile is only 5 milliseconds.
Average tweets per user Standard deviation of tweets per user Average interval between two tweets Standard deviation between two tweets
≈ 120 ≈ 212 ≈ 6 days ≈ 240 days
TABLE V: Tweets distribution Distribution over time is biased by numbers of accounts that produced a few tweets at account creation and later remain unused. However the distribution over time is not a very precise indicator. There is a very broad range of usage patterns. One may tweet regularly whereas one other may tweet once in a while. Therefore it is very difficult to setup a relevant time window. The average tweets number per user is surprisingly low on the sample, however the standard deviation being higher than the mean is an indicator of high volatility of the measure. The volatility of the results shows that once again it is hard to decide wether we should limit the subset on a temporal or on a numerical basis. Since a decision had to be made, our choice went to a numerical basis, for the simplicity and stability of data harvest. From the cumulative results, we were able to select the number of tweets per user to extract, in order to cover the largest set of users. Technically the Twitter API provides 200 tweets per page. Splitted into interval of 200 tweets, we present the distribution in table VI. Limits 200 400 600 800
Percentage of users 81,6% 92,48% 95,43% 96,25%
TABLE VI: Percentage of users having less than a given number of tweets
B. Runtime and Quality We compared our approach against standard Vector Space Model approach. For this purpose, we implemented our solution in Java without any particular optimisation. As a baseline we used the Lucene5 based TF/IDF vectors with the cosine similarity.
The running times for the four methods are shown in figure 3. The x axis shows the number of distance comparisons performed. The slight decrease at the beginning of the HashGraph curves is counter-intuitive and is to our opinion, to be attributed to the Java JIT compiler warm up phenomenon. The HashGraph algorithm clearly outperforms the cosine similarity by three orders of magnitude. For instance, to compute 10 millions comparisons between profiles, the cosine similarity requires 150 seconds, while HashGraphM D5 requires only 253 milliseconds. As one would expect from simple complexity analysis, the running time grows linearly in the number of comparison for both methods. To determine the quality of our approach against the baseline, we use the standard root-mean-square error (RMSE) on pairwise distances between users on the dataset. The distance between two users ui , uj in the baseline is the standard cosine similarity denoted cos(ui , uj ). Let vi , vj being two TF/IDF vectors representing users ui and uj . The similarity is defined as follows : sim(ui , uj ) =
Requests to the Twitter API are limited and timecostly. Since the gain between 600 and 800 is less than 1%, we decided to set the limit at 600 tweets per user, which seemed to us to be an acceptable trade-off. We then gathered about 1 million tweets for around 25K users. The tweets are stored on a three machines
vi × vj ||vi ||.||vj ||
(1)
The distance between two hashes is the normalized version of the standard hamming distance. 4 http://cassandra.apache.org/ 5 http://lucene.apache.org/
0.55
104 Precision
Computation Time (ms)
0.6
105
103 102
0.5 0.45
0
0.2
0.4
0.6
0.8
Comparisons
1
1.2 ·107
0.4
TF/IDF1K
103 104 105 Frequent terms in the TF/IDF legend style
TF/IDF10K HashGraphMD5 HashGraphSHA-256 HashGraphSHA-512
HashGraphMD5 HashGraphSHA256
Fig. 3: Running time of TF/IDF 1K vs HashGraphMD5.
Fig. 5: Precision (1-RMSE) of the different HashGraph functions against TD/IDF with various frequent terms 105 V.
HashGraphSHA512
HashGraphSHA256
HashGraphMD5
TF/IDF 50K
104.5
TF/IDF 1K
Computation Time (ms)
HashGraphSHA512
Fig. 4: Precomputation time
We computed the precision on the set of users using the following RMSE : v uN N uX X 1−t (sim(ui , uj ) − hamming(ui , uj ))2 (2)
In this paper we have proposed a novel technique for designing very compact and scalable user profile based on the content generated by users. Our approach generates a graph of terms from the content, this graph is finally hashed using the HashGraph algorithm. The experimental results demonstrate the computational efficiency of the approach as well as its quality using Vector Space Model as a baseline. However, Vector Space Model is no golden standard. The computed precision in this paper allows us to conclude that the results obtained with HashGraph are coherent with state of the art content based user profile. Therefore further research will aim to determine the perceived quality of recommandation through user evaluation, as well as enhancing the descriptive power of our approach by focusing on the design of a dedicated family of hash functions. Demontration If this paper is accepted, an interactive online demonstration will be available for WI2013 participants. References
i=0 j=i
[1]
The obtained RMSE, regardless of the number of frequent terms used in the cosine similarity distance is greater than 0.5. It also appears that the choice of hash function in simhash doesn’t have much influence on the RMSE. Since MD5 provides the most compact representation with 128 bits, it will be our method of choice.
Conclusion
[2]
J. Dean and S. Ghemawat, “Mapreduce: simplified data processing on large clusters,” in Proceedings of the 6th conference on Symposium on Opearting Systems Design & Implementation - Volume 6, ser. OSDI’04. Berkeley, CA, USA: USENIX Association, 2004, pp. 10–10. E. Zangerle, W. Gassler, and G. Specht, “Using tag recommendations to homogenize folksonomies in microblogging environments,” Social Informatics, pp. 113–126, 2011.
[3]
[4]
[5] [6] [7]
[8]
[9]
[10]
[11]
[12]
[13] [14]
[15]
[16]
[17]
[18]
[19]
[20]
[21]
Y. Song, Z. Zhuang, H. Li, Q. Zhao, J. Li, W. Lee, and C. Giles, “Real-time automatic tag recommendation,” in Proceedings of the 31st annual international ACM SIGIR conference on Research and development in information retrieval. ACM, 2008, pp. 515–522. W. Wu, B. Zhang, and M. Ostendorf, “Automatic generation of personalized annotation tags for twitter users,” in Human Language Technologies: The 2010 Annual Conference of the North American Chapter of the Association for Computational Linguistics. Association for Computational Linguistics, 2010, pp. 689–692. A. Pak and P. Paroubek, “Twitter as a corpus for sentiment analysis and opinion mining,” Proceedings of LREC 2010, 2010. A. Go, L. Huang, and R. Bhayani, “Twitter sentiment analysis,” Entropy, vol. 2009, no. June, p. 17, 2009. G. Adomavicius and A. Tuzhilin, “Toward the next generation of recommender systems: A survey of the state-of-the-art and possible extensions,” Knowledge and Data Engineering, IEEE Transactions on, vol. 17, no. 6, pp. 734–749, 2005. J. L. Herlocker, J. A. Konstan, L. G. Terveen, and J. T. Riedl, “Evaluating collaborative filtering recommender systems,” ACM Trans. Inf. Syst., vol. 22, no. 1, pp. 5–53, Jan. 2004. P. Lops, M. Gemmis, and G. Semeraro, “Content-based Recommender Systems: State of the Art and Trends Recommender Systems Handbook,” in Recommender Systems Handbook, F. Ricci, L. Rokach, B. Shapira, and P. B. Kantor, Eds. Boston, MA: Springer US, 2011, ch. 3, pp. 73–105. A. Java, X. Song, T. Finin, and B. Tseng, “Why we twitter: understanding microblogging usage and communities,” in Proceedings of the 9th WebKDD and 1st SNA-KDD 2007 workshop on Web mining and social network analysis, ser. WebKDD/SNA-KDD ’07. NY, USA: ACM, 2007, pp. 56–65. C. Wilson, B. Boe, A. Sala, K. P. Puttaswamy, and B. Y. Zhao, “User interactions in social networks and their implications,” in Proceedings of the 4th ACM European conference on Computer systems, ser. EuroSys ’09. New York, NY, USA: ACM, 2009, pp. 205–218. J. B. Schafer, D. Frankowski, J. Herlocker, and S. Sen, “The adaptive web,” P. Brusilovsky, A. Kobsa, and W. Nejdl, Eds. Berlin, Heidelberg: Springer-Verlag, 2007, ch. Collaborative filtering recommender systems, pp. 291–324. J. Bennett, S. Lanning, and N. Netflix, “The netflix prize,” in In KDD Cup and Workshop in conjunction with KDD, 2007. Y. Koren, R. Bell, and C. Volinsky, “Matrix factorization techniques for recommender systems,” Computer, vol. 42, no. 8, pp. 30–37, Aug. 2009. P. Mika, “Flink: Semantic web technology for the extraction and analysis of social networks,” Web Semantics: Science, Services and Agents on the World Wide Web, vol. 3, no. 2, pp. 211–223, 2005. S. Muñoz, J. Pérez, and C. Gutierrez, “Minimal deductive systems for rdf,” in The Semantic Web: Research and Applications. Springer, 2007, pp. 53–67. H. J. ter Horst, “Completeness, decidability and complexity of entailment for rdf schema and a semantic extension involving the owl vocabulary,” Web Semantics: Science, Services and Agents on the World Wide Web, vol. 3, no. 2, pp. 79–115, 2005. J. Stan, V.-H. Do, and P. Maret, “Semantic user interaction profiles for better people recommendation,” in ASONAM, 2011, pp. 434–437. O. Hartig, C. Bizer, and J. Freytag, “Executing sparql queries over the web of linked data,” The Semantic Web-ISWC 2009, pp. 293–309, 2009. C. man Au Yeung, N. Gibbins, and N. Shadbolt, “A study of user profile generation from folksonomies.” in SWKM, ser. CEUR Workshop Proceedings, P. Dolog, M. KrÃűtzsch, S. Schaffert, and D. Vrandecic, Eds., vol. 356. CEUR-WS.org, 2008. G. Salton, A. Wong, and C.-S. Yang, “A vector space model
[22]
[23]
[24]
[25]
[26]
[27]
[28]
[29]
[30]
[31]
[32]
[33]
[34]
[35]
[36]
[37]
for automatic indexing,” Communications of the ACM, vol. 18, no. 11, pp. 613–620, 1975. P. D. Turney and P. Pantel, “From frequency to meaning: vector space models of semantics,” J. Artif. Int. Res., vol. 37, no. 1, pp. 141–188, Jan. 2010. O. Phelan, K. McCarthy, and B. Smyth, “Using twitter to recommend real-time topical news,” in Proceedings of the third ACM conference on Recommender systems. ACM, 2009, pp. 385–388. J. Hannon, M. Bennett, and B. Smyth, “Recommending twitter users to follow using content and collaborative filtering approaches,” in Proceedings of the fourth ACM conference on Recommender systems. ACM, 2010, pp. 199–206. J. Lafferty, A. McCallum, and F. Pereira, Conditional Random Fields: Probabilistic Models for Segmenting and Labeling Sequence Data. Morgan Kaufmann, San Francisco, CA, 2001, vol. CONF 18, pp. 282–289. D. Blei, A. Ng, and M. Jordan, “Latent dirichlet allocation,” The Journal of Machine Learning Research, vol. 3, pp. 993– 1022, 2003. H. Wallach, “Topic modeling: beyond bag-of-words,” in Proceedings of the 23rd international conference on Machine learning. ACM, 2006, pp. 977–984. F. Peng and A. McCallum, “Information extraction from research papers using conditional random fields,” Information processing & management, vol. 42, no. 4, pp. 963–979, 2006. M. Pennacchiotti and S. Gurumurthy, “Investigating topic models for social media user recommendation,” in Proceedings of the 20th international conference companion on World wide web. ACM, 2011, pp. 101–102. S. Debnath, N. Ganguly, and P. Mitra, “Feature weighting in content based recommendation system using social network analysis,” in Proceedings of the 17th international conference on World Wide Web. ACM, 2008, pp. 1041–1042. P. Melville, R. J. Mooney, and R. Nagarajan, “Content-boosted collaborative filtering for improved recommendations,” in Eighteenth national conference on Artificial intelligence. Menlo Park, CA, USA: AAAI, 2002, pp. 187–192. J. Hannon, M. Bennett, and B. Smyth, “Recommending twitter users to follow using content and collaborative filtering approaches,” in Proceedings of the fourth ACM conference on Recommender systems, ser. RecSys ’10. New York, NY, USA: ACM, 2010, pp. 199–206. R. M. Bell and Y. Koren, “Lessons from the netflix prize challenge,” SIGKDD Explor. Newsl., vol. 9, no. 2, pp. 75–79, Dec. 2007. Y. Matsuo and M. Ishizuka, “Keyword extraction from a single document using word co-occurrence statistical information,” International Journal on Artificial Intelligence Tools, vol. 13, no. 1, pp. 157–170, 2004. T. Zesch and I. Gurevych, “Approximate matching for evaluating keyphrase extraction,” in Proceedings of the 7th International Conference on Recent Advances in Natural Language Processing. Citeseer, 2009, pp. 484–489. P. Papadimitriou, A. Dasdan, and H. Garcia-Molina, “Web graph similarity for anomaly detection,” Journal of Internet Services and Applications, vol. 1, no. 1, pp. 19–30, 2010. M. Charikar, “Greedy approximation algorithms for finding dense components in a graph,” Approximation Algorithms for Combinatorial Optimization, pp. 139–152, 2000.